
Authored by Georgina Tzanetos, Director of Content
Private markets’ capacity problem is well diagnosed but badly solved.
ILPA’s entire guidance suite for continuation funds is premised on the fact that LPs struggle to evaluate these transactions well under current conditions. The academic pension-governance literature, including Andonov, Hochberg, and Rauh’s 2018 Journal of Finance study of political representation on public pension boards, and Keith Ambachtsheer’s decades of work on the “pension governance deficit”, has documented for years that allocator organizations are structurally under-built for what they are asked to do. Ludovic Phalippou argued that private markets are not so much data-poor as data-overwhelmed. Trade coverage says it a little more plainly: ION Analytics/Mergermarket reported in December 2025 that “small teams” and “internal bandwidth” are among the primary reasons LPs decline to roll into continuation vehicles.[1]
So, the capacity diagnosis is fairly solved for. However, what has not been done is to add the pieces together and price the sum. Each of these literatures examines one product or one governance failure in isolation. However, none of them treat continuation vehicles, NAV facilities, co-investments, and secondaries as a single, compounding decision load landing on one static org chart. And none draws the conclusion that follows from doing so: that every remedy currently on offer is a paper or product fix in the form of a disclosure template, a longer election window, another consultant, or a better software platform handed to teams that lack the hours and the training to use it. While in the past a binding constraint might have been information, in this case, it is practitioner capability. The systemic mispricing it implies is what’s yet to be solved for.
The Arithmetic of the Mismatch
Consider the numerator first. It has grown along four axes simultaneously, each of which now demands asset-level, deal-level underwriting from investors who a decade ago were largely making fund-commitment decisions.
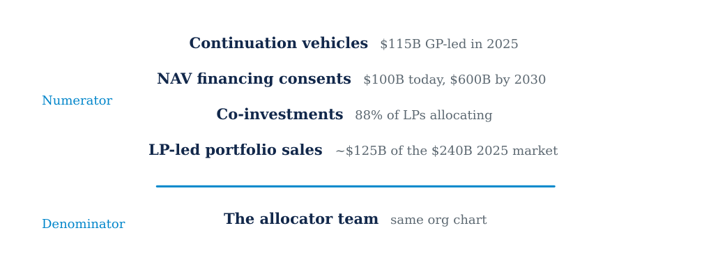
Figure 1. The capacity mismatch
Four axes of decision load over one static org chart
Continuation vehicles are the most obvious, and arguably the most well-documented case. Per Jefferies’ 2025 Global Secondary Market Review, published in January 2026, GP-led secondary volume reached $115 billion in 2025, a 53% increase year over year and 48% of a record total secondary market of $240 billion, itself up 48% and, in Jefferies’ words, “the largest year ever recorded.” GP-led activity is now close to half of all secondary volume, up from roughly 14% in 2023. Jefferies also reports that 78 of the top 100 global sponsors by AUM have executed at least one continuation-fund transaction, that the average continuation vehicle size rose to approximately $900 million in 2025, and that the number of GP-led transactions exceeding $1 billion increased to 29, from 21 in 2024.[2] Each such deal forces every existing LP into a roll-or-sell election, meaning an active, asset-level investment decision, complete with a fairness opinion to interrogate, a conflict to assess, and a valuation to test, typically inside a compressed window.
NAV-based financing is the second axis. As Morgan Lewis noted in September 2024, the Fund Finance Association estimates that the market for NAV facilities “is currently $100 billion and is expected to grow to $600 billion by 2030.”[3] Projections vary and should be read as vendor estimates rather than fact: 17Capital’s own research has cited a $700 billion figure for 2030,[4] while a more conservative Oaktree Capital Management and 17Capital analysis, built on Preqin data, projects roughly $145 billion by 2030.[5] ILPA published dedicated NAV-facilities guidance in 2024 precisely because these fund-level loans, collateralized against portfolio assets, change the risk profile of a fund after the LP has committed, and increasingly require LP consent or at least LP scrutiny that most LPACs are not equipped to give.
Co-investment is the third. The Adams Street Partners 2025 Global Investor Survey found that 88% of LPs plan to allocate up to 20% of their private-market capital to co-investments, the fourth consecutive year of rising interest.[6] Co-investments carry no management or performance fee, which is exactly why they are attractive and exactly why they demand direct, company-level underwriting on a GP’s timeline that LPs frequently cannot meet. Coller Capital’s Barometer has found that the most common reason LPs give for not doing more co-investment is a lack of internal resources to meet GPs’ investment deadlines.[7]
LP-led portfolio sales are the fourth axis, and it is worth being precise about the boundary: the $115 billion of GP-led volume above is a component of the $240 billion total secondary market, not a separate market. The remaining share, roughly $125 billion in 2025, is LP-led. This includes allocators selling their own fund interests, which requires them to price their own book rather than evaluate someone else’s, a distinct sophistication that was once the preserve of specialist buyers.
Now the denominator as the org chart which has not moved.
CEM Benchmarking’s organizational-design research, a 2016 study of 26 large funds with combined assets above $2.7 trillion, found that private equity is the most labor-intensive asset class per dollar: roughly one investment FTE oversees about $0.2 billion of internally managed private equity, against roughly $2.5 billion per FTE for external active public equity—a twelve-fold difference—and CEM found essentially no economies of scale in private-market oversight.[8] CalPERS, the largest US public-pension LP, illustrates the ceiling. Its private equity program held $92.1 billion in net asset value as of December 31, 2024, per its June 2025 Annual Program Review,[9] and is run by a team of roughly 40 people, per the program’s January 2026 board presentation.[10] Deputy CIO Anton Orlich told Markets Group in June 2026 that the portfolio “includes roughly 5,000 companies” and acknowledged the team cannot “police every single portfolio company.”[11] If the largest and best-resourced allocator in the country is stretched, the median allocator might well be considered submerged.
The 2025 NACUBO-Commonfund Study of Endowments, released February 12, 2026 and covering 657 institutions with $944.3 billion in combined assets, reports a median endowment of $253.6 million, with more than one-quarter of participants at $100 million or less;[12] 46.2% of institutions use an outsourced-CIO model, a share that consistently exceeds 50% for organizations with assets up to $500 million.[13] The typical endowment or foundation does not have a two- or three-person alternatives team. It often has a fraction of one person, plus a consultant.
The arithmetic, then, is a numerator growing along four axes against a denominator fixed by budget, board-approval cycles, and public-sector compensation caps. The mismatch is therefore a ratio, and the ratio is deteriorating every year.
Why the Denominator is Fixed
It is worth asking why allocator org charts are so resistant to growth, because the answer is not simple parsimony. Investment staff are a line item that external stakeholders can see. Pensioners, alumni, trustees, and journalists can read a compensation disclosure, but they cannot easily read the fees embedded in a net return. This asymmetry has real consequences, and the cheaper option is the one that usually draws fire.
Harvard is both the well-known example. When Harvard Management Company’s internal managers earned $107.5 million collectively in fiscal 2003, and two bond managers took roughly $25 million apiece the following year,[14] alumni letters and student protests followed—and, per contemporaneous Crimson reporting, several managers left to found private firms where their compensation would never be disclosed.[15] Harvard’s own defense at the time was that internal management cost a fraction of what comparable external managers charged. The University did not exit internal management then (that came in 2017), for different stated reasons.[16] But the mechanism was already visible: disclosure made the cheaper arrangement politically expensive.
The dynamic persists. Andrew Coyne, writing in The Globe and Mail, notes that CPP Investments has grown from 150 employees and $118 million in costs in 2005 to more than 2,100 employees and over $6 billion in annual expenses, with average compensation exceeding $500,000—against a 9.3% return versus a 13.4% benchmark portfolio and negative 0.2% annualized value added since fiscal 2007.[17] Whatever one concludes about the strategy, the column illustrates the governance reality. The moment performance disappoints, and inevitably, the investment team’s cost is the first thing questioned.
The consequence is a stable and perverse equilibrium. Building internal capability requires a board to defend a visible, itemized, attackable expense in exchange for benefits that are diffuse and slow to materialize. Outsourcing requires defending nothing, because the cost disappears into net-of-fee reporting. Boards facing that choice do not need to be short-sighted to choose the quiet path, only accountable to stakeholders who can see one cost and not the other. The denominator is not fixed by inattention per se but fixed by an incentive structure that makes enlarging it expensive to explain.
Why Existing Remedies Fail
Every serious institution that has looked at the problem has responded with a paper fix or a product fix, and the constraint is often missed.
ILPA’s response has been transparency and process. Its 2023 continuation-fund guidance (refreshed and expanded, with a Continuation Fund Disclosure Template developed with Coller Capital and published January 27, 2026[18]) is truly good work. It standardizes what a GP must disclose, recommends a true “status quo” option for rolling LPs, and, per Mayer Brown’s July 2026 analysis, lengthened the recommended election window from 20 business days toward a 30-business-day standard.[19] But read the theory of change embedded in it: it assumes the LP’s problem is that information arrives late, incomplete, and in non-standard form. I idea is “fix the information, and the LP will make a better decision” as the template makes the roll-or-sell evaluation “more efficient.” Efficiency, however, presumes an analyst at the other end with the hours and the training to be made more efficient. A disclosure template handed to a team that has no one who can model a single-asset continuation vehicle’s valuation is simply a better-organized version of the same overload.
The evidence that information is not the binding constraint is in the election data itself.
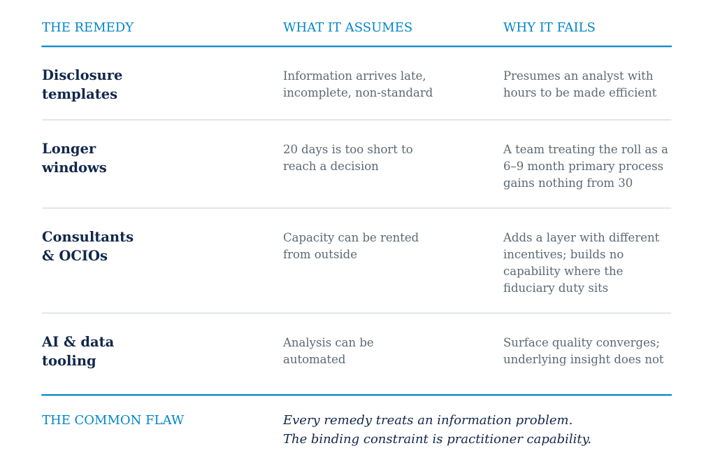
Figure 2. Why the remedies fail
Jefferies found that only 17% of LPs chose to roll in GP-led deals during the first half of 2025, and per Jefferies figures cited by White & Case, only about 17% of incumbent LPs roll their stakes into continuation vehicles on average.[20] The standard explanation is liquidity: LPs starved of distributions want cash. That is understandable. But the ION Analytics/Mergermarket reporting from December 2025 is explicit that liquidity is only one driver. The other causes are that “small teams quickly become overburdened by CV requests and find they cannot make considered decisions within relatively limited timeframes,” and that many LPs treat a roll decision as a new primary commitment—“a six-to-nine-month process,” in one banker’s words—against “the typical 20-day window for CVs.” Simpson Thacher’s Lauren King observed that many LPs “are simply not set up to act swiftly”: “Endowments, pension plans, and similar LPs seem to get a little more nervous about making this kind of decision. They view it as an investment decision, and they are often acting in a fiduciary capacity.” A further tell is British Columbia Investment Management: its global head of private equity, Jim Pittman, told ION that BCI moved from opting to exit in roughly 75% of situations twelve months earlier to closer to 30%, not because it received better disclosure, but because it is well-resourced with sector teams that can underwrite in real time, and because an LP-led sale created deployment headroom.[21] Capability, rather than information, changed the decision. When the default answer to a value-bearing decision is “take the cash because we cannot underwrite the alternative in time,” the system is producing a liquidity reflex dressed as optionality instead of informed choices.
The consultant remedy fails for a subtler reason. Outsourcing to an OCIO or specialist advisor adds capacity, but it also adds a layer whose incentives are not identical to the allocator’s, and it does not build capability inside the institution that must ultimately own the fiduciary decision. The tooling remedy—AI and data platforms—fails on Phalippou’s own logic: if algorithms reward certain language, GPs will supply that language, and “a junior analyst armed with a generative model can now produce materials as polished as those of a seasoned investor,” while “the surface quality converges” and “underlying insight does not.”[22] Better tools in untrained hands amplify strategic behavior rather than dampen it. In every case, the remedy is poured into a vessel (in this case practitioner capability) that no one is enlarging.
Why Almost No One Names It
If the capacity mismatch is this consequential, why is it under-reported? The answer is an incentive analysis of the ecosystem, and it is uncomfortable, because the gap indicts everyone’s customer.
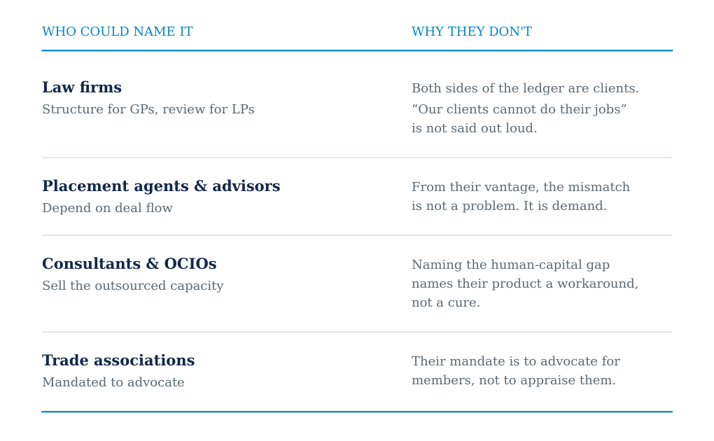
Figure 3. The over-determined silence
Law firms are retained by GPs to structure continuation vehicles and NAV facilities and by LPs to review them; both sides of that ledger are clients, and a strategy whose blunt form is “our clients cannot do their jobs” is not one likely to be said out loud. Placement agents and secondaries advisors depend on deal flow, and the mismatch is, from their vantage, demand. Consultants and OCIOs sell precisely the outsourced capacity that the mismatch creates demand for. Naming the human-capital gap as the core problem is naming their product as a workaround rather than a cure. Even the trade associations are constrained: ILPA represents LPs and must frame the problem as one of GP behavior and market process, not as a candid statement that its own members are under-built. While it can be misconstrued as evasion, this is really the only framing available to a body whose mandate is to advocate for its members instead of appraising them.
The result is silence that is over-determined rather than conspiratorial. No one is suppressing the observation. It is simply that nearly everyone positioned to make it is paid, either directly or indirectly, by someone the making of it embarrasses. And so, the diagnosis surfaces everywhere as an aside, inside pieces about something else, and nowhere as the central point.
Why This Is an Unpriced Risk
The reason to insist on the word “unpriced” is that the consequences do not show up as a discrete loss anyone can point to. They compound quietly, across the system, one under-resourced decision at a time.
When an LP defaults to selling a continuation-vehicle interest it lacks the hours to underwrite, it may be crystallizing a discount on an asset it would rationally have held, meaning a permanent transfer of value from beneficiaries to secondary buyers, booked as “liquidity.” When an LP consents to a NAV facility it has not modeled, it accepts fund-level leverage layered on portfolio-level leverage, changing the risk profile of its commitment without repricing it. When an LP takes a co-investment allocation it cannot diligence on the GP’s timeline, it either passes on fee savings it is entitled to or accepts concentration risk it has not sized. Individually, each is a small, invisible mispricing. Aggregated across thousands of allocators making these elections every quarter, they represent a systematic misallocation whose bill arrives years later: when a NAV-loan-financed distribution is revealed to have been a return of capital rather than a gain, or when the assets LPs sold cheap under time pressure prove to have been the good ones. The Kastiel and Nili Chicago Booth/ECGI study, The Rise of Private Equity Continuation Funds, frames the choice between a “market outcome view” and a “market failure view.” The capacity mismatch is the mechanism that tips the balance toward failure: a market of sophisticated parties is only as efficient as the sophistication actually brought to bear on each decision, and that sophistication is precisely what is being rationed.
The Competence Conclusion
If the constraint is human capital, the remedy is human capital. Every other lever—disclosure, timelines, consultants, tooling—produces value only in proportion to the trained judgment available to pull it. This is the one fix no one in the ecosystem sells, because it does not generate a transaction fee or a software subscription. It generates a more capable practitioner, and a more capable practitioner is a worse customer for most of the ecosystem’s products.
The practical implication is not that LPs should simply hire their way out. Most cannot, given budget and compensation constraints the governance literature has documented for thirty years. It is that the capability of the existing team must rise faster than the complexity of the products it faces. That means treating continuation-vehicle underwriting, NAV-facility risk assessment, and co-investment diligence as core competencies to be taught, benchmarked, and credentialed. The unit of intervention is thus the practitioner.
This is the point at which a professional body’s role becomes a logical endpoint. If one of the biggest unpriced risks in private markets is a shortfall of trained judgment on the buy side, then the institutions whose reason for existing is to raise and certify that judgment are not adjacent to the problem are among the few actors whose incentives are fully aligned with solving it.
[1]ION Analytics / Mergermarket. (2025, December 3). Liquidity needs, internal bandwidth make LPs wary of rolling into continuation vehicles. https://ionanalytics.com/insights/mergermarket/liquidity-needs-internal-bandwidth-make-lps-wary-of-rolling-into-continuation-vehicles/
[2]Jefferies Private Capital Advisory. (2026, January). 2025 global secondary market review: Another record-breaking year. Jefferies. https://www.jefferies.com/insights/the-big-picture/2025-global-secondary-market-review-another-record-breaking-year/
[3]Morgan Lewis. (2024, September 3). ILPA issues guidance on net asset value–based credit facilities (citing Fund Finance Association estimates). https://www.morganlewis.com/pubs/2024/09/ilpa-issues-guidance-on-net-asset-value-based-credit-facilities
[4]17Capital. (2022, April). 17Capital announces closing of €2.6 billion NAV lending fund [Press release]. https://www.17capital.com/news/17capital-announces-closing-of-eu2-6-billion-nav-lending-fund
[5]Alternative Credit Investor. (2024, March 8). NAV finance market forecast to grow to $145bn by 2030 (reporting Oaktree Capital Management and 17Capital analysis). https://alternativecreditinvestor.com/2024/03/08/nav-finance-market-forecast-to-grow-to-145bn-by-2030/
[6]Adams Street Partners. (2025, March). 2025 global investor survey: Top 10 private market insights. https://www.adamsstreetpartners.com/insights/2025-global-investor-survey-top-10-insights/
[7]Coller Capital. (2019, December). Global private equity barometer, winter 2019–20, as reported in Private Equity Wire. https://www.privateequitywire.co.uk/2019/12/02/280933/lps-portfolios-not-ready-economic-downturn-says-coller-capital
[8]CEM Benchmarking. (2017, June). Your guide to internal staffing levels (2016 study of 26 organizations with combined assets above $2.7 trillion). Top1000funds.com. https://www.top1000funds.com/2017/06/your-guide-to-internal-staffing-levels/
[9]CalPERS. (2025, June 16). Private equity annual program review, as of quarter ending December 31, 2024 (Agenda Item 6c, Attachment 1). https://www.calpers.ca.gov/documents/202506-invest-agenda-item06c-01/download
[10]CalPERS. (2026, January 20). The CalPERS private equity turnaround (Board of Administration Educational Day presentation). https://www.calpers.ca.gov/documents/202601-full-private-equity-turnaround-powerpoint/download?inline=
[11]Markets Group. (2026, June 17). CalPERS deputy CIO: Private equity active management will be key as public markets cool. https://www.marketsgroup.org/news/calpers-deputy-cio-private-equity-active-management-will-be-key-as-public-markets-cool
[12]National Association of College and University Business Officers. (2026, February 12). U.S. higher education endowments report stable returns, increase spending to $33.4 billion in FY25 [Press release]. https://www.nacubo.org/Press-Releases/2026/US-Higher-Education-Endowments-Report-Stable-Returns-Increase-Spending-to-33-4-Billion-in-FY25
[13]PNC Institutional Asset Management. (2026, April). Key takeaways from the 2025 NACUBO-Commonfund Study of Endowments. https://www.pnc.com/insights/corporate-institutional/manage-nonprofit-enterprises/key-takeaways-from-the-nacubo-study.html
[14]Harvard Magazine. (2005, March–April). Compensation controversy, continued. https://www.harvardmagazine.com/2005/03/compensation-controversy-html
[15]The Harvard Crimson. (2009, October 21). Alumni call for lower HMC pay. https://www.thecrimson.com/article/2009/10/21/harvard-managers-bonuses-endowment/
[16]Harvard Gazette. (2017, January 25). Course change for Harvard Management Company. https://news.harvard.edu/gazette/story/2017/01/course-change-for-harvard-management-company
[17]Coyne, A. (2025). Overstaffed, overpaid and underperforming, the CPP investment fund is in need of a sharp course correction [Opinion]. The Globe and Mail. https://www.theglobeandmail.com/opinion/article-cppib-pension-john-graham-andrew-coyne-cpp/
[18]Institutional Limited Partners Association. (2026, January 27). Continuation fund disclosure template. https://ilpa.org/resources-tools/resource-library/continuation-fund-disclosure-template/
[19]Mayer Brown. (2026, July). Building a defensible process: GP-led continuation fund transactions in 2026. https://www.mayerbrown.com/en/insights/publications/2026/07/building-a-defensible-process-gp-led-continuation-fund-transactions-in-2026
[20]ION Analytics / Mergermarket (2025, December 3), op. cit.; White & Case. (2025, December 3). Unlocking liquidity: How secondaries and continuation vehicles are freeing up the PE exit pipeline (citing Jefferies figures). https://mergers.whitecase.com/highlights/unlocking-liquidity-how-secondaries-and-continuation-vehicles-are-freeing-up-the-pe-exit-pipeline
[21]ION Analytics / Mergermarket (2025, December 3), op. cit. https://ionanalytics.com/insights/mergermarket/liquidity-needs-internal-bandwidth-make-lps-wary-of-rolling-into-continuation-vehicles/
[22]Phalippou, L. (2025). Limited partners vs unlimited technology. Substack. https://ludovicphalippou.substack.com/p/limited-partners-vs-unlimited-technology
Photo Credit | iStockphoto: simon izquierdo