


By Yannick Laurent, Research Analyst, YLF
The trade war has dominated discourse in the financial industry, and general media, over the last few weeks. The markets have been in turmoil, with major indices falling dramatically from their recent highs. This is unsurprising, given the intense disruption and uncertainty associated with upending a trade regime that has underpinned the global economy for the last half century. While the market’s reaction certainly implies that investors expect tariffs to damage corporate profits, I have yet to find a quantified estimate of this impact. In this article, I use the Profits Identity Framework to derive a general estimate for the impact that Trump’s tariffs will have on aggregate after-tax corporate profits in the United States.
The Profits Identity
I use the Profits Identity Framework developed by Levy, Farnham, and Rajan[1] as the foundation for my analysis. This method is well suited to this project, as it is relatively straightforward, relies on inputs that directly relate to the trade war, and is based on a ground-up perspective of profits. The version of the profits identity that I use is:
After-tax profits = Net investment – personal saving – current account deficit + fiscal deficit
This equation measures the total profits earned by the entire corporate sector in a given year. While the trade war will undoubtedly create many winners and losers, they will not be fully captured in my analysis, as their individual impacts on profits cancel out when viewed in aggregate.
Current Account Deficit
To start, we’ll examine the current account deficit, the item that will be most directly impacted by Trump’s tariffs. The current account balance is comprised of four terms as described in the equation:
Current Account Balance = (X – M) + NY + NCT, where:
X = exports of goods and services, M = imports of goods and services, NY = Net income abroad, NCT = Net current transfers
According to a recent study by the Tax Foundation, all tariffs levied through April 10th (including the 90-day pause on most reciprocal tariffs) are expected to decrease American imports by 24%, or roughly $800 billion, in 2025[2]. Meanwhile, the Wharton Budget Model sees 2025 imports falling by only $319 billion[3]. The impact on American exports is less certain, as it is highly sensitive to retaliatory tariffs. Analysis by The Budget Lab at Yale suggests that exports will fall by 16%[4], or $530 billion, when factoring in the impacts of lower GDP growth and foreign retaliation as of April 9th, 2025. More conservative estimates peg this number at just -0.5% of GDP, or $149 billion. When taken together, these estimates indicate that tariffs could either reduce the trade deficit by $651 billion or increase it by $211 billion. This wide range of estimates highlights the uncertainty regarding the final levels at which tariffs will settle.
Net capital flows represent the net inflows/outflows to/from the U.S. from wages, portfolio investments, and foreign direct investment (FDI). Of these items, portfolio investments and FDI will be most affected by tariffs. While it is almost impossible to accurately forecast the impact that the tariffs will have on capital flows, we can still get a sense of their directional changes.
After the April tariff announcements, the dollar saw its worst loss in value since October 2024. This pullback was largely attributable to fears of lower economic growth and foreign investors pulling capital out of U.S. assets[5]. In the long run, Americans buying fewer goods from abroad should further decrease foreign demand for dollars. According to the Wall Street Journal, a persistent devaluation of the dollar could reduce foreign capital flows into U.S. securities[6]. This suggests a negative long-term impact on profits of unknown magnitude.
Regarding net current transfers, the Trump administration has cut foreign aid by $27 billion[7] since taking office. However, I am excluding this figure from my final calculations, as it is driven by non-tariff policies.
Net Investment
Net investment refers to aggregate investment in depreciable assets and inventory, less their associated depreciation, amortization, impairments, and write-downs. For the purposes of this piece, I am putting investments by both domestic and foreign firms under the same umbrella, as the distinction between a company’s country of origin is largely irrelevant to this analysis. This is especially the case when seen in the context of globalized supply chains in which domestic firms manufacture goods abroad before exporting them to their home countries.
Reshoring manufacturing is one of the principal goals that the Trump administration hopes to achieve with its tariff policy[8]. The logic behind this approach is quite simple: by increasing trade barriers, firms that export to the U.S. will be incentivized to move production to America to avoid tariffs. However, there are several factors that make this proposition uncertain.
Positive factors:
As discussed above, tariffs incentivize firms to move production to the U.S.
American manufacturing has become increasingly automated over the last forty years[9]. While this is a negative when it comes to creating new manufacturing jobs, it does mean that new factories will require a large amount of fixed asset investments.
Negative factors:
Investments in property, plant, and equipment are long-term in nature. The Trump administration’s erratic behavior towards tariffs makes it difficult for companies to feel comfortable committing to these expensive projects.
Tariffs are expected to lower American GDP growth by 1.0%[10] – 1.4%[11] in 2025, with the economy being persistently smaller by 0.6% in the long run[12]. Lower economic output would thus disincentivize firms from making new investments.
The Tax Foundation estimates that Trump’s tariffs will decrease the United States’ capital stock by 0.7% in the long run, largely driven by lower economic growth[13]. According to the most recent data published by the St. Louis Fed, the United States’ capital stock stood at just over $69 trillion in 2019[14]. A linear interpolation of its five-year historical growth rate of 1.5% yields a rough estimate of $75.5 trillion in 2025. Adjusting these figures from 2017 dollars (in which the Fed data is reported) to 2025 dollars results in a capital stock of $90 trillion and $98 trillion for 2019 and 2025, respectively. A 0.7% decline in the capital stock would thus equate to somewhere between $629 billion and $688 billion dollars. Meanwhile, the Wharton Budget Model estimates that capital stock could decrease by as much as 2.7% by 2030[15]. Using the same methodology as before, this figure equates to a $1.7 trillion to $2.4 trillion reduction.
Amortizing the Tax Foundation estimates’ long-term figure over ten years, and the Wharton estimates over five years, results in an annual capital stock reduction of $69 billion to $408 billion. These amounts translate directly into lost profits for the American corporate sector.
Personal Savings
Average American household income is expected to decrease by $1,300[16] - $4,700[17] due to the 2025 tariffs. It can be tempting to conclude that this decrease in consumer wealth will negatively impact corporate sector profits. However, since tariffs can be viewed as a redistribution of wealth from consumers to the government, the impact on overall profits could be negligible, depending on how the government elects to spend this money.
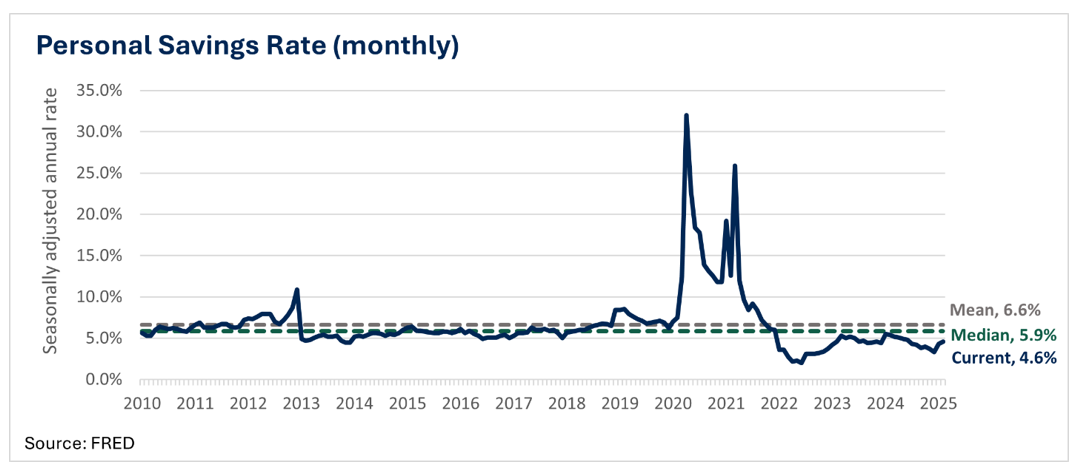
The figure that actually matters for the Profits Identity is total savings by the household sector. Early evidence indicates that consumers could respond to the ongoing economic uncertainty by increasing their savings[18]. Examining historical data since the financial crisis reveals that the personal savings rate is below its historic mean and median values of 6.6% and 5.9%, respectively. The average savings rate during Trump’s first trade war in 2018 and 2019 was 6.9%.
The most recent measure of American personal disposable income totaled $17.8 trillion, measured in 2017 dollars, or $23.1 trillion in 2025 dollars. The Tax Foundation estimates that the tariffs will reduce after-tax incomes by an average of 1.3%[19], lowering them to $22.8 trillion. This figure can be used as a baseline for estimating the changes in personal savings that would result in different scenarios.
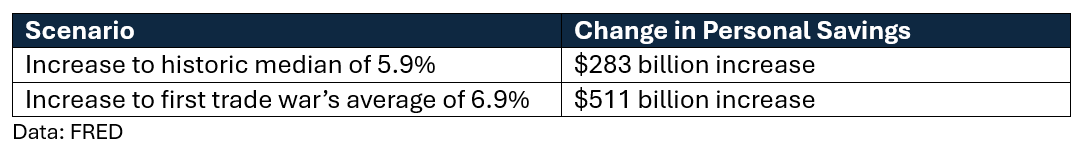
However, it is very difficult to know exactly how consumers will respond to the tariffs. All that can be said is that they will be less well-off and that the savings rate has more room to rise than fall, when compared to its historic levels.
Government Deficit
Trump’s 2025 tariffs are expected to generate between $2.2 trillion[20] and $4.2 trillion[21] in tax revenue over the next decade, depending on the model used to estimate them. Amortizing these two figures over ten years produces an estimate of $220 billion to $420 billion. How the administration elects to spend this money will entail dramatic consequences for the future of American corporate profits.
Currently, the federal deficit stands at approximately $1.3 trillion[22], or just over 6% of GDP[23]. Any money that the Trump administration uses to reduce this deficit would also reduce overall corporate profits. On the other hand, the damaging effects of retaliatory tariffs could push the government to bail out impacted industries as it did during the 2018 trade war[24]. Other options include using the revenue to support consumers or balance tax cuts elsewhere. At this time, it’s unclear how this new tax revenue will be spent. What is known is that the impact on corporate profits will be negligible at best and minus $420 billion at worst.
Final Impact on After-Tax Corporate Profits
So, what is the net effect on after-tax corporate profits? Returning to the Profits Identity equation, we can now obtain some rough numbers.
After-tax profits = Net investment – personal saving – current account deficit + fiscal deficit
Impact on profits = (-$69 billion to -$408 billion) – ($0 to +$511 billion) – (-$651 billion to +$211 billion) + ($0 to -$420 billion)
The resulting outcomes are surprising. In the most bullish scenario, personal savings remains unchanged, the trade deficit contracts dramatically, and the Trump administration uses none of its new tax revenue to reduce the fiscal deficit, producing a $582 billion increase in overall corporate profits. Under the most bearish scenario, consumers increase their savings rate to match that of the first trade war, retaliatory tariffs increase the trade deficit, and the government uses all its tariff revenue to lower the fiscal deficit. In this case, corporate profits fall by a staggering $1.5 trillion annually. To put these numbers into perspective, the most recent measure of aggregate corporate profits was $3.3 trillion[25], meaning that the tariffs could impact them by +18% to -47%.
Given this wide range of outcomes, averaging the ranges for each variable might be more appropriate. Doing so gives the following:
Net investments down $239 billion
Personal savings up $256 billion
Current account deficit down $220 billion
Government deficit down $210 billion
Running these figures through the Profits Identity points to a $484 billion reduction in corporate profits (-15% from 2024 profits). This figure is reasonable as the directional changes of each term are those that should be expected from higher trade barriers. Furthermore, the most extreme outcomes are avoided.
Conclusion
Using the Profits Identity to analyze the impact of Trump’s 2025 tariffs on aggregate after-tax corporate profits in the United States yields surprising results. However, these numbers are rough inferences that are very sensitive to a few key variables: final tariff/counter-tariff rates, consumer savings behavior, and the way in which the administration decides to spend its new tax revenue. The future trajectory of these variables is highly unpredictable, making accurate forecasting difficult. This uncertainty, combined with a wide range of possible outcomes for profits, is consistent with the stock market’s erratic behavior, which produced record breaking intraday swings. At the very least, the Profits Identity can give investors a general sense of the fallout they can expect to see from Trump’s tariffs, as well as a shortlist of indicators to keep an eye on while the situation unfolds.
About the Contributor
Yannick Laurent conducts original investment research, economic analysis, and discussions of topics in asset management, which he publishes on his website, YannickLaurentFinance.com. He has a background in wealth management and has mentored students who are interested in pursuing a career in financial services. Yannick is a member of the CFA Society of San Francisco and received his bachelor’s degree in economics from Macalester College.
Learn more about CAIA Association and how to become part of a professional network that is shaping the future of investing, by visiting https://caia.org/