


By Andrew Keenan, CAIA, CFA, CBP, Assistant Vice President at Credit Suisse.
One of the perceived corollaries of the COVID-19 pandemic has been a surge in interest for traditional trading cards, a rather niche corner within the Alternative Investments space. While the conjectures for this said resurgence range from the attic-raiding instigated by the lockdowns to the general market euphoria and investment milieu that accompanied the craze of all things tangential to NFTs, cryptocurrencies, meme stocks, and NBA Top Shot, it is hard to deny that trading cards are once again in vogue as the demand has seen such a meteoric rise, retailers have even gone as far as putting pack limits on a per consumer basis and, in some cases, even stopped selling them for windows of time.
While trading cards may actually have some potential as an inflation hedge or even serve as a source of uncorrelated beta from an investment standpoint, we instead turn our gaze and narrow our focus towards an interesting peculiarity from a valuation perspective that we dub the “Perfection Premium”, which is a notable change in price that virtually all cards—with a reasonable graded population—experience as they traverse from a PSA Mint 9 card grade to a PSA Gem Mint 10 card grade (more on trading card grades below).
The size of the premium is a well-established empirical fact, is a function of a card’s graded population, follows the basic laws of supply and demand, and is consistent across myriad card populations, often eschewing the relative, more modest price differences between lower card grade ranks. What makes the premium so intriguing, however, is that the relative price change is almost always exponential rather than linear in nature.
The aim of this research note, therefore, is to help generate some insights regarding this valuation premium for investment professionals with anything ranging from a nascent to an established interest in this subset of the collectibles space. Readers of this piece should be able to answer the following questions:
- At June 30th, 2021, there were 109 constituents within the PWCC 500 index that represented a card’s PSA Gem Mint 10 version. What was the average size of the “Perfection Premium”, or percentage difference between each of these constituents’ PSA Gem Mint 10 version and its PSA Mint 9 version?
- With respect to the 109 trading cards identified for this analysis, how is this Perfection Premium shifting over time? Is it shrinking, growing, staying the same, or cyclical?
- Has a PSA 10-only portfolio of these cards outperformed the corresponding PSA 9-only portfolio and, if so, by how much in percentage terms?
Before we dive into these questions, we need to first understand the basic mechanics of trading card grading, the lynchpin of our analysis.
TRADING CARD GRADING –OBJECTIVE, SUBJECTIVE, OR BOTH?
The quick answer: both.
Trading Card Grading as a concept is simple and straightforward: you get a card “graded” and the said grade represents a card’s condition/quality while simultaneously serving as an authentication mechanism.
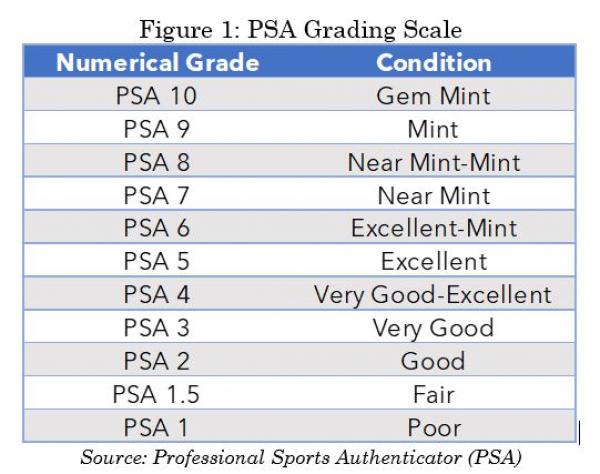
The grading process, however, happens to be nuanced and is an interesting confluence of objective rigor and subjectivity. In the case of the former, the main players in the authentication space, such as PSA, Beckett, and SGC, utilize standardized 1-10 grading scales—with 1 being the worst grade and 10 being the best grade—to help facilitate “apples to apples” comparisons across different card offerings as well as aid in price discovery for the trading card marketplace.
Each grade corresponds to a card’s respective condition as explicated in Figure 1 below. While our analysis primarily focuses on PSA Gem Mint 10 vs PSA Mint 9 cards, it helps to see PSA’s scale for context purposes. Notably, the further one goes down the grading scale, the greater the variation in card appearance.
The criteria by which trading card grades are calculated is well-established and can be objectively measured, especially with present-day, cutting-edge measurement technology. These criteria tend to focus on elements of the card such as the following:
- Centering: Focuses on a trading card’s border width and whether the card design—both front and back—is printed or was cut proportionally within that border.
- Edges: Focuses on the horizontal and vertical peripheries of the card. The less whitening, creasing, or chipping on the perimeter of the card, the better.
- Surface: Emphasizes the overall condition of the cardboard. Scuff marks, whitening, and bending of a card’s exterior—front or back—hurt the overall grade of the card as do scratches on cards with glossy surfaces.
- Corners: Four sharp corners are a hallmark of a highly graded card. How a card was cut can have a material impact on this criterion. Rounded corners or corners with chipping, creases, and whiteness move a card down the grading scale.
In the case of the latter, the objective rigor utilized by authenticators has its limits and there are select situations in which unique elements of a card may come into play with respect to its final grade.
PSA (Professional Sports Authenticator) uses one example of how this might happen: a 1955 Topps Sandy Koufax—a PSA Gem Mint 10 version is displayed in Figure 2 below for context—that is on the border of being acceptable with respect to centering guidelines for a certain grade. Since the card has a yellow background with a white border, the off-center presentation is less noticeable because of this lack of contrast, and thus, the adverse effect on the optics caused by this off-center positioning is mitigated. If the card’s other traits are favorable, it may be the basis for a grader to make a discretionary call on the card’s final grade.
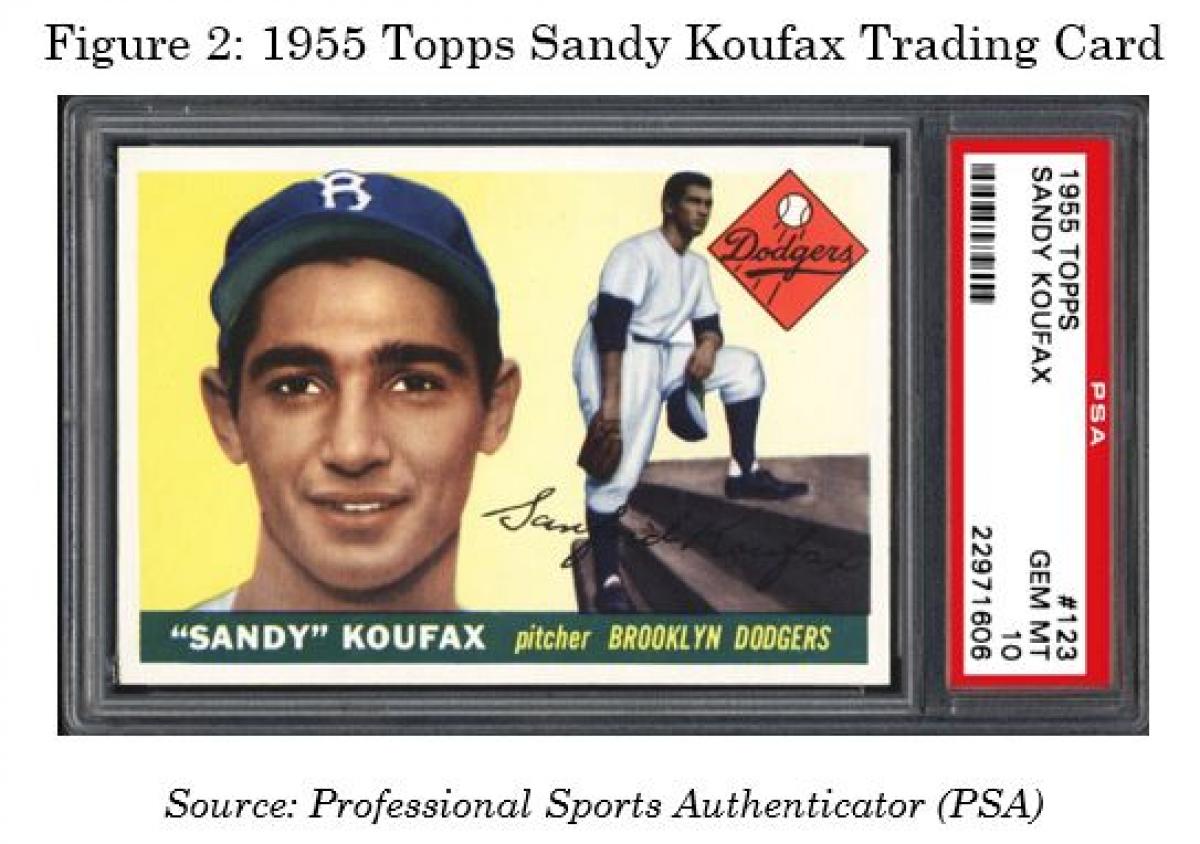
In other words, seemingly auxiliary features can help alleviate the fact that the card may be slightly off-center, leading a grader to step in and make a final determination with recourse to what is known as "eye appeal" rather than the rigid pre-established parameters. [i], [ii]
PUTTING SOME MORE CONTEXT AROUND GRADING DIFFERENCES
PSA describes a PSA Gem Mint 10 card as one that exhibits outstanding corners, superb eye appeal, and is well-centered. It does not have to be “perfect” in the sense that it has no flaws but needs to be “virtually perfect”. What tends to separate a PSA Mint 9 card from a PSA Gem Mint 10 card is eye appeal issues such as centering, color, or registration. [iii]
To move from the abstract to the concrete of what this grading difference entails, Figure 3 helps further contextualize and underscore just how subtle it can be.
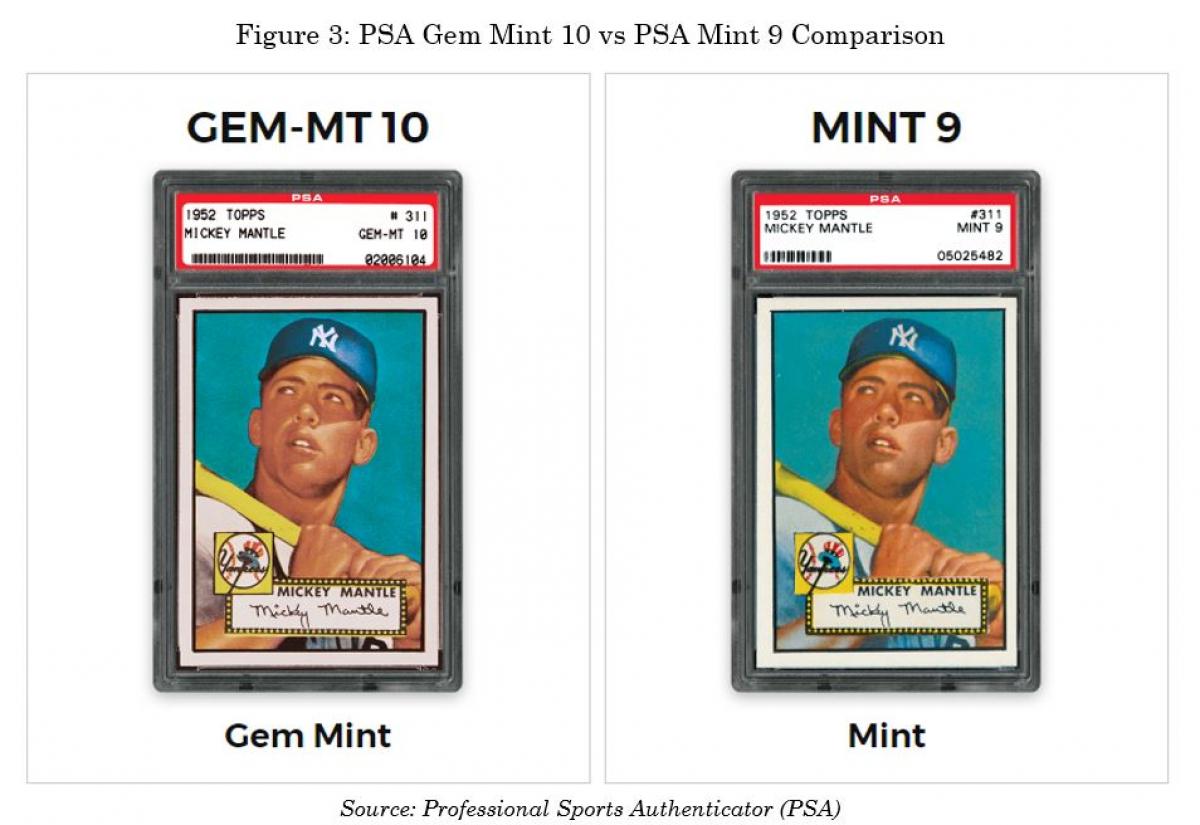
Can you tell the difference? And would you be willing to pay a substantial premium for that difference?
METHODOLOGY DETAILS
At the risk of using a tautology to come up with an apropos description for the trading card market: it is extremely heterogeneous. Not only do you have various offerings across different sports and trading card games (e.g., Baseball, Basketball, Football, Non-Sport, etc.), but you have sundry trading card sets (e.g., Chronicles Draft Picks, National Treasures, Ultra Scoring Kings, etc.) across myriad manufacturers (e.g., Fleer, Upper Deck, Panini, etc.).
While there is currently no true universal gauge of the trading card market at this time given all its variety, PWCC—in this author’s opinion—has moved the needle towards that end by developing market indices that help capture relevant groupings of graded cards, enabling investors to capture something akin to a “pulse” of the trading card market.
Overview:
- Population: All PSA Gem Mint 10 index components within the PWCC 500 index are compared to their PSA Mint 9 counterparts from a valuation and ROI perspective. This amounts to 109 different cards at June 30, 2021. While the remaining index constituents may have PSA Gem Mint 10 versions in circulation, they do not meet PWCC’s index inclusion criteria. 1888-1999 assets are considered only. [iv]
- Analysis Window: June 30, 2011 to June 30, 2021. Closest transaction preceding these dates were used if no transaction took place. Transactions were averaged if multiple transactions took place on a respective day. Monthly returns are used in this analysis.
- For simplicity, transaction costs are not included, and only PSA-graded cards are included in this analysis per PWCC’s index inclusion criteria.
- Transaction data consist of public auction sales only and are sourced from PSA and Vintage Card Prices; trading card population data was sourced from PSA [v], [vi], [vii]
- All errors are mine alone.
FINDINGS
At June 30th, 2021, there were 109 constituents within the PWCC 500 index that represented a card’s PSA Gem Mint 10 version. What was the average size of the “Perfection Premium”, or percentage difference between each of these constituents’ PSA Gem Mint 10 version and its PSA Mint 9 version?
To calculate the average size of this premium, we utilized public transaction data either as of June 30th, 2021, or from the closest preceding transaction date available. If multiple trades took place on a given date, the said transactions were averaged together—private sales were not included in the analysis.
For our selected trading card population, the average premium paid for a card’s PSA Gem Mint 10 version over its PSA Mint 9 version was approximately a salient 1,487%. Put similarly, buyers have recently been willing to pay approximately 15x to 16x more, on average, for the same trading card if it was in Gem Mint condition—this is anything but a trivial amount.
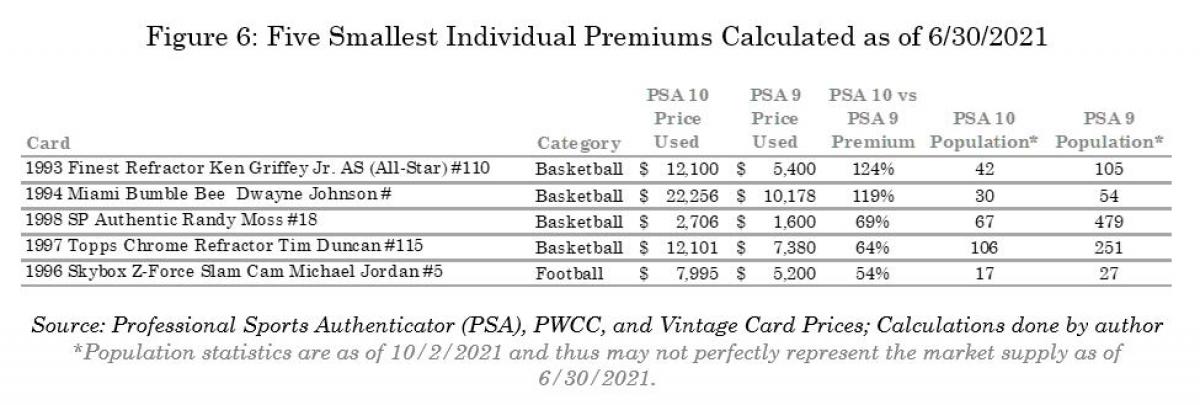
Figures 4, 5, and 6 below provide some interesting summary statistics, displaying a breakdown of the Perfection Premium by category, the five largest individual premiums calculated, and the five smallest individual premiums calculated.
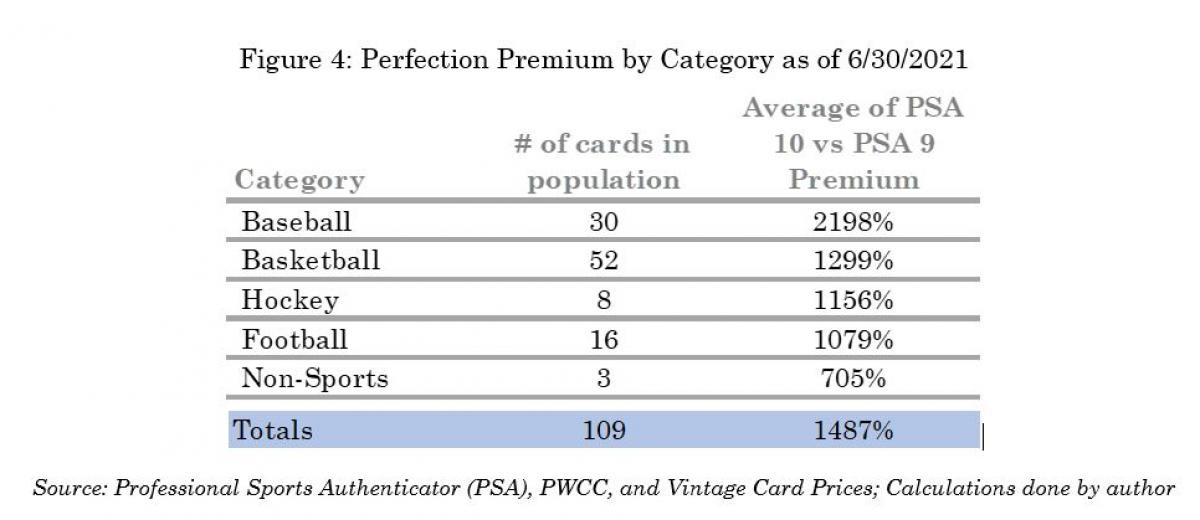
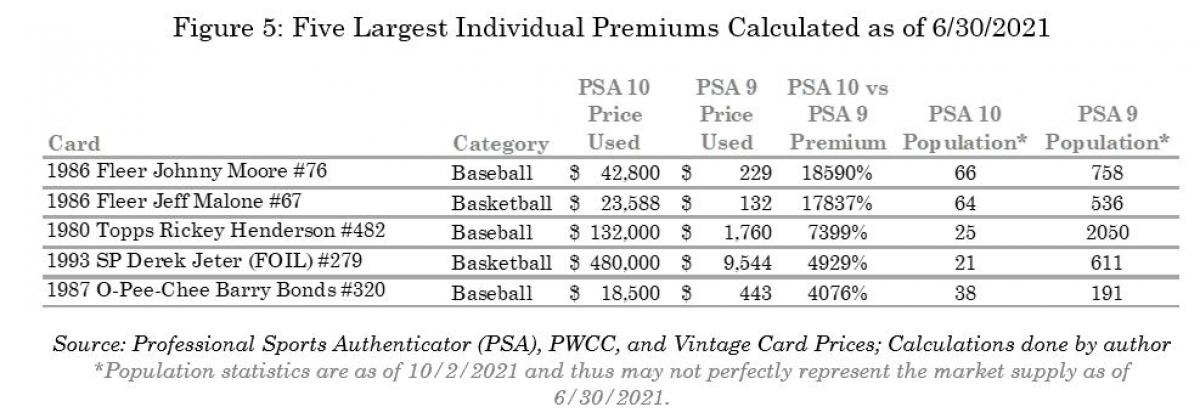
Not surprisingly, Baseball and Basketball cards, which both have not only mainstream popularity and appeal but also have evergreen trading card markets, commanded the highest Perfection Premiums.
On an individual card basis, the ratio of authenticated, qualifier-excluded PSA Gem Mint 10 cards to PSA Mint 9 cards in circulation certainly played a role in the size of this valuation premium as well as card characteristics such as the year and manufacturer.
With respect to the 109 trading cards identified for this analysis, how is this Perfection Premium shifting over time? Is it shrinking, growing, staying the same, or cyclical?
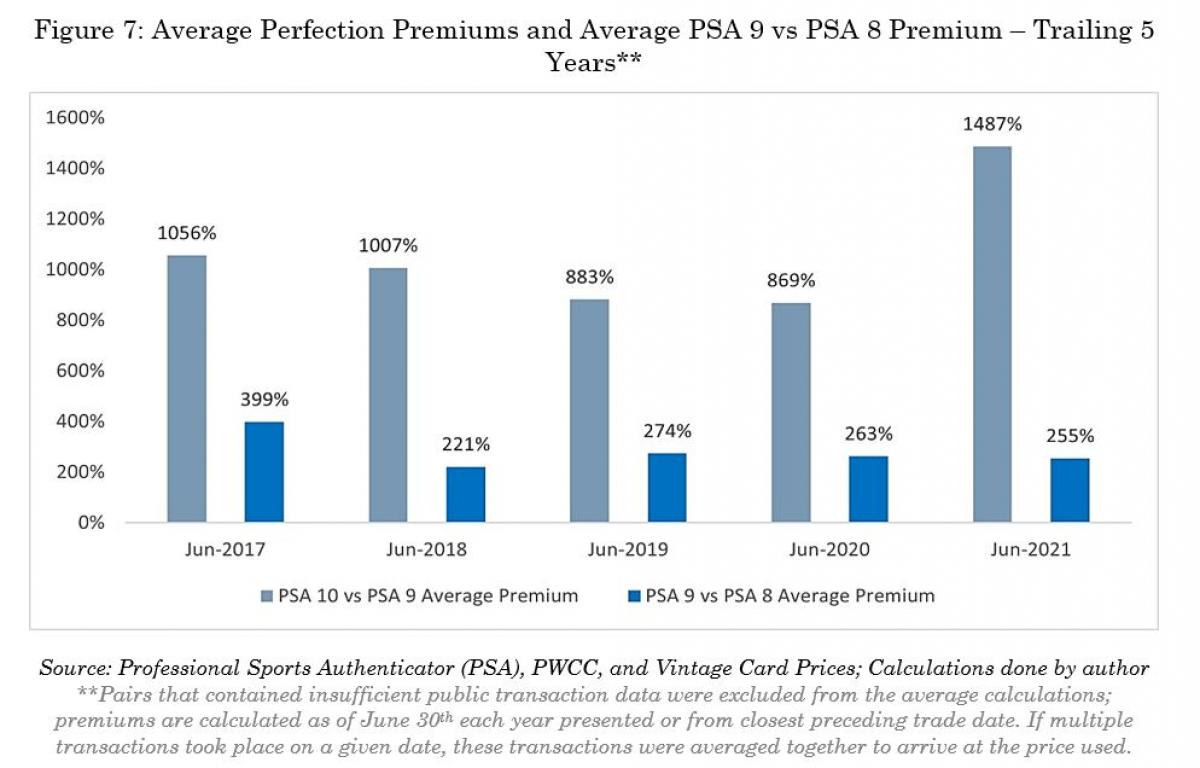
Interestingly, per Figure 7, the size of the Perfection Premium was on a downward trajectory, shrinking from 2017 to 2020 but surging in 2021 to its trailing 5 year high. This would seem to imply that, in conjunction with the recent market surge, investors were signaling a preference for trading card assets if they carried a PSA Gem Mint 10 grade as opposed to a PSA Mint 9 grade.
For additional context, the PSA 9 vs PSA 8 premiums are also provided in Figure 7 below. The size of the PSA 9 vs PSA 8 premium has been vacillating since 2017 with no discernable trend emerging.
Has the PSA 10-only portfolio of these cards outperformed the corresponding PSA 9-only portfolio and, if so, by how much in percentage terms?
While it is clear from the data that investors are willing to pay a substantial premium for a trading card’s PSA Gem Mint 10 version, it does not necessarily follow that those investments in PSA Gem Mint 10 cards are the optimal choice from an investment perspective, especially given the amount of capital involved in acquisition (see the relative market price differences in Figures 5, 6, and appendix tables for context).
It’s not easy comparing a portfolio of trading cards given how infrequently these assets trade so caveat emptor. The cumulative performance of $1 invested in each portfolio is displayed in Figure 8.
Since we are buying and selling trading cards at various times in the respective portfolios—given the limited frequency at which some of our constituents trade—and have no control over the amount and timing of the cash flows, we compare both portfolios using a time-weighted rate of return.
We do not arrive at a true “like to like” comparison but, thanks to PWCC’s population filtering criteria regarding trading frequency, the timing at which assets entered each portfolio was not drastically different in aggregate, so it gets us somewhat close from a compatibility perspective.
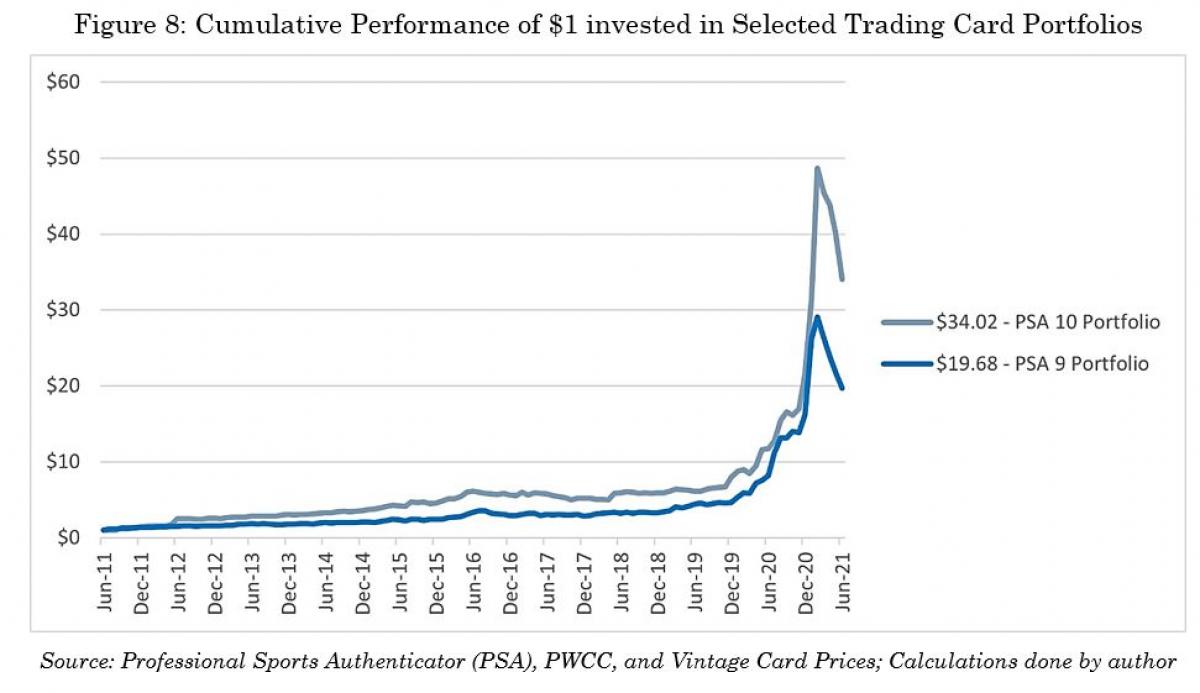
It turns out that, at least from the vantage point of this analysis, investing in higher graded cards provided a better ROI over a 10-year period. The PSA 10 Portfolio had a 10-year, annualized time-weighted rate of return of ~42% compared to the ~35% annualized time-weighted rate of return generated by the PSA 9 Portfolio. See Figure 8 for details.
Both portfolios moved virtually in tandem (the correlation of monthly returns was over 0.9), with the outperformance primarily taking place in the 2020–2021 interval. Preceding this window, the outperformance of the PSA 10 portfolio was more tepid.
The proverbial “other side of the coin”, as previously alluded to, is that the amount of capital it takes to invest in some of these trading card offerings is extraordinarily prohibitive—it's far more expensive to invest in the PSA 10 Portfolio as opposed to the PSA 9 portfolio. Yet, avenues such as Rally allowing for fractionalized ownership of rare, expensive collectibles may continue to help alleviate this obstacle in the future.
CONCLUSION
In this research note, we help contextualize just how large the PSA Gem Mint 10 vs PSA Mint 9 Perfection Premium is using a curated population of highly sought-after, significant, and relatively liquid trading cards.
Our key take-a-ways were as follows:
- Trading Card Grading is a critical aspect of the collectibles market and is an interesting confluence of objective rigor and subjectivity.
- Investors have been willing to pay a substantive premium for a card’s PSA Gem Mint 10 version relative to its PSA Mint 9 version, with our calculated premiums, on average, ranging from ~869% to ~1487% over the past five years (note: premiums can vary substantially by individual card).
- For the cards analyzed, the Perfection Premium surged quite notably following the pandemic—this was likely due to an amalgamation of sundry market factors coupled with better market infrastructure.
- Our custom PSA 10 trading card portfolio outperformed the corresponding PSA 9 portfolio on a time-weighted rate of return basis over the past 10 years. However, investor’s must be cognizant of the substantial capital outlay it takes to invest in a card’s PSA Gem Mint 10 version relative to other grades.
Lastly, while the Trading Card space may be niche, it is poised to increase its share in the rapidly growing collectibles market. As investors work towards building their respective Portfolio for the Future, it’s imperative to approach these niche segments with an open, inquisitive mind as they may impart benefits to a given portfolio and help improve investor’s long-term outcomes.
REFERENCES
[i] PSA Grading Card Standards: https://www.psacard.com/resources/gradingstandards#cards
[ii] Sandy Koufax details: https://www.psacard.com/cardfacts/baseball-cards/1955-topps/sandy-koufax-123/24717
[iii] PSA’s guide to trading card grading: https://blog.psacard.com/2020/05/08/beginners-guide-to-trading-card-grading/
[iv] PWCC Market Index Data: https://www.pwccmarketplace.com/market-indices
[v] Vintage Card Prices: https://vintagecardprices.com/
[vi] PSA Auction Price Database: https://www.psacard.com/auctionprices
[vii] PSA Population Database: https://www.psacard.com/pop
About the Author:
Andrew Keenan, CAIA, CFA, CBP is an Assistant Vice President at Credit Suisse, where he works on the Product Control Analytics team in a reporting and analysis capacity. His work focuses mainly on developing innovate, practical reporting solutions for the Bank’s valuation pipeline. Prior to his current role, he worked on the Bank’s Prime Services team within Product Control.

Andrew is a CAIA charterholder, a CFA charterholder, and a Certified Bitcoin Professional. He earned a B.S. in Business Administration with a Finance Concentration and a Master of Business Administration from North Carolina State University.
APPENDIX –CARDS UTILIZED IN THIS ANALYSIS***


Source: Professional Sports Authenticator (PSA), PWCC, and Vintage Card Prices; Calculations done by author
***Prices as of 6/30/2021 or closest preceding trade date; if multiple transactions took place on a given date, these transactions were averaged together to arrive at the price used.