


Eurekahedge, a provider of hedge fund industry news since 2001, has released its report about the state of the industry in August 2016. Among the key points:
- August was the fourth consecutive month of outflows. Although preliminary, the data for the month suggests a net asset outflow of $7.5 billion. That figure ($1.4 billion) is also the size of performance based gains, so the AUM has been flat.
- Japan mandated funds have been “flat” in an even simpler sense of that simple-seeming word. The net performance based growth of these funds in August was … zero. The net flows, in or out, of these funds in August was … also zero. So the AUM at the beginning of the month was identical to the AUM at its end, $17 billion.
- Year to date, Japanese managers can take credit for performance-based gains of $0.1 billion. For Asia ex-Japan managers, the corresponding number is $0.6 billion.
- The North American hedge fund industry is in the black in both respects, investor flows and performance, for August, with performance based growth of $0.8 billion and net inflow of $0.1 billion. Over the last three month period, the performance based gains of this continent’s hedge fund industry total $19.3, although there have been net redemptions during that period.
- In Europe’s hedge fund industry net flows were negative in August and performance based gain, though positive, was slight. Total assets in Europe’s hedge funds is now: $531.1 billion.
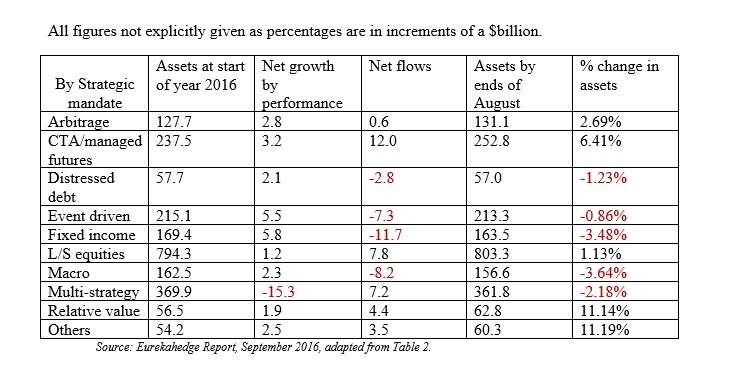
- Breaking results down by strategy, CTA/managed futures had the worst performance based results in August, down $6.5 billion. The net flow is positive, but only $0.7 billion. The CTA/managed futures part of the hedge fund industry now has a total of $252 billion assets under management, and has seen an inflow of net $12 billion YTD.
- Still breaking results down by strategy, the year-to-date worst performance results belong to (drum roll please) the multi-strat managers, who have reported $15.3 billion in losses. All other strategic mandates, measured in YTD performance terms, are in the black ink.
In tabular form, the performance based changes in assets and asset flows in 2016 are as below.
August in the Underlying Markets, and Volatility
But what was August 2016 like in the underlying markets where hedge funds must live and breathe and have their being?
As represented by the MSCI AS World Index (Local), these markets grew 0.48%. It was as the authors of the report say a “relatively quiet month” where central banker announcements “dominated the trading scene.”
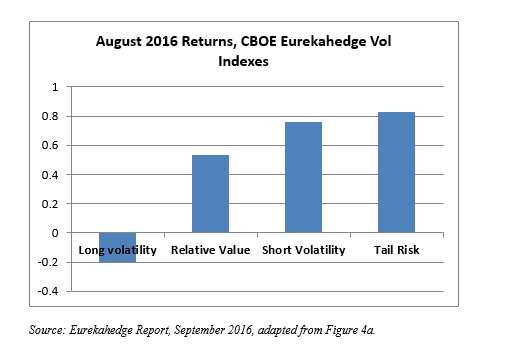
Looking at the CBOE Eurekahedge Volatility Indexes, the Long Vol index was down for the month. Relative value, short, and tail risk were all in the positive numbers, with the tail risk index, which as its name (somewhat) suggests, tracks performance of those hedge fund managers who specifically seek to capture capital appreciation during times of extreme market stress, leading the table with a gain of 0.83% in August.
Incidentally, the report reminds us, the Brexit shock of June “did not work as well as expected for long volatility and tail risk strategies” because markets digested that news more smoothly than expected.
In graphic form, those results are below.
Latin America
The report observes that Latin American long/short equities have done well YTD 2016, as the underlying markets have responded favorably to the impeachment of Dilma Rousseff, the center-left president of Brazil ousted from power in a process that began late last year and that culminated on August 31, 2016. Also, the weakness of the U.S. dollar has helped support the Latin American commodities sector in recent months.