


By Rodney Sullivan, CFA, CAIA, Executive Director, University of Virginia Darden School of Business US recessions are typically accompanied by declines in stock market returns and, of course, 2020 has been no exception. We are once again reminded that investing is not easy leaving many investors to wonder how best to achieve what they really want — to avoid portfolio risk while seeking portfolio return. The potential benefits of diversification, first codified by Harry Markowitz who remarked “diversification is the only free lunch in investing,” has been called into question in recent years with comments like “diversification fails when needed most,” suggesting diversification lacks effectiveness especially during turbulent markets. With this year’s ongoing market volatility, it seems worthwhile to review the evidence. We’ll see that a globally diversified portfolio can be both effective and efficient. A couple of recent posts here and here explored hedge fund performance in prior economic crises with an emphasis on the potential diversification benefits and downside protection. So in this piece, I’ll focus attention on long-only portfolios. To put this year’s markets into perspective, it’s useful to begin with a look back at a long-term, 75 -ear, history of market drawdowns and subsequent recoveries.[1] Although steep losses have been an integral part of the story, the analysis here shows markets over the past 75 years have shown remarkable resiliency and a globally diversified portfolio even more so. Let’s take a closer look. From Exhibit 1, we can see the chronology of cumulative total drawdowns (and subsequent recoveries) of total returns for large cap stocks around periods of recession in the US. Economic cycle data come from NBER, and recessions (contractions) run from the start at the peak of a business cycle and end at the trough. Since January 1926, sixteen recessions (including the current ongoing one) have occurred, with thirteen of those occurring since the end of WWII in September 1945. Post WWII, we see that during the global financial crisis (GFC) of 2008-2009 investors experienced the largest drawdown in stocks. We can also see the 2020 YTD cumulative drawdown in stocks of nearly -20 percent. Exhibit 1 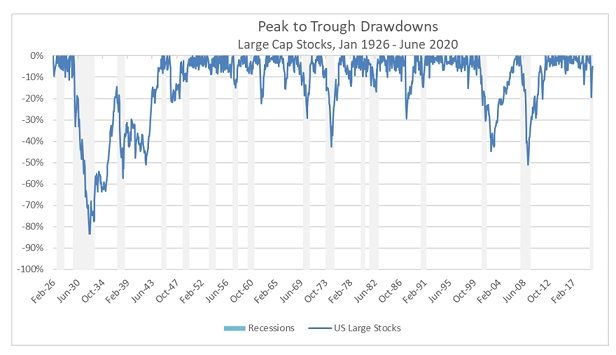 Source: Morningstar, author analysis. The results are hypothetical and are not an indicator of future results and do not represent returns that any investor might actually achieve. Investing always involves risk, whenever you invest you are at risk of loss of principal as the market fluctuates. Past performance is not indicative of future results. To help visualize the numbers, the maximum drawdowns that occurred during each recession period are detailed in Exhibit 2a and Exhibit 2b. For reference, I show a line representing the average max drawdown (excluding 2020) over the full period which turns out to be -26 percent (the average decline is -20 percent since WWII ended). I then similarly report on the stock market performance in the 12 months following the economic trough which marks the official end of the recession.[2] I do not show a recovery for 2020 yet, as the recession, of course, is still underway. The average rally in the 12 months post-recession is 22 percent. The symmetry in Exhibit 2A is striking in that the average market return post-recession of 22 percent (16.5 percent post WWII) roughly corresponds to the market decline observed during recessions. It’s important to point out here that I am not suggesting that the recession end can be used as a market timing tool. As you can see from the earlier graph, recession lengths vary greatly, and it is well known that the official end of a recession is not known until the recovery is already well underway, and by that time markets have almost always already taken an economic recovery into account. The analysis here is simply to put the past 75 years into perspective, and perhaps help us to better gauge what might lie ahead for markets. Exhibit 2a
 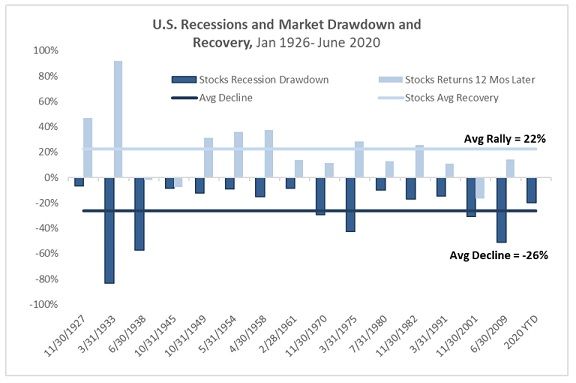 Source: Morningstar, author analysis. The results are hypothetical and are not an indicator of future results and do not represent returns that any investor might actually achieve. Investing always involves risk, whenever you invest you are at risk of loss of principal as the market fluctuates. Past performance is not indicative of future results. Exhibit 2b US Recessions: Large Cap Stocks Maximum Drawdown and Post 12Mos Recovery
 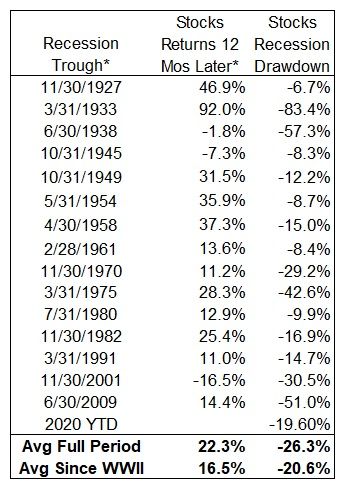 Source: Morningstar, author analysis. Recession chronology from NBER. The results are hypothetical and are not an indicator of future results and do not represent returns that any investor might actually achieve. Investing always involves risk, whenever you invest you are at risk of loss of principal as the market fluctuates. Past performance is not indicative of future results. What about Diversified Portfolios? As mentioned above, the benefits of diversification have been under fire in recent years. It’s often said that diversification fails when it’s needed most, at least when employing a long-only approach. Let’s take a look at more diversified portfolios to see the extent to which diversification has historically provided, if any, downside protection. First, I’ll review the commonly referenced 60/40 portfolio. Here, we’ll use an allocation of 60 percent US large cap stocks and 40 percent intermediate term US government bonds, rebalanced monthly. In Exhibit 3a, I show again the same 75 year period as before but now add the 60/40 portfolio. From the graph we can see that there has historically been some benefit from adding US Government bonds to all all-stock portfolio. In particular, our 60/40 portfolio experienced an average maximum peak-to-trough drawdown of -15.9 percent over the full period, and -11.7 percent since WWII, versus -26.3 percent and -20.6 percent declines for large cap stocks, respectively. During 2020, the 60/40 portfolio (thus far, at least) has seen a -10.1 percent drop versus the -19.6 percent decline for large cap stocks. Exhibit 3b adds the 60/40 portfolio results (in orange) to the earlier stocks-only graph shown in Exhibit 2a. Over the past 75 years, a 60/40 portfolio experienced roughly one-half the level of drawdown versus stocks on average. So although not eliminating drawdowns, a 60/40 portfolio has historically provided some downside protection. To me at least, this calls into question the oft repeated comment that diversification fails when it’s needed most. “Fails” seems overly strong as diversification doesn’t completely fail. Yes, while it doesn’t eliminate declines, a 60/40 portfolio has historically at least somewhat mitigated drawdowns. It’s also worth noting that the recovery for the 60/40 portfolio is also at least as rapid (or more so) as that of the stock-only portfolio. Exhibit 3a
 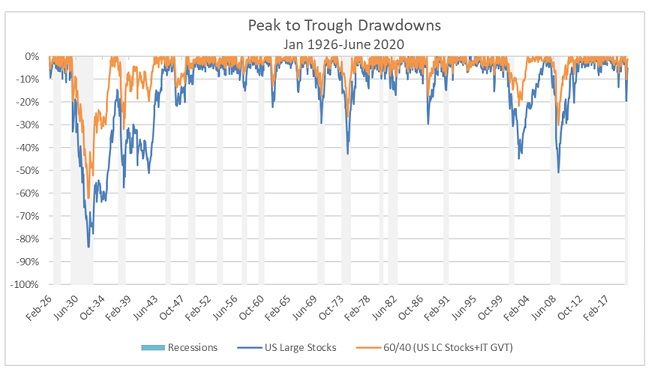 Source: Morningstar, author analysis. The results are hypothetical and are not an indicator of future results and do not represent returns that any investor might actually achieve. Investing always involves risk, whenever you invest you are at risk of loss of principal as the market fluctuates. Past performance is not indicative of future results. Exhibit 3b
 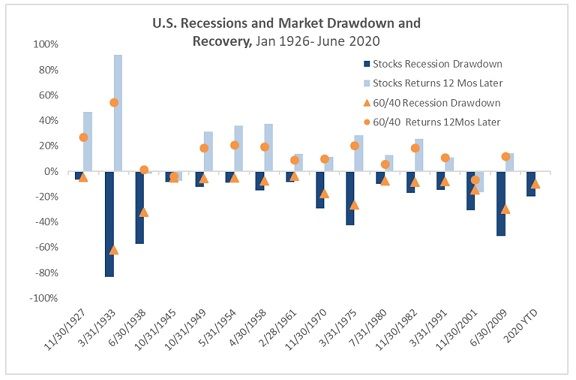 Source: Morningstar, author analysis. The results are hypothetical and are not an indicator of future results and do not represent returns that any investor might actually achieve. Investing always involves risk, whenever you invest you are at risk of loss of principal as the market fluctuates. Past performance is not indicative of future results. Enter More Diversification The results thus far show that a traditional 60/40 stock/bond portfolio has historically delivered on its promise to help dampen portfolio swings during turbulent market periods. But we all know that a portfolio consisting of only US stocks and bonds is hardly considered diversified nowadays. So, what about including additional long-only asset classes into the portfolio mix beyond US stocks and bonds? Let’s take a look and see. For this analysis, I’ll expand on our simple US-centric two-asset class portfolio to create a hypothetical portfolio consisting of a wider array of asset classes to now additionally include global stocks (including developed and emerging markets), global bonds (including developed, emerging markets, and global high yield), publicly traded US real estate, and gold.[3] We’ll call this blend of long-only asset classes the globally diversified portfolio. In creating it, we’ll maintain an overall allocation profile similar to that of a 60/40 portfolio, employing the asset weightings as shown in Exhibit 4 and rebalance monthly. That is, our globally diversified hypothetical portfolio will consist of 60 percent of the more risky assets comprising global stocks (S&P500, EAFE, MSCI EM), global bonds (EM Bonds, Global High Yield), US REITs, and Gold; again, all together totaling 60%. The less risky assets consist of all bonds (US bond aggregate and global developed market bond aggregate) totaling 40% of the overall portfolio.[4] For this wider mix of assets, we unfortunately do not have data dating back to 1926, so will necessarily begin our analysis in 1994, the common starting date for all the asset classes included. Exhibit 4 reports the average nominal arithmetic annual returns and annualized standard deviations for the nine asset classes making up the portfolio as well as the 60/40 and global diversified portfolios, and Exhibit 5 reports the cumulative total returns. For comparison purposes, our 60/40 portfolio will now allocate 60 percent to US large cap stocks and EAFE stocks (each having a 50 percent weighting) and 40 percent to intermediate term US government bonds, rebalanced monthly. Exhibit 4
 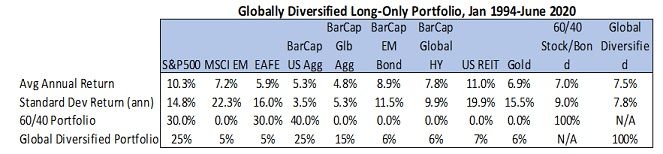 Source: Morningstar, author analysis. The results are hypothetical and are not an indicator of future results and do not represent returns that any investor might actually achieve. Investing always involves risk, whenever you invest you are at risk of loss of principal as the market fluctuates. Past performance is not indicative of future results. Exhibit 5
 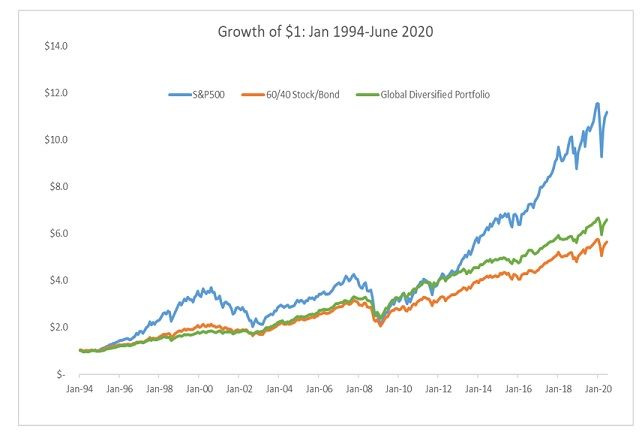 Source: Morningstar, author analysis. The results are hypothetical and are not an indicator of future results and do not represent returns that any investor might actually achieve. Investing always involves risk, whenever you invest you are at risk of loss of principal as the market fluctuates. Past performance is not indicative of future results. Next, let’s compare the cumulative portfolio drawdowns. In Exhibit 6a, I show again large cap stocks and the 60/40 portfolios, and I then add to these the drawdown results for the global diversified portfolio. It should come as no surprise that the more diversified portfolios provide some downside protection. This idea dates at least back to Harry Markowitz[5] mentioned at the outset for which he was awarded a Nobel Prize in Economics in 1990 (along with Merton Miller and Bill Sharpe in same year). Here again, the global diversified portfolio, while not eliminating declines altogether, nonetheless has historically even further mitigated drawdowns during turbulent markets versus the all-equity and 60/40 portfolios. For those interested in the numbers, I compare the results for these maximum cumulative drawdowns in Exhibit 6b. Interestingly, you can also observe from Exhibit 6a that the global diversified portfolio recovered to its pre-decline levels more quickly following the recession. In other words, it took less time for the global portfolio to return to its pre-crisis levels versus both the 60/40 and the all stock portfolios as shown by the return of the portfolio cumulative return to zero (the x-axis). Exhibit 6a
 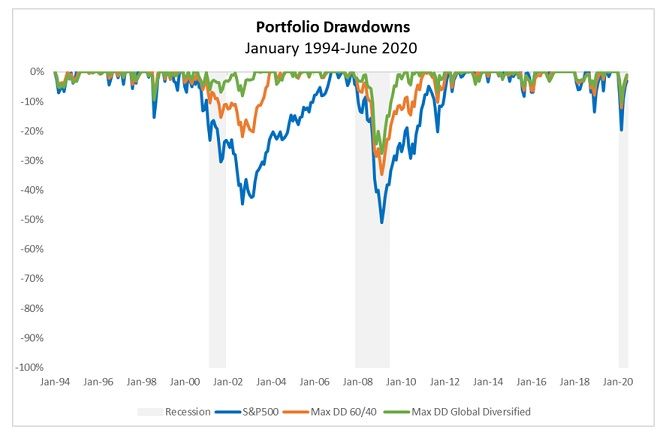 Source: Morningstar, author analysis. The results are hypothetical and are not an indicator of future results and do not represent returns that any investor might actually achieve. Investing always involves risk, whenever you invest you are at risk of loss of principal as the market fluctuates. Past performance is not indicative of future results. Exhibit 6b
 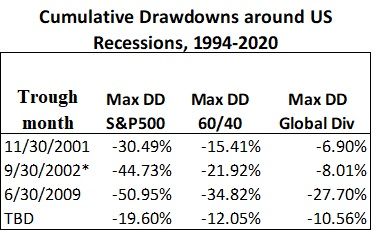 *I include 2002 for reference only, the maximum drawdown occurred after the recession of 2001-2002 had officially ended. Source: Bloomberg, author analysis. The results are hypothetical and are not an indicator of future results and do not represent returns that any investor might actually achieve. Investing always involves risk, whenever you invest you are at risk of loss of principal as the market fluctuates. Past performance is not indicative of future results. Putting it all Together Finally, it’s important to point out that in order to be truly useful to a portfolio, an asset should not only provide diversification benefits (in industry parlance, be imperfectly correlated to other assets in the portfolio), but should also have a positive expected return (a positive risk premium). You can see from Exhibit 4 above that all the asset classes included in the global diversified portfolio exhibited positive nominal returns historically. Seems reasonable to expect that they should do so in the future as well. An easy way to put all of this together is to review where the three portfolios that we’ve been reviewing fall vis-à-vis the efficient frontier. I show this in Exhibit 7. Over the most recent 26 year period, January 1994-June 2020, the graph shows a well-behaved “textbook-like” efficient frontier with stocks lying on the right end of the frontier, bonds on the left end, and our two blended portfolios in the middle. The global diversified portfolio lies on the efficient frontier, suggesting an efficient portfolio meaning that it has provided sufficient return for the risk taken over the period. We can also see that the 60/40 portfolio lies below the efficient frontier, suggesting a sub-optimal combination of assets as it provided insufficient return for the level of risk. In short, the global diversified portfolio appears to better balance asset classes with the greatest potential returns for the degree of risk taken. The key to effective diversification is, no surprise, using more assets (again, that are lowly correlated and have positive expected risk premiums). Exhibit 7
 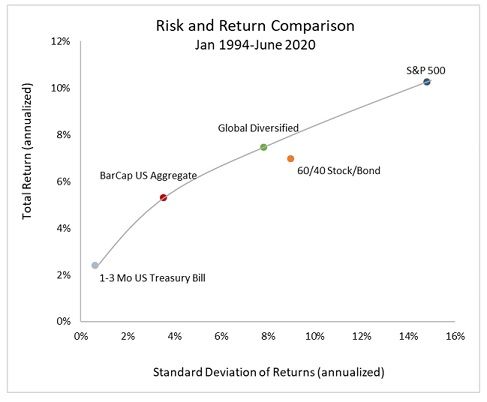 Source: Bloomberg, author analysis. The results are hypothetical and are not an indicator of future results and do not represent returns that any investor might actually achieve. Investing always involves risk, whenever you invest you are at risk of loss of principal as the market fluctuates. Past performance is not indicative of future results. Summary and Conclusions Investors wish to avoid the pain of downside risk while seeking portfolio returns. The ability of a diversified portfolio, especially long-only, to provide relief during market turbulence has come under attack in recent years with many saying that diversification disappears altogether when investors need it most. The evidence here suggests the oft repeated “all correlations go to one in a crisis” is an exaggeration. Instead, diversification remains as relevant to investors today as ever before. Furthermore, achieving a globally diversified portfolio is also never before easier. Although a global diversified portfolio has not eliminated the risk of declines in portfolios in the past, it has been shown to provide both meaningful downside protection while also being an efficient portfolio; that is, in providing a sufficient return for the risk taken. Perhaps Markowitz had it right all along. [1] For this analysis, I start in 1926 as this is where the Ibbotson Stocks, Bonds, Bills, and Inflation data begin. I’m using nominal monthly total returns from Ibbotson/Morningstar. Of course, higher frequency data would give differing results. [2] There is nothing particularly special about using a one year period other than it’s a common rebalancing period (e.g., momentum). [3] The data source for this analysis is Bloomberg. I use total returns. Tickers are as follows: S&P500(SPXT), MSCI Emerging Markets(NDUEEGF), EAFE(NDDUEAFE), Bloomberg Barclays US Aggregate(LBUSTRUU), Bloomberg Barclays Global Aggregate(LEGATRUU), Bloomberg Barclays Emerging Market Aggregate(EMUSTRUU), Bloomberg Barclays Global High Yield Aggregate(LG30TRUU), Wilshire US REITS(WILREITT), Gold(GOLDS). Note that due to data limitations, I use US REITS instead of global REITS. [4] I chose this allocation among the available assets simply for demonstration purposes only. It is but one way among many to accomplish the desired mix of assets. [5] Markowitz, Harry. “Portfolio Selection," Journal of Finance. 1952.
Interested in contributing to Portfolio for the Future? Drop us a line at content@caia.org