


By Chin Liu, Director of Insurance Linked Securities and Quantitative Research, Portfolio Manager; Campbell Brown, Portfolio Manager; and Joe Morgart, Client Portfolio Manager, at Amundi Pioneer
Insurance-linked securities (ILS) is an alternative asset class offering investors the potential for attractive risk-adjusted returns and desirable diversification1 benefits. This overview describes a number of key aspects of the asset class from the perspective of capital market investors, including: a definition of ILS; how the asset class has performed; and a look at the various ILS structures.
What are insurance-linked securities?
Insurance-linked securities (ILS) are investments whose performance depends upon the occurrence of pre-specified catastrophic events. The events, though statistically unlikely (for example: on average of 1 in 75 to 1 in 200 years2), have historically been expensive to re/insurance companies when they do occur. ILS provide a way for re/insurance companies to transfer a portion of their risk and premiums to the capital markets, which allows investors to participate in the re/insurance market. The concept of re/insurers transferring risks to the capital markets gained traction following Hurricane Andrew (1992), which cost the industry $15.5 billion. ILS investors take on the role of a re/insurance company, receiving premiums in exchange for accepting the risk of a loss. If the triggering events do not occur during the tenor of the agreement, the investor enjoys a periodic coupon payment related to insurance premiums and principal repayment at the end of the investment term. If one of the specified events occurs, all or part of the principal is used to pay insured losses and the investors’ coupon payments cease or are reduced; at maturity there is either zero or a reduced amount of principal repaid. What are some of the typical pre-specified perils and geographical regions covered in an ILS transaction? ILS are designed to offer re/insurance protection to the bond’s sponsor following claims from one or more natural catastrophes, such as hurricanes (typhoons), earthquakes, tornadoes, winter storms, wildfires and other perils. Regions that make up the bulk of the coverage are the US, Europe, Japan, Latin America, New Zealand and Australia. In addition, the regional exposure is mostly developed countries as the re/insurance industry has a low penetration in emerging markets. Insurance-linked securities are subject to risks, including but not limited to, issuer (creditor) default, illiquidity, price volatility and limited transparency in reinsurance investments. What are the risk/return characteristics of catastrophe bonds? Given the nature of catastrophe insurance, characterized by low frequency and high severity events, catastrophe or "CAT" bonds have offered higher absolute returns during years with limited events. However, given the randomness and severity of natural disasters, there is the potential for sizable losses. Portfolio level volatility is reduced by diversifying exposures across geographic regions and perils. Nonetheless, we believe investors should maintain long-term time horizons when committing capital to the asset class. The risk and return potential for ILS is based on the modeled frequency and severity of the insured events. Investor demand and the reinsurance industry’s need for external capital can also impact premiums. During periods of strong investor demand, the return potential may be lower. Likewise, potential returns from ILS may be higher when reinsurers have a greater need to increase their use of external capital. This has typically followed a large industry loss. The below chart shows annual calendar returns for the Swiss Re Global Cat Bond Index dating back to 2003. We show this index because it has market-based pricing and a relatively long track record. However, it does not reflect the full ILS market, because it does not include private market securities (ILS structures are described below). The index also has a higher concentration to peak zone risks (US hurricane/earthquakes) than what would be included in a fully diversified ILS portfolio. In terms of performance, the return of the index is impacted in years where there have been significant events for CAT bonds. Notable events that impacted investor returns were Hurricane Katrina (2005), the Japan earthquake and tsunami (2011), Hurricane Sandy (2012), Hurricane Irma (2017), Hurricane Maria (2017) and Hurricane Harvey (2017), Typhoon Jebi and the California Wildfires (2018) and Typhoon Hagibis (2019). Typically, in years following these events, the Rate on Line (ROL), or premium, the re/insurance industry required for underwriting these risks increased. The 1.8% return during 2008 was below expectations in a year with limited catastrophic events. Performance was affected by supply/demand dynamics related to broader capital market volatility during the financial crisis. However, the return compared favorably to the -26.4% return for the ICE Bank of America High Yield Bond Index during that year. 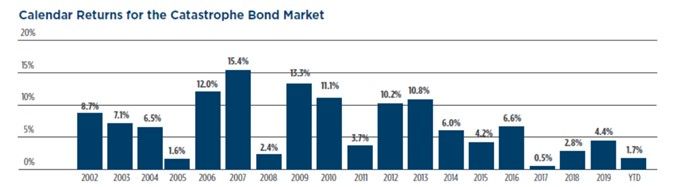 Source: Swiss Re Global Cat Bond Index as of 6/30/20. Data represents past performance, which is no guarantee of future results. Data is not meant to represent the performance of any Amundi Pioneer product. The Swiss Re Global Cat Bond Index, with its inception in January 2007, tracks the aggregate performance of all USD, EUR and JPY denominated CAT bonds in the index, capturing all ratings, perils and triggers. The index seeks to hedge out the EUR and JPY currency risk at the inception of the bonds. However, the index does not reflect the full ILS market because it does not include private market securities (e.g., quota shares, collateralized reinsurance, and ILW). Furthermore, the index also has a higher concentration to peak zone risks (US hurricane/earthquakes) than what might typically be included in an ILS portfolio with private market securities (e.g., quota shares, collateralized reinsurance, and ILW.). Swiss Re has calculated index returns for the five-year period prior to the January 2007 inception of the index. There can be no expectation that the returns of the index will match pre-inception returns. Modeling the impact of significant historical catastrophic events on a hypothetical portfolio provides another angle for evaluating the return profile of ILS. The analysis below was produced using a widely accepted insurance industry risk analytic system, AIR Worldwide CATRADER (CATRADER). CATRADER uses sophisticated statistical analysis that incorporates the full magnitude of historic events on the current geographical area and building structures. This allows modelling of the impact of past events on a current ILS portfolio. There is no assurance the use of this tool will lower the risk profile of a portfolio. The hypothetical portfolio analyzed below had an expected mean long-term return of 10% and median expected return of 14%. The analysis incorporated 300 years of actual catastrophic events. During this time, 22 events caused modeled portfolio losses greater than 10% and as large as 65%. These loss events are accounted for in the hypothetical portfolio’s expected returns. The top five occurrences are shown in the table below. It shows the potential loss impact to the overall industry and the hypothetical ILS portfolio. The largest event occurred over 200 years ago in 1812. A key takeaway is the asset class may offer an attractive return potential. However, the unpredictable nature of catastrophic events could require a long-term time horizon to absorb losses, which can potentially be high.
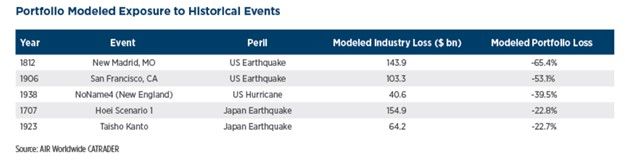
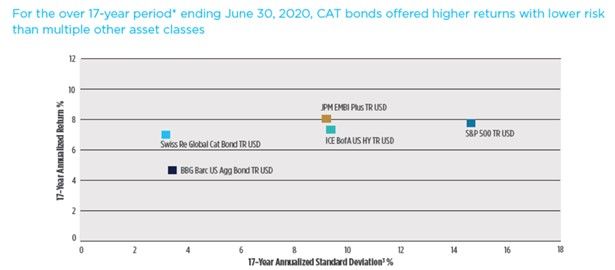 Source: Morningstar as of 6/30/20. Data represents past performance, which is no guarantee of future results. Data is not meant to represent the performance of any product. ILS represented by the Swiss Re Global Cat Bond Total Return Index, which tracks the aggregate performance of all USD, EUR and JPY denominated CAT bonds, capturing all ratings, perils and triggers. The index seeks to hedge out the EUR and JPY currency risk at the inception of the bonds. However, the index does not reflect the full ILS market because it does not include private market securities (e.g., quota shares, collateralized reinsurance, and ILW). Furthermore, the index also has a higher concentration to peak zone risks (U.S. hurricane/earthquakes) than what might typically be included in an ILS portfolio with private market securities. US Stocks represented by the S&P 500 Index; Investment Grade and High Yield Corporate Bonds represented by the Bloomberg Barclays US Aggregate Bond Index and the ICE BofA US High Yield Index, respectively. US stocks offer a higher rate of return, but it may be more volatile than fixed income investments. Corporate bonds offer a fixed principal value and a fixed rate of return if held to maturity. High yield corporate bonds are subject to greater-than-average price volatility, illiquidity, and possibility of default. In our view, one of the most appealing aspects of ILS is its potential diversification properties. By definition, performance is driven by random meteorological or geophysical catastrophic events, which has led to a very low correlation4 to traditional financial market investments. The table at the top of page 4 shows the correlation of the Swiss Re Global Cat Bond Index to other asset classes during the past 17 years. It is important to point out again that we are using the Index (representing CAT bonds) as a proxy for the full ILS market. The modestly positive correlation was related to the 2008 financial crisis. Because CAT bonds are tradable assets, broader capital market supply and demand dynamics increased their correlation to other financial assets. We believe a portfolio that includes private structures would have an even lower correlation to other asset classes.
 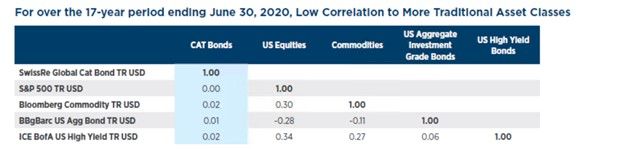 Data represents past performance, which does not guarantee future results. ILS is represented by the Swiss Re Global Cat Bond Index, which tracks the aggregate performance of all USD, EUR and JPY denominated CAT bonds, capturing all ratings, perils and triggers. US Stocks represented by the S&P 500 Index, a commonly used measure of the US Stock Market. Commodities represented by Bloomberg Commodity Total Return Index. US Aggregate Investment Grade Bonds represented by the Bloomberg Barclays US Aggregate Index. High Yield Corporate Bonds represented by the ICE BofA US High Yield Index. Indices are unmanaged and their returns assume reinvestment of dividends and, unlike mutual fund returns, do not reflect any fees or expenses associated with a mutual fund. It is not possible to invest directly in an index. Source: Morningstar, data from February 1, 2002 to June 30, 2020. Note: Correlations for Swiss Re Global Cat Bond Index reflect Swiss Re return calculations for the 5-years prior to the January 2007 inception of the index. There can be no expectation that the returns of the index will match pre-inception returns. How may ILS fit within an investor’s aggregate portfolio? We believe including ILS within a broader asset allocation may have powerful diversification benefits and total return potential. As discussed, ILS portfolio returns are not determined by economic factors such as GDP growth, interest rates or corporate profitability. Rather, performance is driven by the occurrence of low-frequency, high-severity natural disasters such as earthquakes and hurricanes. This is a key distinguishing feature, which has resulted in a very low correlation to other asset classes. The return profile and liquidity of the asset class does require a long-term investment horizon, and all investments are subject to risk and possible loss of principal. Given these characteristics, we believe ILS may fit well within the alternative asset class portion of an investor’s portfolio. What types of ILS structures exist and what are their characteristics? The following are four common types of ILS formats. Catastrophe (CAT) Bonds are the most well-known ILS format. CAT Bonds are issued as tradable securities, which allow them to have a limited secondary market. As such, CAT bonds are used widely by traditional fixed income investors. They provide a precise level of protection above a certain threshold. They also contain triggers with defined conditions, which must be reached before losses accumulate. For example, a CAT bond could cover Florida hurricane damage of a specific re/insurer between $3 billion and $3.3 billion. Alternatively, a CAT bond could be structured to cover multiple events such as a Florida hurricane and an Australia cyclone. Industry Loss Warranties (ILWs) are private, customizable reinsurance contracts through which a re/insurance company can reduce or hedge risk exposure. The payout is based on industry wide losses rather than company specific experience. For example, an ILW could be triggered if industry wide Florida hurricane losses exceed $15 billion for a given event. A benefit to investors is they are not reliant on the quality of the underwriting and claims management process of the individual insurer. Collateralized Reinsurance are private, customizable reinsurance contracts that insurance companies use to reinsure losses related to company specific claims (indemnity triggers). Collateralized reinsurance allows investors to take on the role of a reinsurance company. This product is increasingly popular as it allows the cedent (reinsurance protection buyer) to use capital markets as an additional source of reinsurance protection. Collateralized reinsurance provides investors broad diversification across geographical region and peril. Quota Shares (also known as Reinsurance Sidecars) are different in structure from the ILS described above in a couple important ways. First, quota shares allow investors to participate side-by-side with the reinsurer and share in the profit or losses of its book of business. Investors may need to be careful with the pieces of business being shared in order to avoid “adverse selection” or the risk of participating in unfavorable “cherry picked” risks. If structured correctly, quota shares may better align investor and cedent interests than other forms of ILS. They are highly diversified across region and peril with losses gradually paid out of the structure as they occur. Quota shares offer annual liquidity and typically include one to two year terms. These structures gained popularity following large catastrophic events such as Hurricane Katrina because it allowed the re/insurance industry to recapitalize itself quickly. Each format has its distinguishing features. However, it is important to realize there are also overlapping characteristics across the formats. Key distinguishing features include: Binary vs. gradual loss payouts: The severity of principal loss following catastrophic events differs across structures. It is based on the level of regional and peril diversification and the size of loss layer within the structure. Structures with more gradual curves provide greater diversification. Binary structures can be wiped out quickly if the pre-specified event occurs. These structures allow for more targeted risk exposures. Indemnity vs. non-indemnity payout triggers: The mechanism that quantifies the loss magnitude following events can be based on re/insurance company specific experience (indemnity) or more general non-indemnity based triggers. Non-indemnity triggers include industry wide loss experience, parametric (e.g., wind speed and path, earthquake location, magnitude and depth), or statistical based modeled losses. Indemnity based triggers expose investors to a specific re/insurance company’s underwriting and claim management operations, which should be considered. Secondary market: ILS are offered in tradable or private structures. As such, the level of secondary market transferability varies. Private structures typically offer potentially higher premiums compared to tradable instruments with similar risk to compensate for the lack of liquidity.
 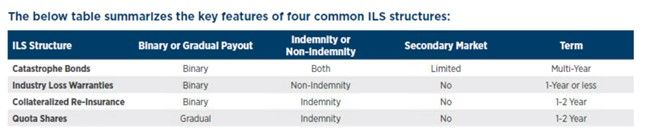 Why have some investors sought ILS exposure? The ILS market has seen significant growth, particularly in recent years. As of June 30, 2020, the overall outstanding ILS market (primarily represented by catastrophe bonds) was approximately $41 billion, nearly 20% larger than at the same point during 2013.5 Significant events over the past fifteen years, including US hurricanes, Japanese typhoons, wildfires and the financial crisis of 2008 have also “tested” the asset class, increasing investors’ comfort level. Investors may turn to ILS in search of: Diversification through Low Correlations: Because the performance of these securities is linked to non-financial risks – natural disasters, longevity risk or life insurance mortality – their performance is not tied to that of the broader bond markets. Attractive Return Potential: Performance for catastrophe bonds has exceeded those of similarly rated corporate securities, albeit with more risk. A Measurable Risk Profile: Unlike corporate bonds, where risk is tied to financial performance, ILS have actuarial risk – the risk of securities defaulting due to specific disasters. Analysis of potential returns and losses for each security is supported by a rich body of data that has been well-modeled for decades by the insurance industry. A Hedge against Interest Rate Risk: The primarily floating rate structure of ILS links a component of their performance to a benchmark rate (LIBOR6 or US Treasury yields), which is adjusted frequently, leaving investors with limited interest rate lockup. The re/insurance industry has endured for countless decades and has multiple tools that allow it to be able to adapt to any potential changes. These include adjusting rates (Rate on Line-ROL), regions covered, perils covered, or requiring modifications to obtain coverage - which we can discuss more in future posts. The asset class may stand out because of the long-term viability of the space and the unique diversification and correlation benefits it may offer. The views expressed in this memorandum regarding market and economic trends are those of Amundi Pioneer Asset Management, and are subject to change at any time. These views should not be relied upon as investment advice, as securities recommendations, or as an indication of trading intent on behalf of any Amundi Pioneer Asset Management product. There is no guarantee that market forecasts discussed will be realized.
| Not FDIC insured | May lose value | No bank guarantee |
1 Diversification does not assure a profit or protect against loss. 2 Source: Amundi Pioneer Asset Management 3 Standard deviation is a statistical measure of historical volatility; a lower standard deviation indicates historically less volatility. 4 Correlation – The degree to which assets or asset class prices have moved in relation to one another. Correlation ranges from -1 (always moving in opposite directions) through 0 (absolutely independent) to 1 (always moving together). 5 Source: Swiss Re. 6 London Interbank Offer Rate (LIBOR) is used as a reference for short-term interest rates. Amundi Pioneer Distributor, Inc., Member SIPC 60 State Street, Boston, MA 02109 ©2020 Amundi Pioneer Asset Management amundipioneer.com/us
Interested in contributing to Portfolio for the Future? Drop us a line at content@caia.org