
By Christoph Junge, Head of Alternatives at Velliv, Pension & Livsforsikring A/S.
|
Alternative Investments are showing dispersion in a challenging environment
The third quarter of 2022 started very different from how it ended. The first half was characterised by falling interest rates and rising equities, which gave some much needed relief after a very bad second quarter for most investors. Unfortunately, the happy days were not lasting and the downtrend in equities and bonds resumed by mid-August. A 60/40 portfolio, a widely used benchmark for a balanced portfolio consisting of 60 pct. equities and 40 pct. bonds, lost another 6 pct. during the third quarter, bringing the total losses to 22,8 pct. in the first nine months of 2022. According to Bank of America, this is the worst year for a balanced portfolio in 100 years! Adding some alternative investments has helped so far this year, with commodities, real assets and some types of hedge funds acting as diversifiers.
But can alternative investments really defy gravity any longer or will they eventually drop together with bonds and equities? As so often in financial markets, the answer is: it depends.
In this column we will make a deep dive into some of the interesting parts of the alternative investment universe and shed some light on the recent developments.
But before we dig into the numbers, I want to remind you of a few technical facts of importance.
Table 1 – Performance of various alternative and traditional asset classes 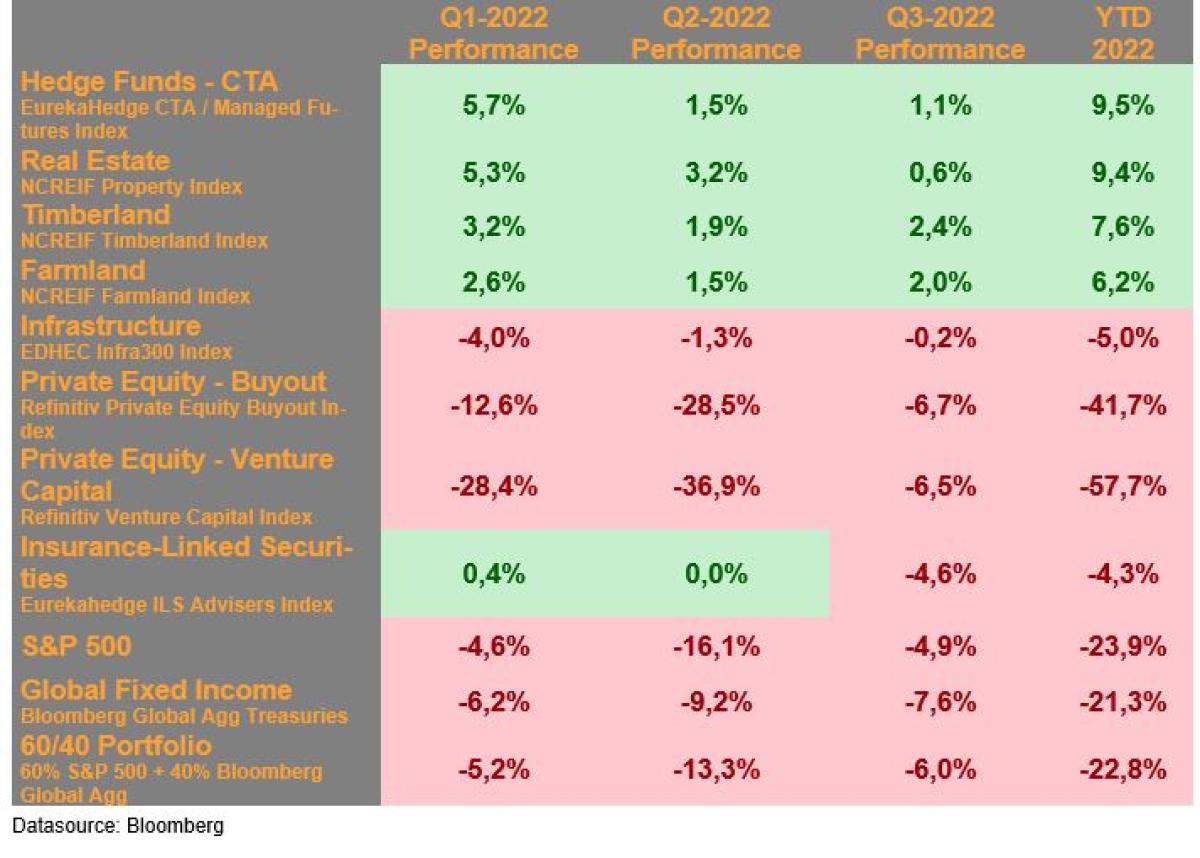
Datasource: Bloomberg
CTA. The asset class as a whole has once again shown that this type of strategy is able to deliver “crisis alpha”, meaning performance when you need it the most. This also confirms the findings from a paper that I wrote earlier on “Alternative investments during crises”. There is no reason to doubt that CTA can continue to perform, as long as there are clear trends across equities, rates, commodities and currencies.
It’s a sub-asset class from the hedge fund universe that is known for using trend following models and it had a hard awakening in July, where the previous trends (falling equities and rising rates) reversed. But as the trends picked up again in August, CTA continued their good run during Q3 2022. The EurekaHedge CTA / Managed Futures Index ended the third quarter up by 1,13 pct., while the SG CTA Index was up with 4,10 pct. in the same period, bringing the performance for the first nine months up to 9,47 pct. and 26,11 pct., respectively, highlighting the huge dispersion in the universe. The index level returns cover over even larger dispersion on manager level. Some of the constituents of the SG CTA Index are up more than 40 pct. YTD while others are barely in the positive territory, highlighting the importance of manager selection in alternative investments.
Real Estate, as represented by the NCREIF Property Index, an unlevered index of directly held properties in the US, slowed down a bit and posted positive gains of just 0,57 pct. and is up 9,35 pct. year to date. While in the first two quarters all sub sectors contributed with gains, the third quarter showed beginning signs of dispersion with office being the first subsector posting a loss, albeit small of -0,66 pct. The largest positive contributor was the hotel sector with 2,70 pct. followed by the apartment sector with 1,20 pct. On a YTD basis, industrial is still the strongest performer with 18,78 pct., followed by apartments with 10,63 pct. Office is the weakest sector. Unlisted real estate is often compared with the listed equivalent REITs (real estate investment trusts). This year has so far shown that this is an imperfect proxy as REITs typically operate with a lot of leverage and sometimes also are more opportunistic in nature. I have covered this in more detail in another column on EjendomsWatch (in Danish).
Both timberland and farmland posted positive returns in Q3 and are up 7,64 pct. and 6,18 pct. respectively year to date and give, together with real estate, the impression that real assets live up to their reputation of being a, at least partial, inflation hedge.
Infrastructure, as represented by the EDHEC Infra300 Index, had another negative / flat’ish quarter with losses amounting to -0,17 pct. It is now down 5,01 pct. year to date. Some (but certainly not all) infrastructure assets profit from an increase in inflation, either through explicit or implicit linkage to CPI, which leads to higher cash flows. From a business model perspective, the regulated and contracted assets were detractors while merchant assets contributed with solid gains. Especially road companies and independent power producers had a good quarter. The rise in interest rates is still the most significant factor impacting the discount rates and the valuations, but the increase in expected cash flows over the last year has offset more than half of this negative impact, according to EDHEC. The linkage to inflation and stable returns is in fact what makes this asset class interesting, especially if we should enter a stagflationary scenario. Especially renewables should fare well in this scenario and might be less sensitive to rising interest rates as one might assume, given that the residual value and the end of its economic life is assumed being zero. Hence, its value is derived entirely from the projected cashflows and not any sale value, as highlighted by Schroders Capital.
Private Equity incl. Venture Capital had another negative quarter with losses of 6,73 pct. and 6,45 pct., respectively, bringing the year-to-date performance down to -41,7 pct. and -57,7 pct.
As stated in the beginning of this column, the chosen benchmarks often overstate the movements in the market compared to “real” private equity over shorter time frames. Interesting in this regard is, that some closed ended fund of funds that are listed (like Coeli Private Equity AB, HarbourVest Global Private Equity Ltd., NB Private Equity Partners Ltd., and Pantheon International PLC) are “only” down between -15 pct. and -31 pct. This does not reflect a drop in their NAV, but rather a larger discount between NAV and share price, as shown in this example. In addition, the reported private equity returns as of 30/9 by institutional investors are, at least if their portfolios consist of PE funds, in fact for the period from Q4 2021 to Q2 2022 (often with adjustment based on movements in public markets) as the quarterly NAV for the end of the third quarter are not yet received for most of the funds due to the time lag mentioned in the beginning.
As mentioned in the previous column, critics of private equity often argue that managers are not marking to market, but we have seen exits this year at prices that were above book value, some even substantially above book value, and at valuations that could raise an eyebrow. This is a good reminder that the true price of an unlisted asset is only known at the time of a transaction and that a skilled manager and the right buyer is all it takes to create great returns, even when public markets turn sour.
The beautiful thing about private equity is indeed that it is much more complex than just taking public market performance adjusted for beta. Returns are created by improving the company and finding the right exit. Academic research indeed confirms that operational improvements are an important driver of value creation. So far, the strong development in the fundamentals like EBITDA of the portfolio companies holds a hand under the valuation, even with shrinking valuation multiples in the public markets. And valuation multiples is an important point, as data from Pitchbook, LCD and J.P. Morgan Asset Management shows that purchase price multiples for US buyouts in fact are a bit up this year with 11,5x trailing EBITDA, compared to 2021 with 11,2x and 2020 where the multiple was 11,3x. Compare that to public markets where the EBITDA multiple of the S&P 500 went from 13x by end of 2019 to 19,5x by end of 2020 and now back to 12,8x. Could this indicate that the listed markets maybe were a bit frothy last year while private markets had better pricing discipline and the drop in listed markets is more a sign of reversion to more healthy valuations? Maybe. But it shows at least that the very strong Private Equity returns in 2021 were not (solely) driven by multiple expansion but by higher EBITDA. Even though the transaction multiples in the buyout market have been rather stable in the last few years, this does not mean that there couldn’t come a multiple contraction or that the EBITDA could shrink, leading to falling enterprise values, if the economy continues to deteriorate. Either way, expect huge dispersion dependent on manager skill, sector & vintage allocation going forward.
Insurance-Linked Securities (ILS), often also referred to as “CAT Bonds” (catastrophe bonds), were down by -4,6 pct. in the third quarter, bringing the YTD performance down to -4,28 pct. The third quarter is high season for US hurricane risks and while the beginning of the quarter was unusual peaceful on that front, this changed when Hurricane Ian made landfall in Florida by end of September. Ian was a large, complex, and destructive category 4 hurricane and was the deadliest hurricane since the 1935 Labor Day hurricane. According to risk modelling company RMS, the total insured losses could amount to between $53 billion and $74 billion. Market participants expect higher insurance premiums in the ILS market following the losses. This in turn could lead to a shorter “payback time” for ILS investors - of course under the assumptions of no further losses.
Conclusion: 2022 has so far shown the value of adding alternatives to a portfolio and debunked the myth that rising rates per se are negative for all types of investments as higher cash flows can offset the impact from higher discount rates – at least until a certain point.
The positive correlations between equities and bonds has made this year a tricky one and not easy to navigate for investors. Long-only investors have not had many places to hide. But the ability to take long/short positions helped CTA tremendously, especially being short bonds in an environment of rising interest rates. ILS, which are normally a good diversifier due to their uncorrelated nature, had losses as well, but of course driven by other factors than rising rates or falling equities. The 1-million-dollar question is still whether the next years will resemble a replay of the 1970’s with sustained higher inflation and massive interest rate increases or whether this will be rather short lived.
It is going to be interesting how real assets will cope with the higher interest rates going forward. With more challenging markets ahead, active management has its justification but expect more dispersion between good and bad managers in the years to come. The more complex the area, the larger the dispersion. I will follow up in February with a column looking at the full year 2022. |
About the Author:
Christoph Junge is Head of Alternative Investments at Velliv; Denmark’s third-largest commercial pension company. He is a Chartered Alternative Investment Analyst and has more than 20 years of experience from the financial industry in both Denmark and Germany. He has worked with Asset Allocation, Manager Selection as well as investment advice in, among others, Nordea, Tryg and Jyske Bank.