

By Scott Opsal, CFA, co-Portfolio Manager and the Director of Research & Equities for The Leuthold Group, LLC.
The balanced portfolio strategy of allocating 60% to equities and 40% to fixed income generated a highly satisfactory 7.9% annualized return over the last 30 years. Despite the excellent returns earned by investors following this strategic model, the past couple of years have seen a parade of articles with headlines such as “Is the 60/40 Portfolio Obsolete?” and “Is the 60/40 Dead?” Given the central importance of this moderate allocation strategy to investment industry practices, we felt a closer look at the 60/40 portfolio was in order.
Valuation Matters
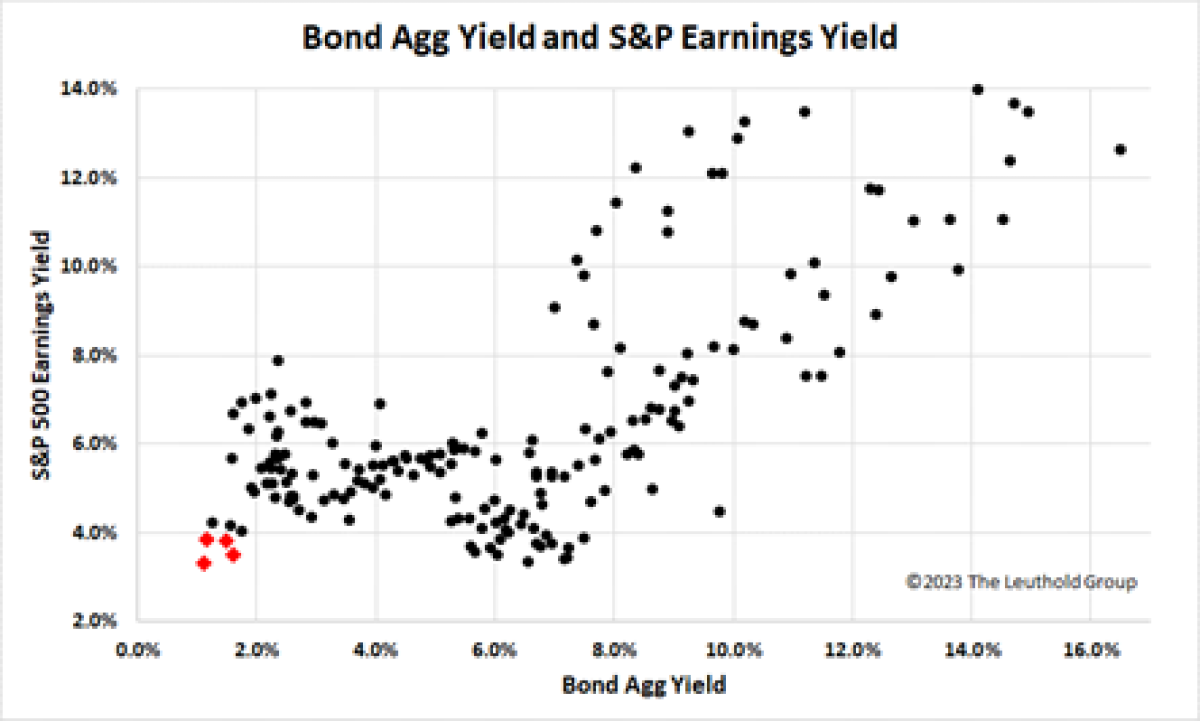
Skepticism and concern over the 60/40 portfolio arose from the valuation extremes reached by each asset class in 2021. Chart 1 plots the yield-to-worst for the Bloomberg U.S. Bond Aggregate Index along with the earnings yield of the S&P 500 Index, our two asset class representatives. Despite excellent backward-looking returns for the 60/40 mix, future returns are driven by current valuations, and those were singularly unattractive in late 2020 and early 2021.
The points in this exhibit represent the joint valuation of stocks and bonds during each quarter since 1976. The four red diamonds found in the lower left portion of Chart 1 signify the last two quarters of 2020 and the first two quarters of 2021, the period when doubts about the 60/40 strategy became increasingly louder. These four quarters represent the worst joint valuations for stocks and bonds in 45 years and starting from valuation extremes in both asset classes, it was hard to see how future 60/40 returns could come anywhere close to the long-term average.
Chart 1:
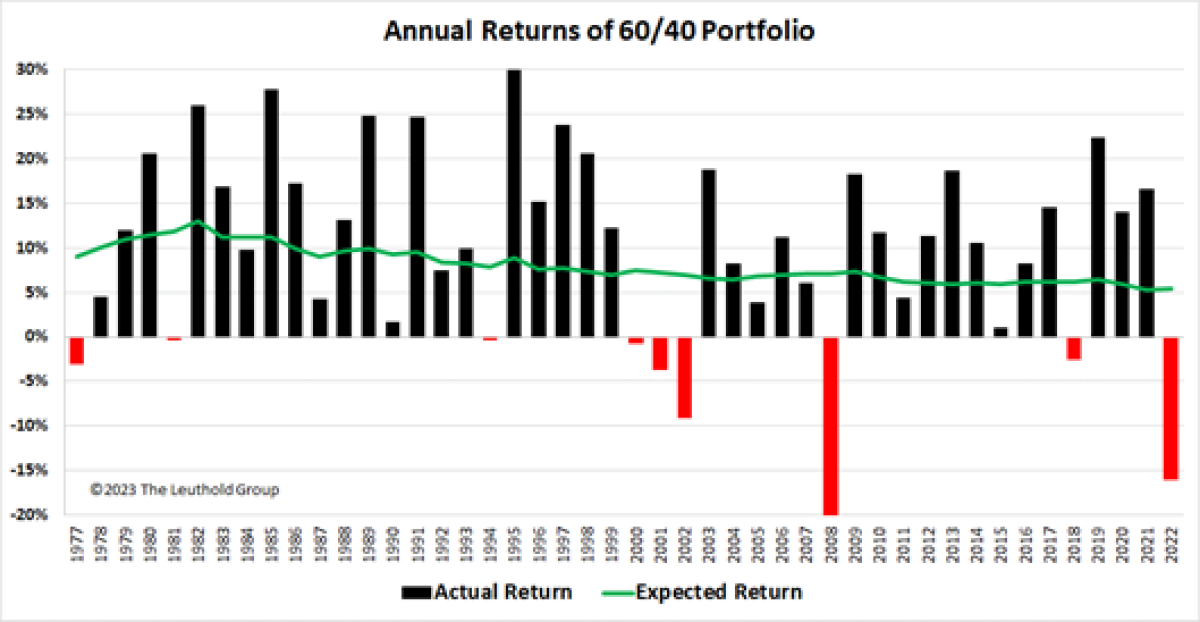
As it turns out, the skeptics were right! The 60/40 strategy had a terrible 2022, and the strategy utterly failed in protecting investors during this severe bear market. Chart 2 depicts annual returns for the 60/40 portfolio, with the red bars measuring the contribution from fixed income, the blue bars measuring equity’s impact, and the black diamonds capturing the combined 60/40 portfolio returns.
Chart 2:
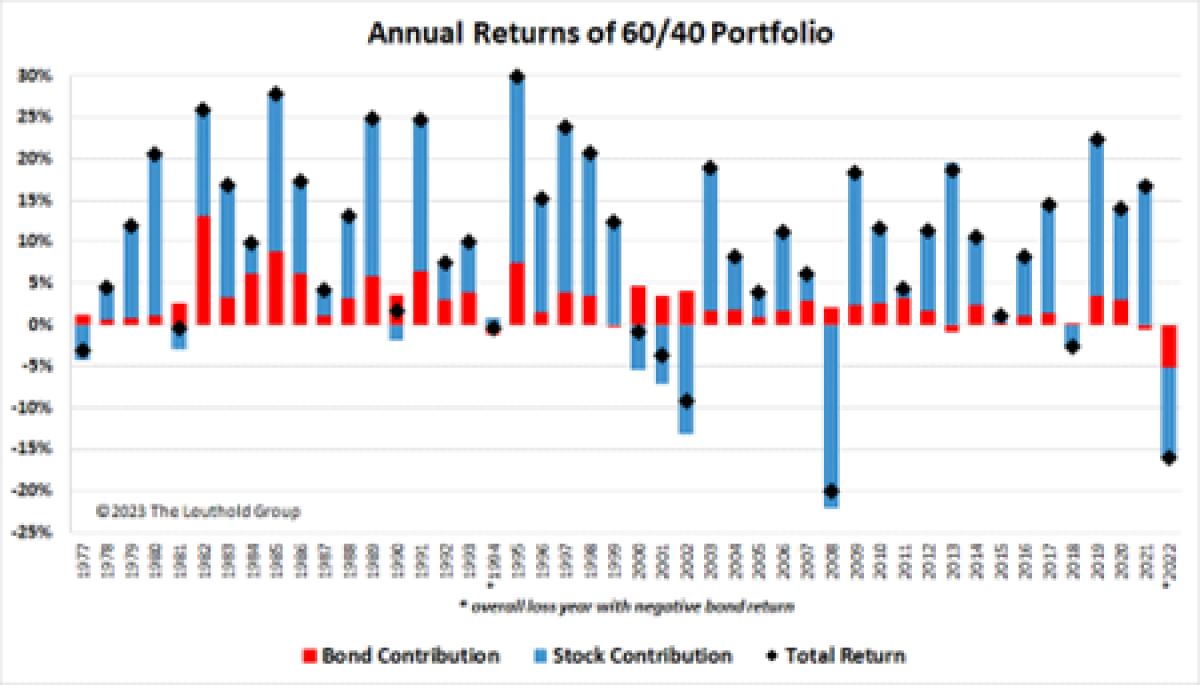
Based on the premise that investors following a moderate risk strategy are willing to trade some equity upside in order to avoid large drawdowns, the 60/40 mix has worked fairly well. Since 1976 there have been nine years when the 60/40 portfolio posted negative returns. Three of those years barely registered negative, and three others stopped short of a 5% overall loss. The only two prior annual declines of more than 5% came in the depths of severe equity bear markets in 2002 and 2008, and in both cases, bonds delivered positive returns to temper the overall loss.
However, 2022 was the first year in which both assets were down significantly. The Bond Agg lost 13.0 while the S&P 500 fell 18.1%. The only other year a 60/40 portfolio lost money and had a negative bond return was 1994, a mere blip on the chart. When faced with record low expected returns on both stocks and bonds to start the year, forecasting poor returns for the 60/40 portfolio was like shooting fish in a barrel; the only surprise was how quickly the moment of payback arrived.
Forty Years of Richening
Chart 1 plotted concurrent valuations for stock and bond yields, and we show the time series of each factor in Chart 3. Both asset classes have experienced an extended progression of becoming richer as measured by these simple but useful estimates of expected return.
Chart 3:
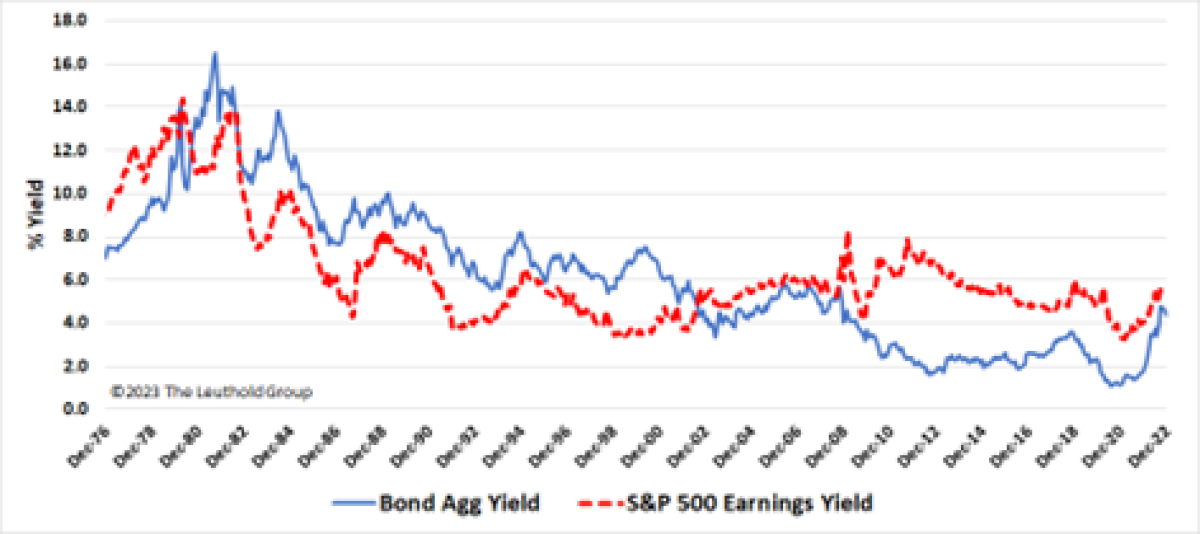
The Bond Agg reached a record YTW of 16.5% in September 1981, thereafter embarking on a nearly uninterrupted 40-year slide to hit 1.05% in July 2020. Meanwhile, equity valuations began their own richening process, moving from an earnings yield of 14.3% (a trailing PE of 7.0 times earnings) in April 1980 to reach a record low earnings yield of 3.25% (PE of 30.8) in February 2021. This concurrent richening of both asset classes had the effect of boosting 60/40 returns well above their normal expectations, because the returns achieved by a balanced portfolio since 1976 were greatly exaggerated by steepening valuations over that period.
Expected Return for the 60/40 Portfolio
Capital markets theory and historical studies give us a reasonable idea of forward-looking returns for a 60/40 portfolio. The expected return for income-producing assets is the sum of (a) current yield, plus (b) growth rate, plus (c) change in valuation. The first two terms, yield + growth, represent the fundamental return that can be sustained indefinitely, while valuation changes are more ephemeral.
Since bonds have current yield but no growth, studies show that the best estimate of their expected return (or most any asset with a fixed maturity and payment stream) is simply the asset’s beginning yield. The fundamental expected return on stocks is dividend yield plus growth, of which the first term is known while the second requires an estimate of future growth. Focusing on fundamental or intrinsic returns, the expected return on a 60/40 portfolio is the sum of
- bond YTW times 40% portfolio weight, plus
- stock dividend yield times 60% weight, plus
- equity growth rate times 60% weight
Note that since the growth rate of a bond’s income stream is zero, that term is absent from the equation.
Chart 4 begins our analysis of expected returns with the first two terms, the blended current yield of bonds and stocks. At the 1981 peak in bond yields, a 60/40 portfolio would have offered a current yield of 10% with the growth potential of equities thrown in as a kicker. As valuations climbed and yields declined, the current yield on a 60/40 mix bottomed at 1.34% in July 2021, and with the Fed’s vigorous actions last year the combined yield stands at 2.79%.
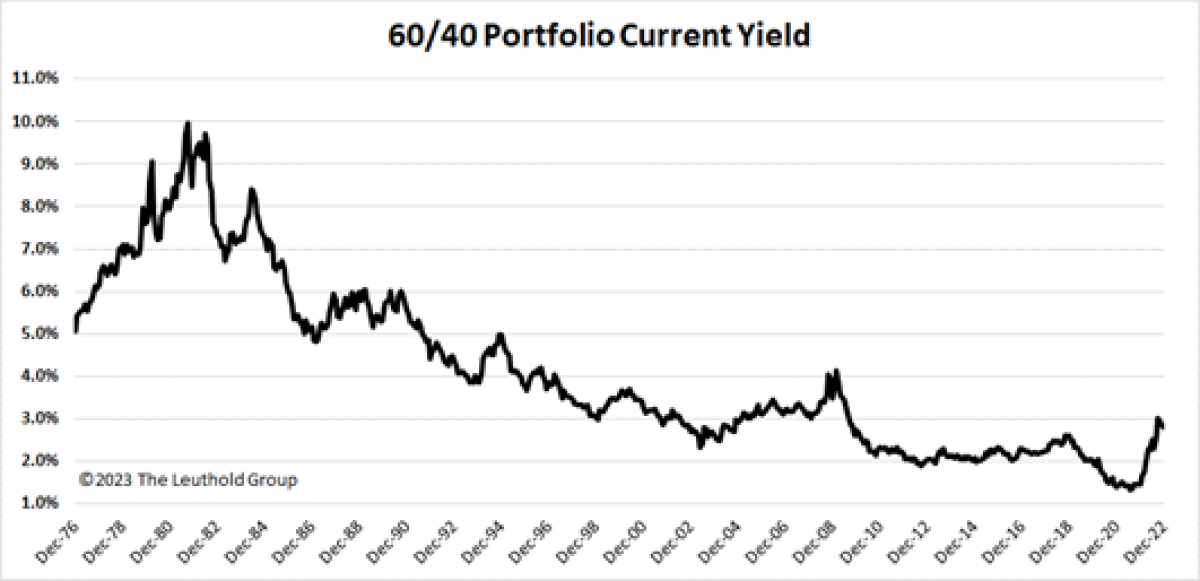
Current yield has historically accounted for more than half of the total return on a 60/40 mix, so after considering the 1.34% combined yield of mid-2021, the prospects for average total returns were daunting indeed. At that yield, a balanced portfolio would require equity earnings to show a long-term growth rate of 9.6% to generate a 7% total portfolio return. Such growth is highly unlikely, and it is the formidable mathematics of a 1.34% starting yield that generated skepticism about the 60/40 strategy last year.
The third term in our fundamental return equation is the growth rate of equity earnings and dividends. This requires an estimate that can change over time, but we can use the long-term S&P 500 EPS growth rate of 6.5% as a starting point. Given an equity weight of 60%, this earnings growth produces an overall portfolio growth rate of 3.9%. Added to the portfolio’s current yield of 2.8% mentioned above, this sums to an expected total return of 6.7% for the 60/40 portfolio starting today.
Chart 5 plots the historical expected total return, applying the 6.5% long-term earnings growth rate on top of the current yield back to 1976. We see the same historical pattern with this time series beginning at extraordinarily attractive levels, then declining to a record low which gave rise to 2021’s widespread doubts about future returns.
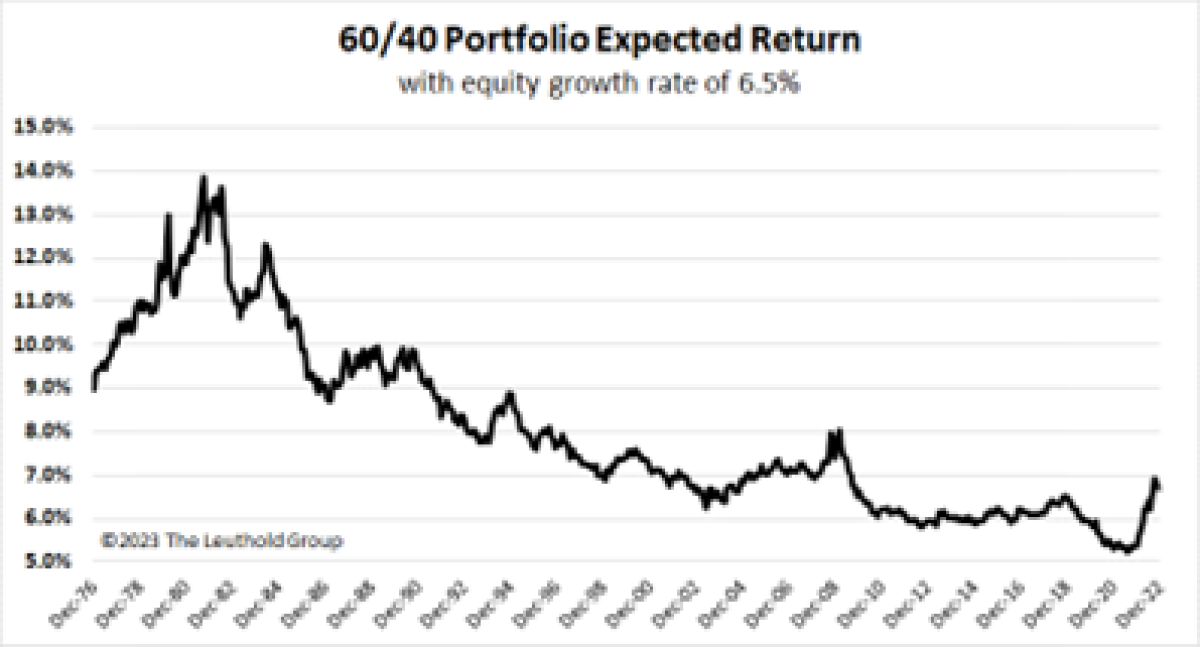
On the bright side, thanks to collapsing equity multiples and rising bond yields, the nearly 2-point improvement in fundamental returns since late 2021 is perhaps the best and sharpest short-term improvement in this series since the 1970s. From today’s levels, expected returns for the 60/40 portfolio have improved markedly and stand just below the long-term average.
It Was The Best Of Times
The punch line of our analysis so far is captured in Chart 6 which merges the actual return (bars) and expected return (green line) histories into a single display. The consistent richening process for both stocks and bonds lifted realized returns well above expected returns quite often in recent years, as signified by bars that reach higher than the green line.
We estimate that rising valuations boosted actual annualized returns almost 3% above expected returns from the end of the 2002 Tech crash through 2021, and even with last year’s giveback the excess return is an annualized 1.5% over the last twenty years. The concern in 2021 was that a reversal in valuation trends, which saw stocks and bonds becoming consistently cheaper over time, could have the opposite effect on realized returns in the years ahead.
In addition to the fundamental return drivers of yield + growth, realized returns are also influenced by episodic changes in valuation which produce “windfall” gains or losses. Today’s 6.7% fundamental return will benefit from or suffer from valuation changes that will impact future realized returns. Long-term investors may choose to ignore short-term valuation moves and focus on the expected return, a sensible approach to be sure. Other investors may want to make a tactical call and top up their return expectations (relative to 6.7%) if they believe valuations will richen from today or temper their expectations if they believe valuations may contract further.
Correlation Eras
Not only have valuations produced a tailwind for 60/40 investors, favorable trends in correlations have also helped create an ideal investment environment. The stock/bond correlation has been negative since the late 1990s, producing excellent diversification benefits and allowing investors to comfortably hold increasingly expensive equities, confident that bond gains would likely offset any stock market declines.
However, like consistently rising valuations, this negative correlation is a hallmark of recent years rather than an inherently permanent state of affairs. Chart 7 depicts the 24-month rolling correlation between large cap stocks and long-term Treasuries since 1927, highlighting the cyclical nature of correlations and suggesting that the recent era might be an exception rather than the rule.
Chart 7:
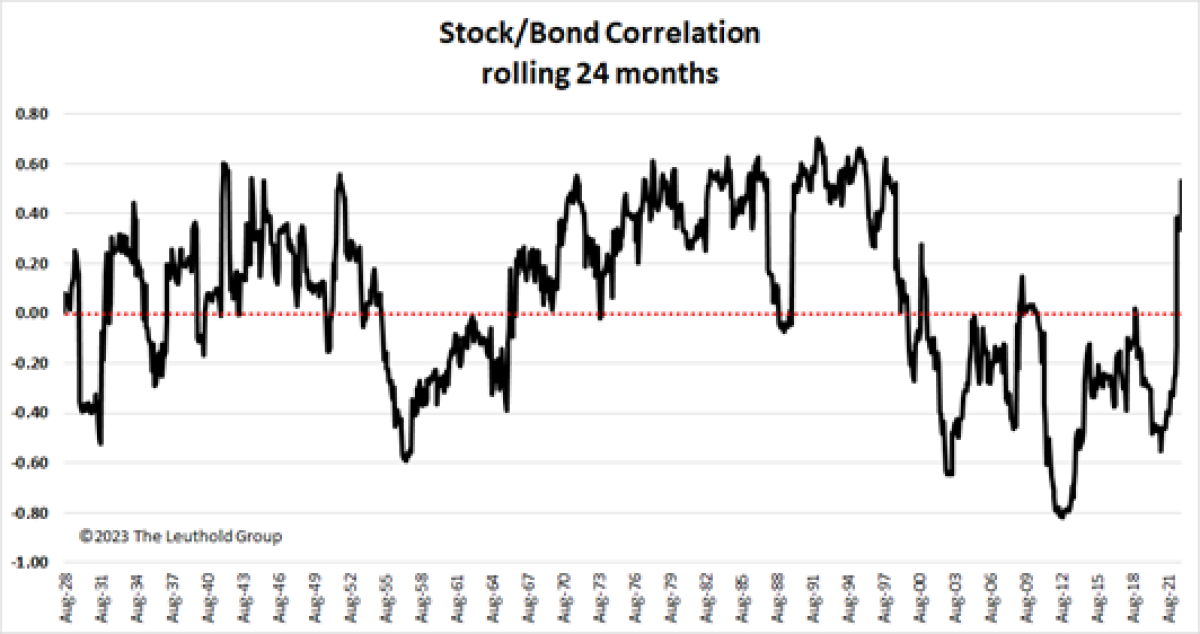
Taking the long view, stock/bond correlations have generally been positive. Since the Great Depression, there have only been two periods of sustained negative correlations; 1956-1965 and 1997 to 2021. The duration of the most recent negative correlation era may have led investors to conclude that bond returns will usually offset stock weakness, but history does not support the notion of “negative is normal.”
Numerous researchers have examined the topic of stock/bond correlations, trying to identify the factors that lead to positive or negative episodes. As we review these studies, we find common themes which are suggestive of a link between economic conditions and correlation’s sign. The consensus seems to hold that stocks and bonds have the same sensitivity to inflation and interest rates, and opposing sensitivity to economic growth and unemployment. Therefore, when inflation and interest rates dominate the conversation (today) we should expect a positive sign on correlation. Conversely, when economic growth (typically meaning slow growth) dominates investor concerns, the relationship may well be negative.
This framework would certainly explain the recent flip to positive correlation, as inflation and rising rates are driving markets today. In fact, some measures of stock/bond correlation have reached as high as 0.70 in recent months, pushing the upper bounds of the historical range. Last year’s violent swing to positive correlation was evident in Chart 2, with 2022 being the only year of the last 40 when stocks and bonds have both posted significantly negative returns together. Other major market declines in recent decades have always seen bonds generating positive contributions to partially offset equity losses.
Positive correlations not only hinder bond’s ability to mute stock market declines, should they persist, they may also influence the behavior of institutional investors. Many large, long-term institutional mandates follow a policy of risk budgeting, or targeting a particular overall level of portfolio volatility. A sign change in correlation could significantly affect the strategic mix targeted by risk-budgeting institutions.
Chart 8 demonstrates the impact of positive correlations on strategic portfolio allocations. This chart displays total portfolio standard deviation on the y-axis for each percentage allocation to equities on the x-axis. Using assumptions of 16% equity risk and bond risk of 6%, the recent 20-year window of negative correlations fluctuating around -0.4 produces the blue curve and a portfolio standard deviation of 8.9% (signified by the horizontal green line) at a 60% equity allocation.
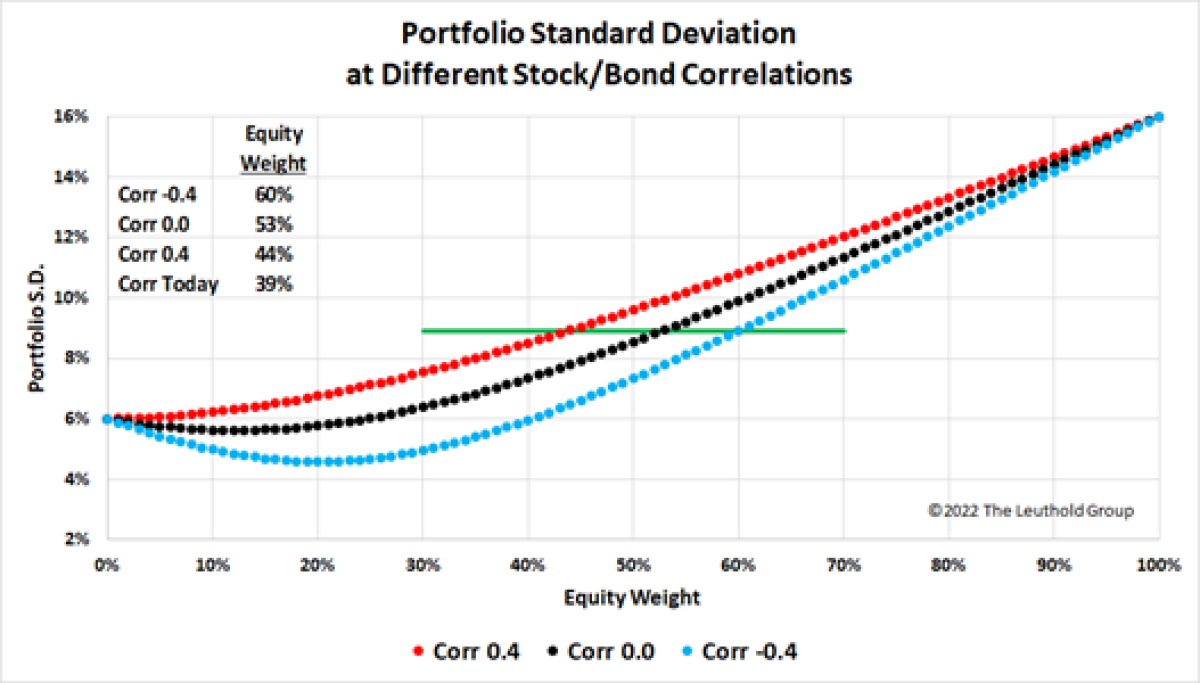
Using recent history’s -0.40 correlation as a baseline for understanding risk targets, we can examine the impact of other possible correlation levels on strategic allocations. For example, if correlation moves to 0.0, the equity allocation would need to fall to 53% (black curve) in order to match the same 8.9% standard deviation. If correlation moves to +0.40 the equity sleeve would need to decline to 44% (red curve) to maintain a constant risk level. Using today’s elevated +0.60 correlation the same risk target would call for a portfolio mix of 61% bonds and just 39% equities. In other words, should current positive correlations remain for some time, risk-targeting investors may be forced to either (a) reduce their equity allocation by 15 to 20 points, or (b) live with a noticeably higher expected portfolio volatility.
Research Takeaways
The 60/40 portfolio allocation has flourished in what could be called the best possible world over the last 25 years, defined by
- consistently rising stock market valuations
- consistently falling bond yields, and
- consistently and strongly negative correlations
These three positives caused realized returns on 60/40 portfolios to run well ahead of expected returns, a process that by definition cannot run on forever.
However, all three factors turned against investors in 2022, producing the worst year for 60/40 portfolios in decades. Last year’s troubles (and preceding skepticism) were the direct result of extreme valuations reached in 2020 and 2021, such that the forward-looking expected return on a 60/40 mix reached its lowest level ever.
Falling stock valuations and rising bond yields have lifted the forward-looking returns on a 60/40 mix to 6.7% today, not far below recent average returns. This speedy reversal of fortune, one of the quickest and strongest ever, has greatly improved the attractiveness of 60/40 going forward.
If correlations return to a positive sign consistent with most of financial history, the diversification effect of balanced portfolios will decline, and investors may be less willing to hold large allocations to equities when they are feeling bearish. Institutional investors may also need to reconsider their strategic mix, as positive correlations would call for a lower equity weight in order to meet existing risk targets.
The 60/40 portfolio’s 2022 annus horribilis was presaged by valuation extremes in both assets in 2021, and commentators were rightly skeptical about the strategy’s future prospects. However, having experienced a record correction last year, the 60/40 is once again priced to deliver reasonable expected returns, albeit with more volatility caused by a diminished benefit from diversification.
About the Author:
Scott Opsal, CFA, is a co-Portfolio Manager and the Director of Research & Equities for The Leuthold Group, LLC. His responsibilities include conducting in-depth research projects and exploring new fundamental and quantitative studies that support the firm’s portfolios and strategy recommendations.

Scott brings nearly forty years of professional investing experience to the Leuthold team, previously serving as Chief Investment Officer of Invista Capital Management and Head of Equities at Members Capital Advisors. Scott was also the Director of the Applied Investments Program and taught Security Analysis and investment classes at the University of Wisconsin–Whitewater.
In his leadership roles, Scott was involved in all aspects of firm management: establishing policies on risk management, asset allocation, quantitative techniques, institutional-grade research, and portfolio management processes. Previous management assignments include international equity, domestic equity, taxable investing, and convertible securities. His top-quartile and five-star performance records led to twice being named to Barron’s “Top 100 Mutual Fund Managers.”
Scott received his undergraduate degree from Drake University in 1982 and an MBA from the University of Minnesota in 1983. He earned the Chartered Financial Analyst designation in 1986 and recently served on the Madison, WI, CFA Society Board of Directors.