

By Kailash Concepts Research. Kailash is a close-knit team that hails from academia and some of the world’s largest and most-respected investment firms.
We recently posted a year end piece summarizing KCR’s work from 2022. There were so many blistering charts that we broke the recap into two parts. The first, Short Term Stock Speculators Beat a Hasty Retreat, and A Basic Industries Boom & the Return of the Real Economy as the follow-up.
When we posted our 2022 year-in-review we highlighted the charts as they were when originally published. We thought it interesting simply because they made the empirically inevitable seem obvious with the benefit of hindsight. We failed to appreciate that our wonderful readers would ask “well where are those charts now?”
This piece remedies that deficiency. All the charts from Part I and Part II are updated on the pages below.
Our work in 2021 and 2022 has dealt with the consequences and opportunities of capital misallocation. The team is fond of saying that capital allocation has consequences. After a speculative orgy, unlike anything in American history, that peaked in 2021, KCR finds the investment universe split between stocks that offer remarkable opportunities and those that, based on historical data, seem destined for dim futures.
Over the years, our readers have likely noticed that our writing has become less academic in tone and tended towards being shorter and more practical. For those interested in cutting-edge academic research from behavioral finance on inefficient markets, let us know. KCR will happily make sure you receive the most recent work from the team’s prolific publishing academic.
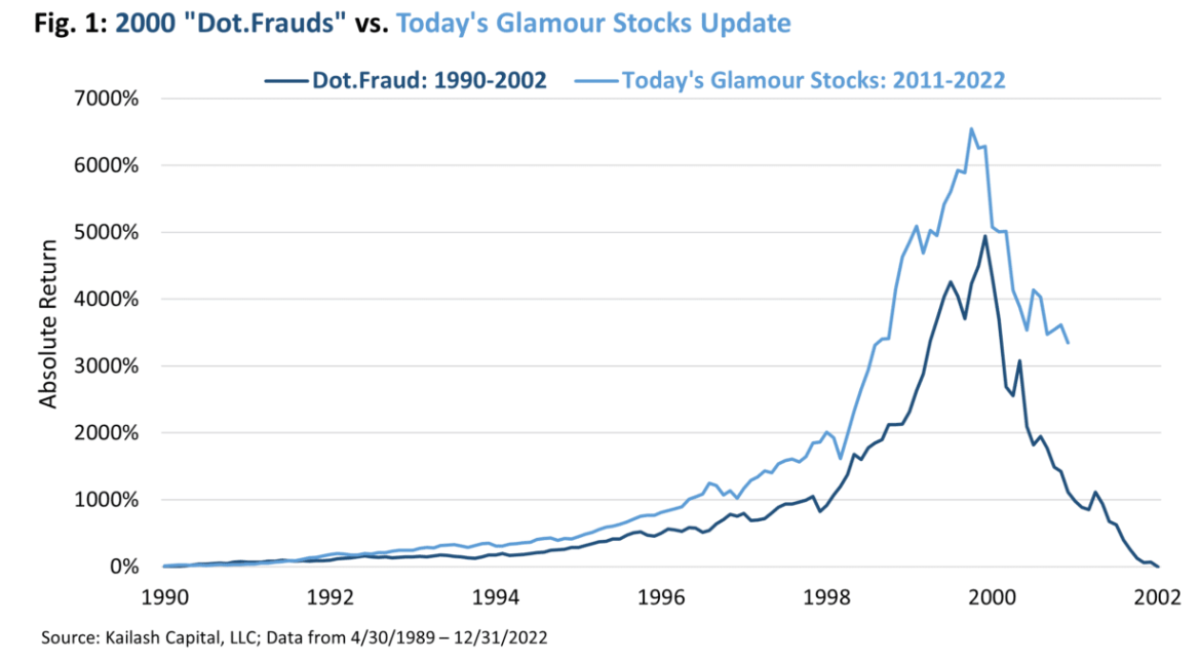
The below chart is an update from our January 2022 piece Stocks Most Like Enron. As KCR explained, these stocks all had returns, valuations, and earnings quality weaknesses that were as bad, or worse, than when Enron peaked. We froze the constituents and have been tracking them since. You can see that they may have much farther to fall.
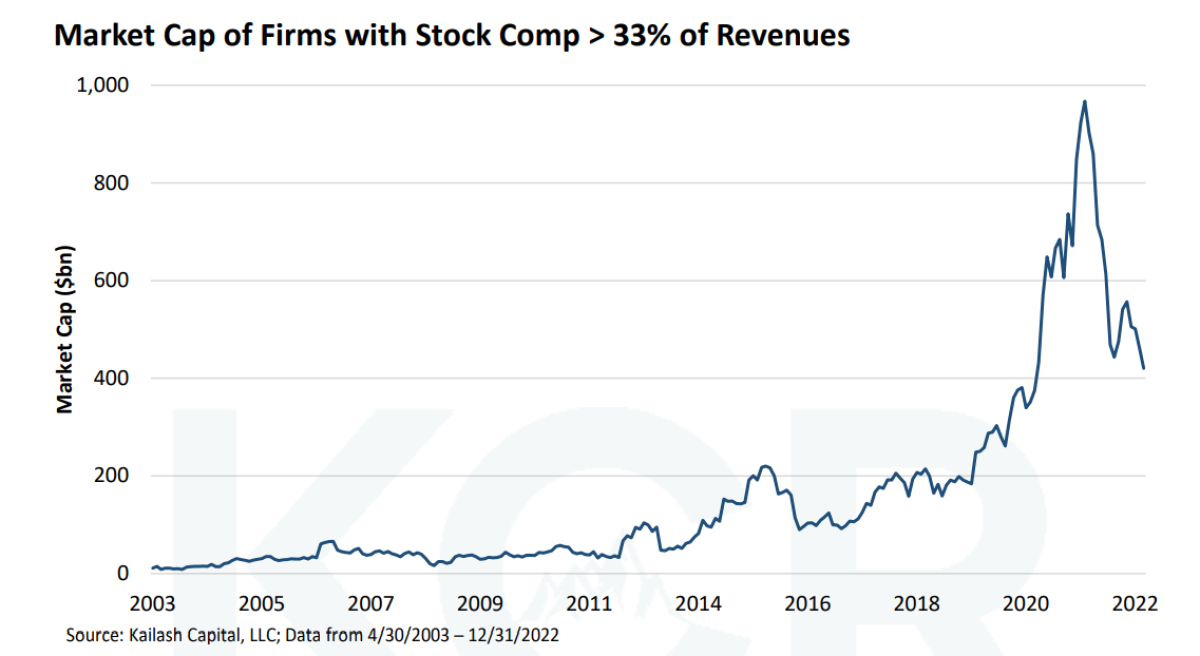
From our April piece SBC Finance, the chart below shows the combined market cap of firms that pay out over a third of their sales in stock-based compensation. The chart is updated through year-end 2022 here and, like the Enron chart above, suggests these firms may have much further to fall.
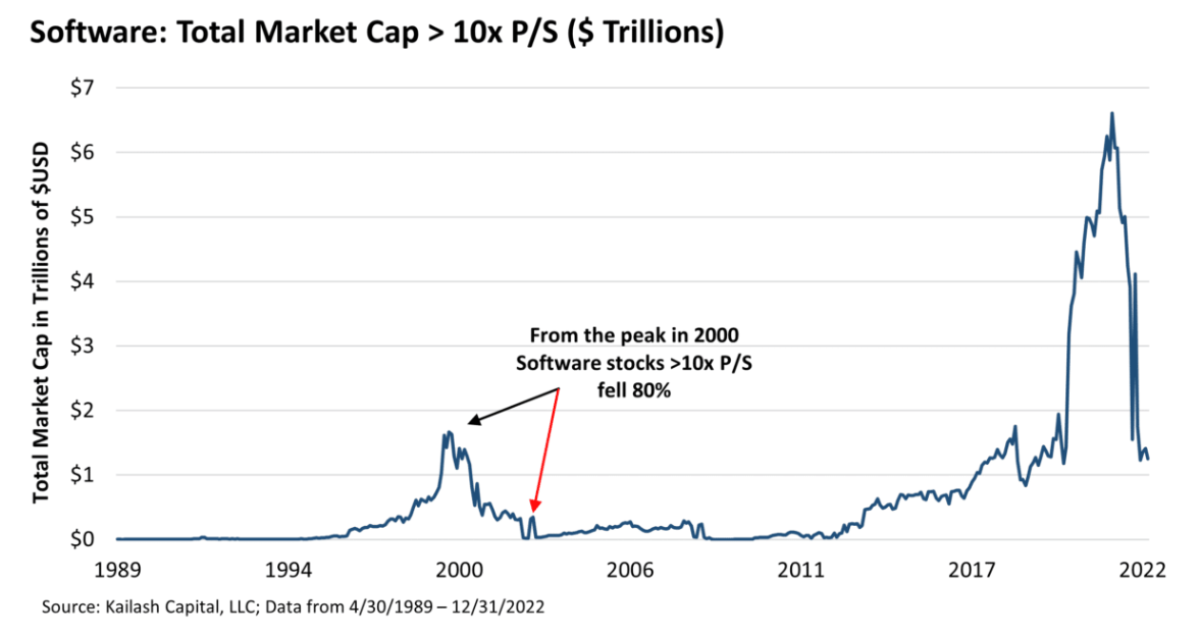
From our piece, A Good Price to Sales Ratio is Tough to Find, the chart below shows the combined market cap of software stocks trading over 10x price to sales as of year end 2022. While difficult to see, it is noteworthy that, despite the collapse since publication, there are still over $1 trillion of software companies with market caps at a valuation Sun Microsystem’s Scott McNealy quoted as being indefensible.
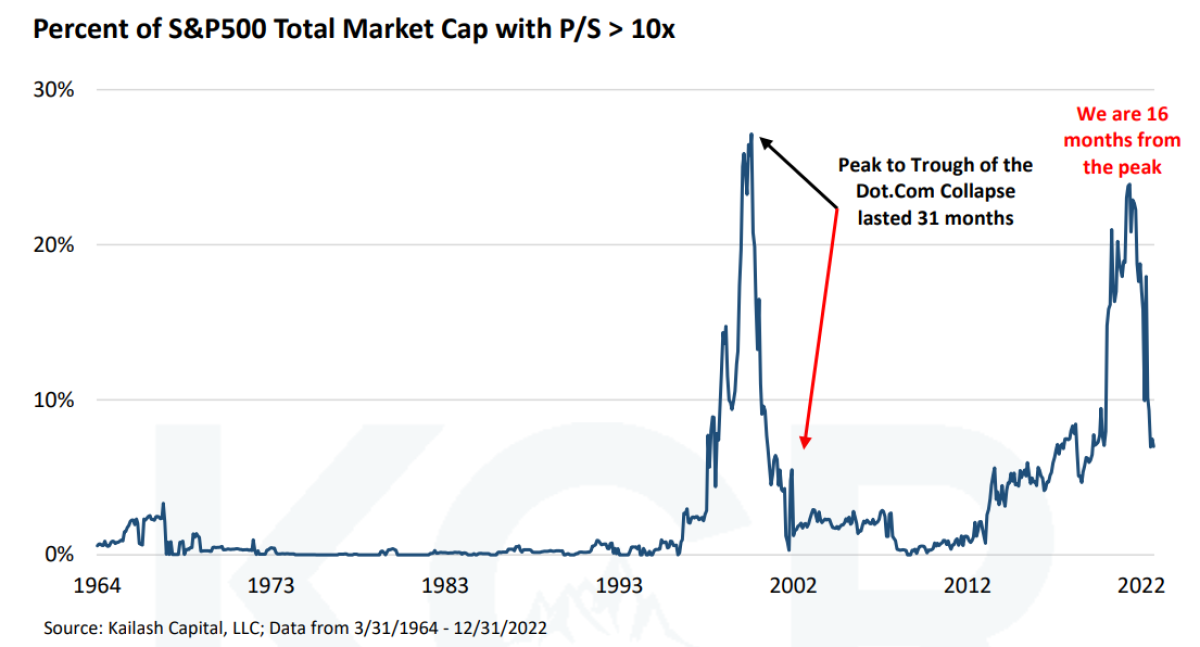
From our piece in May, Tesla Price to Sales Ratio & the Coming Tax on Index Fund Owners, we have updated the percent of the S&P 500 sitting in stocks trading over 10x price to sales below. We would note that the weighting is typically at ZERO. This suggests index fund owners are still taking needless risks.
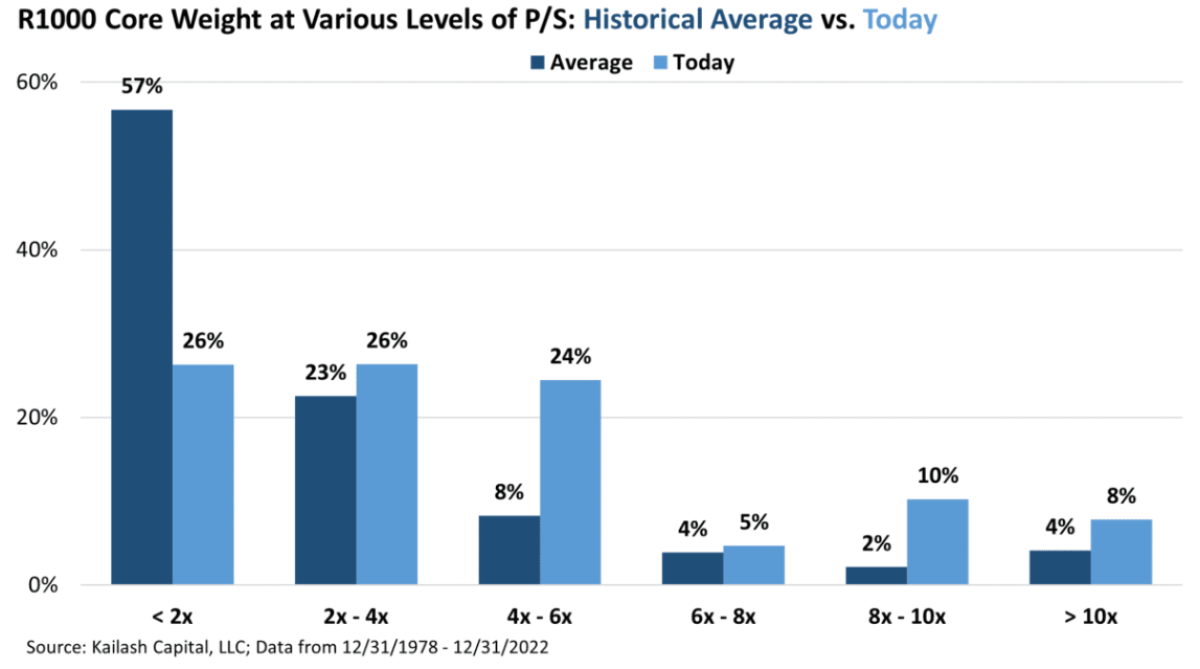
The chart below, from our piece pillorying Large Cap Core Indexes, updates the weighting of stocks over 10x price to sales in the Russell 1000 Index (right two most bars). While the weighting, like that in the S&P 500 above, has fallen sharply since publication, at 8% it is still twice the historical average!
The chart below updates the weighting of the 30 largest stocks in the Russell 1000 Growth Index. From our piece Large Cap Growth Index Funds & the Path to Poverty we marvel that people would ever invest in such a product.

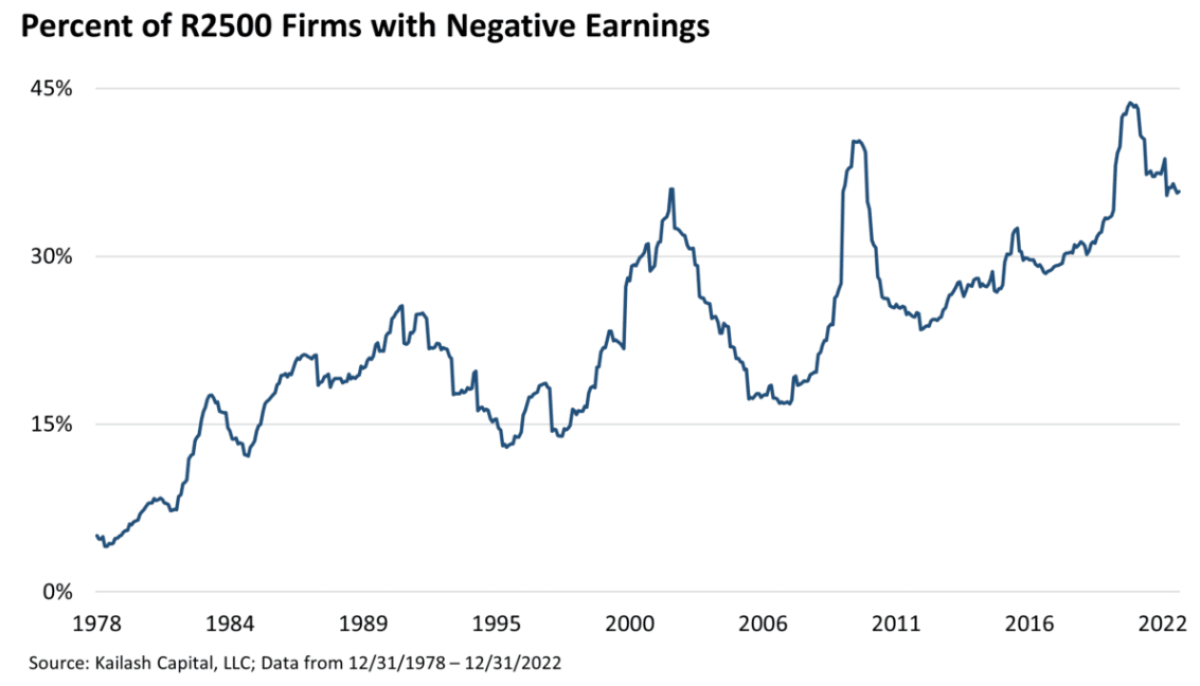
The chart below updates the percent of stocks in the Russell 2500 that are losing money from our post Vanguard Small Cap Index Fund: the Myth of Low-Cost Indexing. Again, WHY?
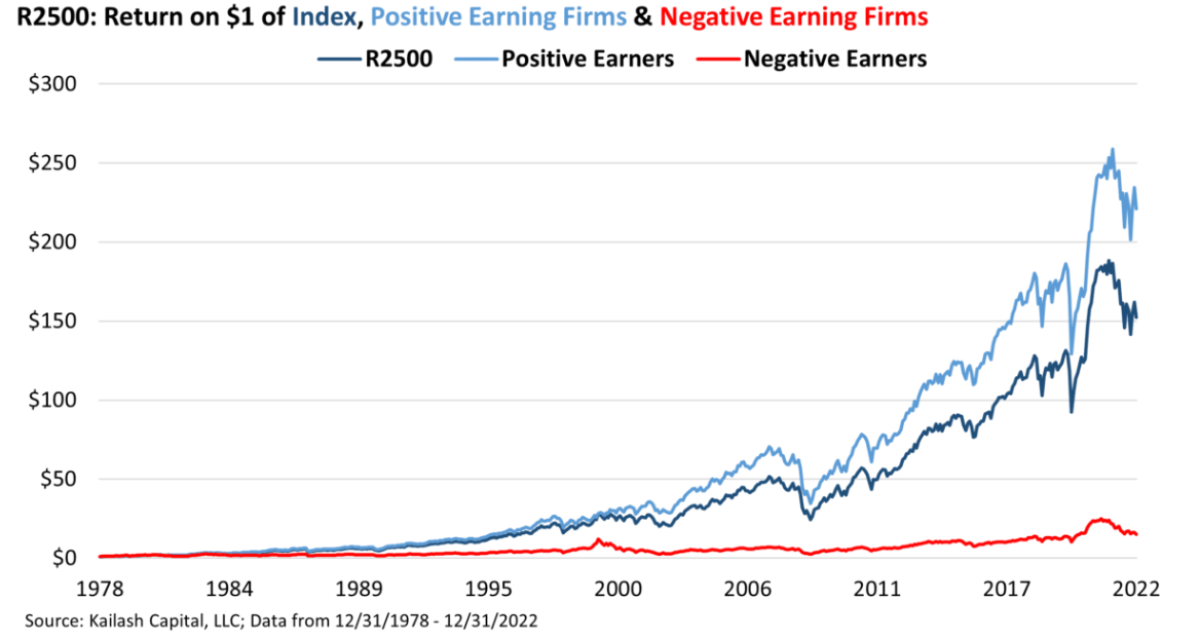
The chart below, updated from that same piece, shows the compound returns of money losers vs. the profitable stocks in the index. As we are fond of saying, we think this is not complicated. You can likely beat the index by merely working with a low-cost, active manager who omits the stocks of companies that lose money!
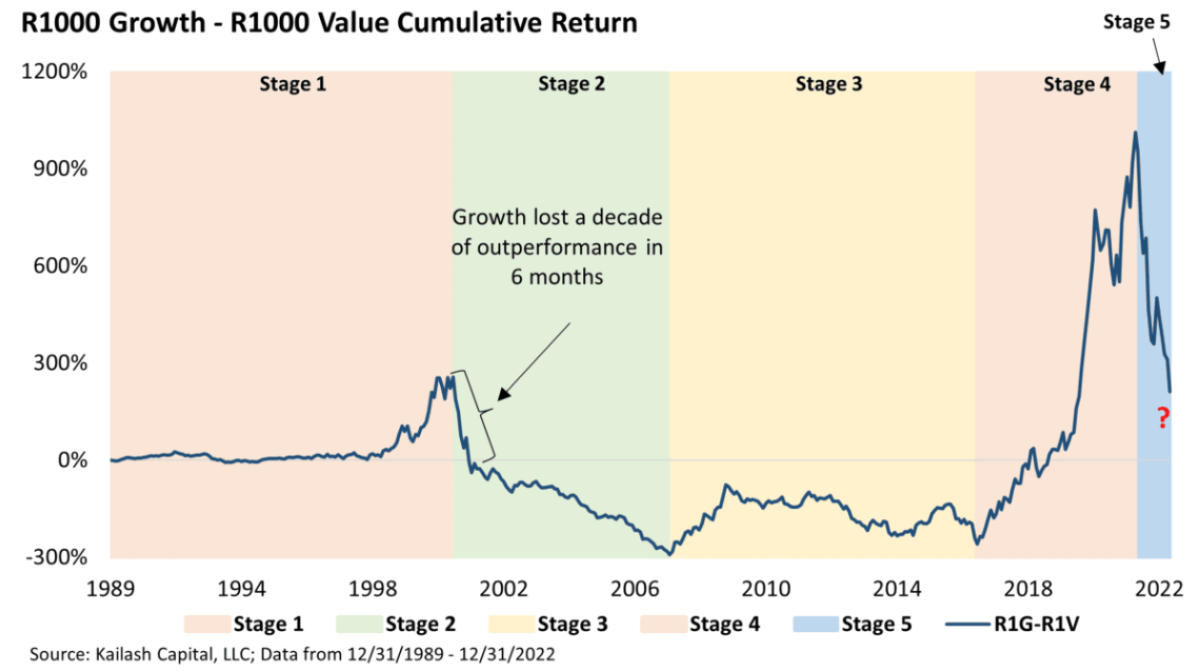
The chart below updates one of our most popular charts showing the compound returns to growth less the compound returns to value since 1989. Like every other chart you have seen so far, this one suggests that value may have a long way to go relative to growth.
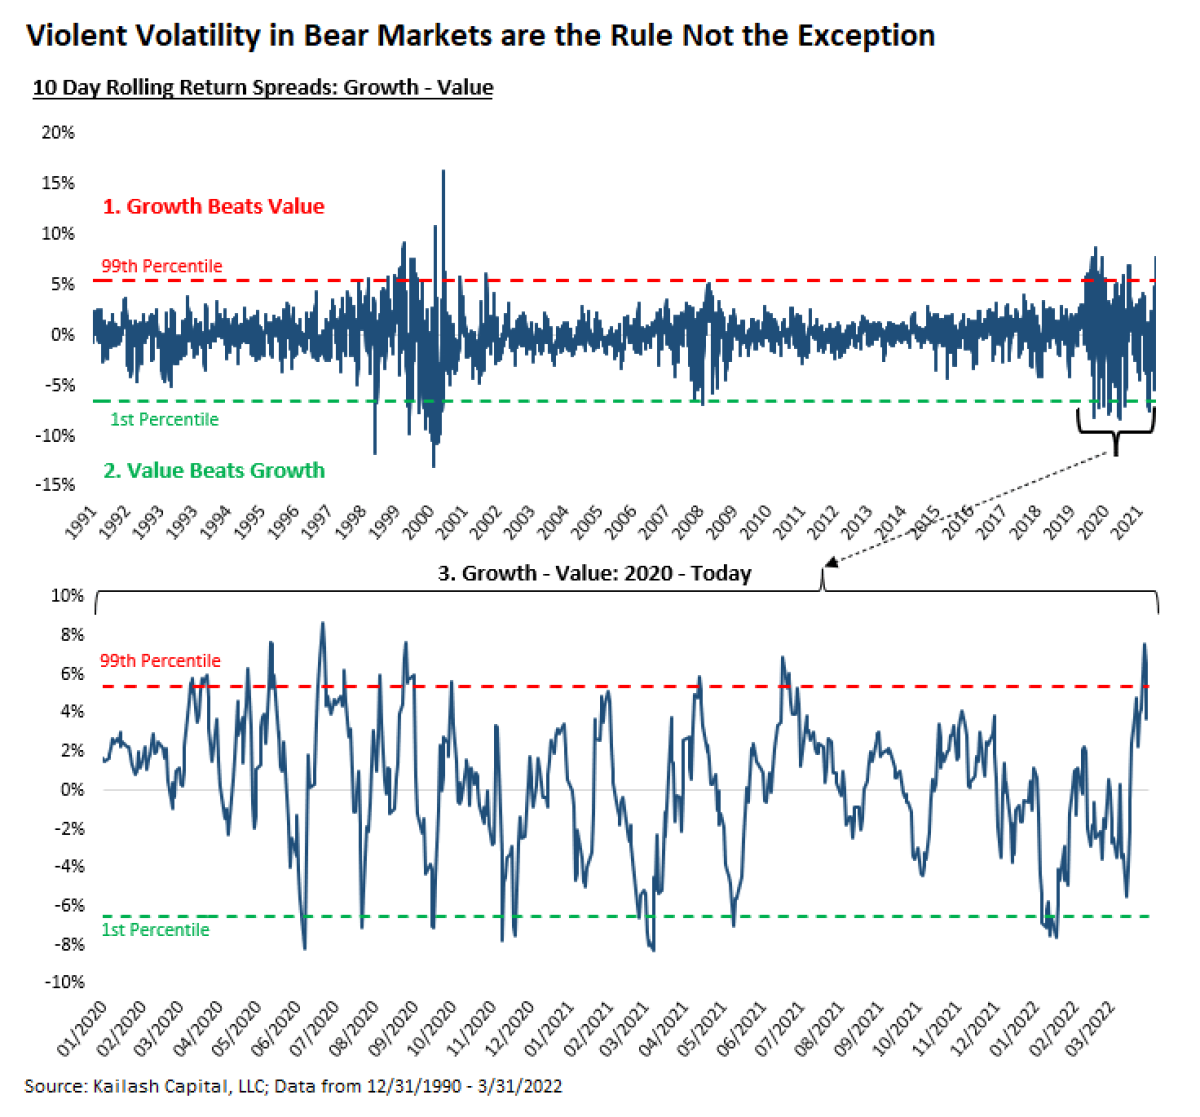
The below updates our work on the Anatomy of a Bear Market: Violent Volatility, which went out in early 2022. The point we made then was that when bubbles in growth stocks implode, there is a great deal of volatility between value and growth. This cycle, larger than the dot.com bubble, continues to produce enormous swings.
The next nine charts are updated from Part II of our 2022 Year in Review.
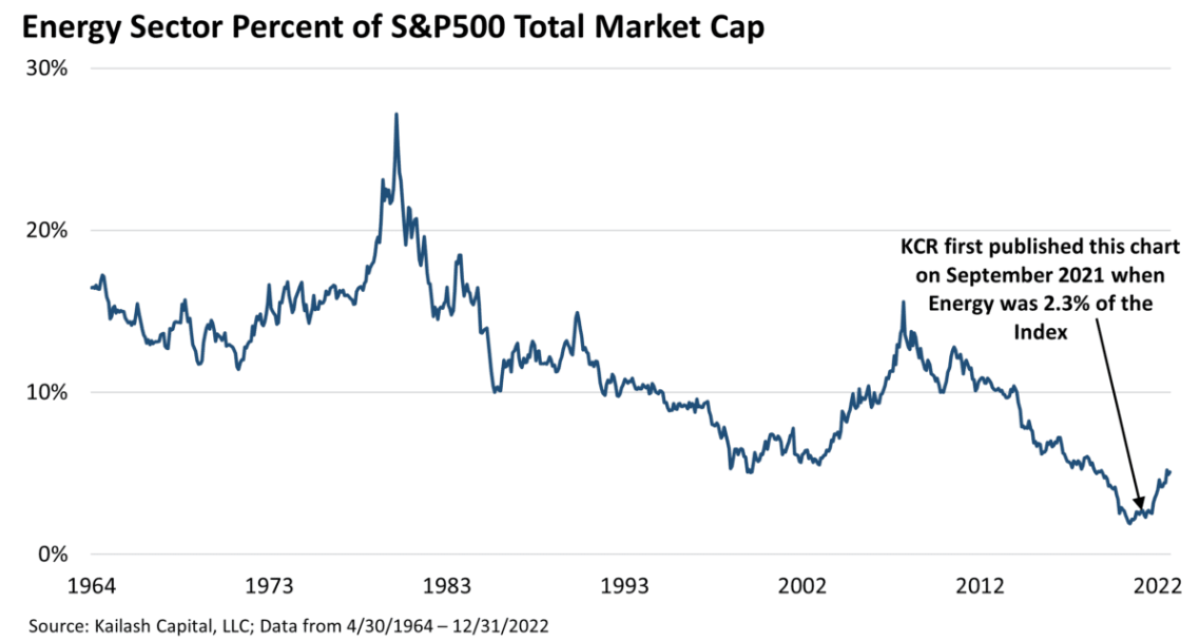
Updating a chart from our piece Undervalued Energy Stocks, the first chart below showed that by March of 2022, the Energy weighting in the S&P had indeed risen sharply since we became constructive on the sector, but was still near record lows. Fully updated through year-end, we would note that energy has a smaller weight in the S&P 500 than it did at the peak of the dot.com bubble.
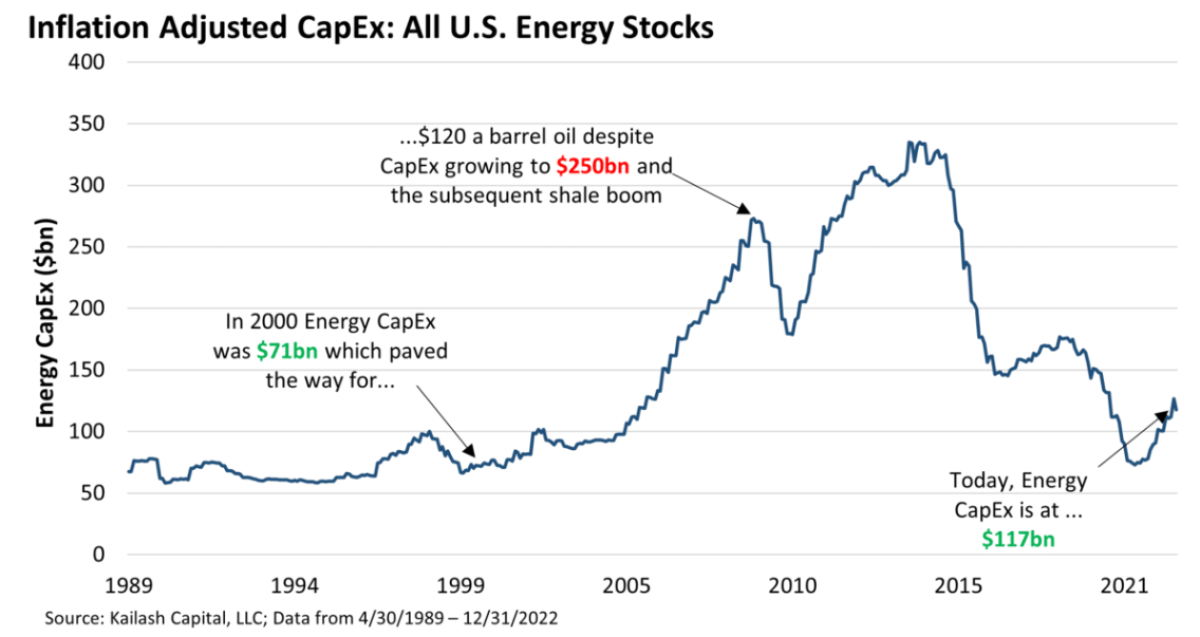
The chart below shows that capex was bouncing off levels last seen in 1999. Again, we would like to highlight that global GDP has exploded from $33 trillion at year-end 1999 to over $96 trillion in 2021. KCR fears that investors do not appreciate that energy extraction is largely a function of capital investment. Even with the chart updated and all the talk about energy prices, we can see that capex in the sector is still anemic.
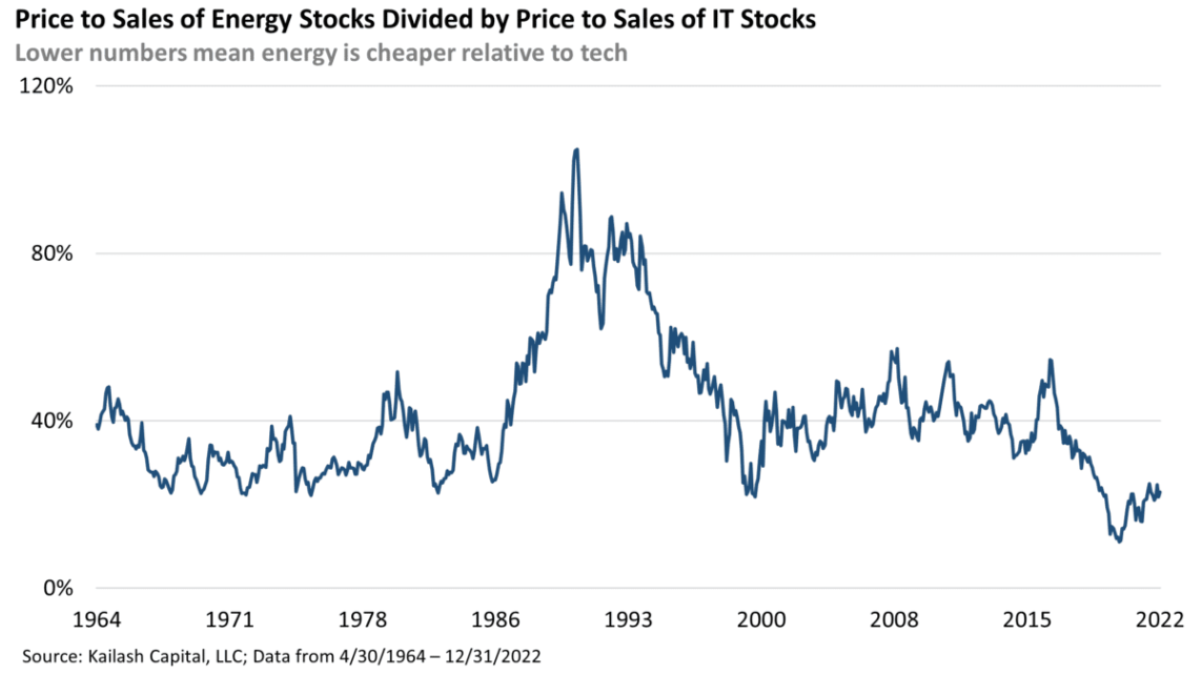
From our piece, Is it Too Late to Buy Oil Stocks, the updated chart below shows the price-to-sales ratio of energy divided by the price to sales ratio of tech (IT) stocks. We can see that valuations are still at record spreads. Unless it is different this time, tech valuations need to fall, energy valuations need to rise, or a bit of both needs to happen.
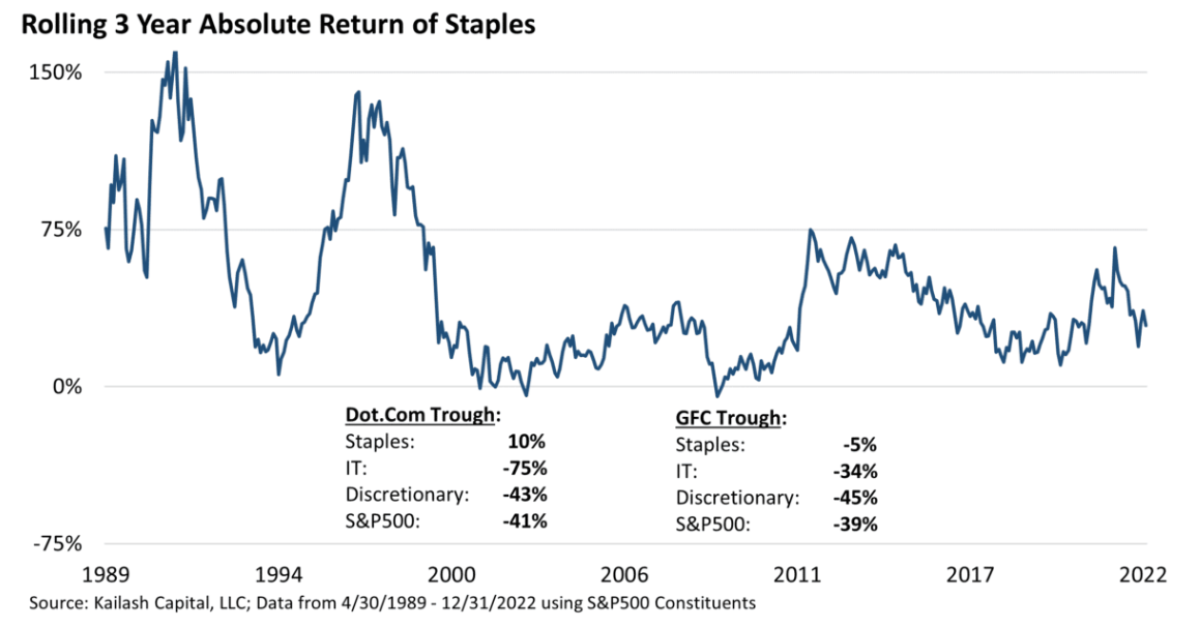
The below updates a chart from our piece Safe Dividend Stocks, showing that Consumer Staples stocks have only generated two negative absolute returns over any rolling three-year period in the last 30 years.
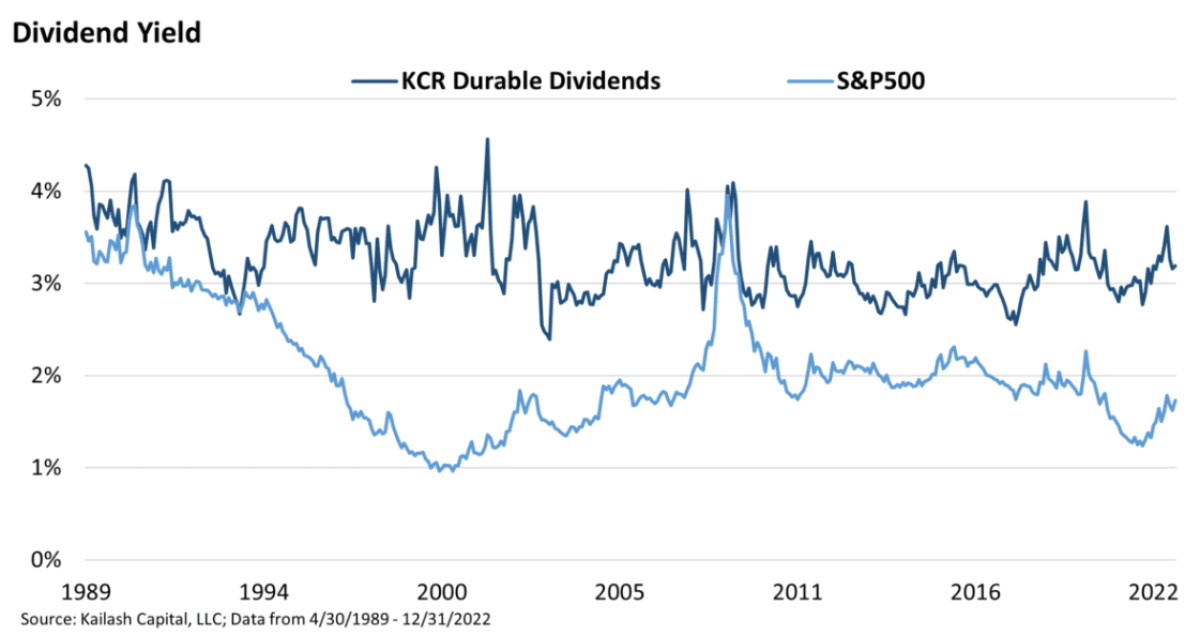
The chart below came from our piece, Inflation is Taxation without Legislation or Representation, which advocated for a group of stocks with robust balance sheets that were making payments to shareholders at levels far higher than the S&P 500.
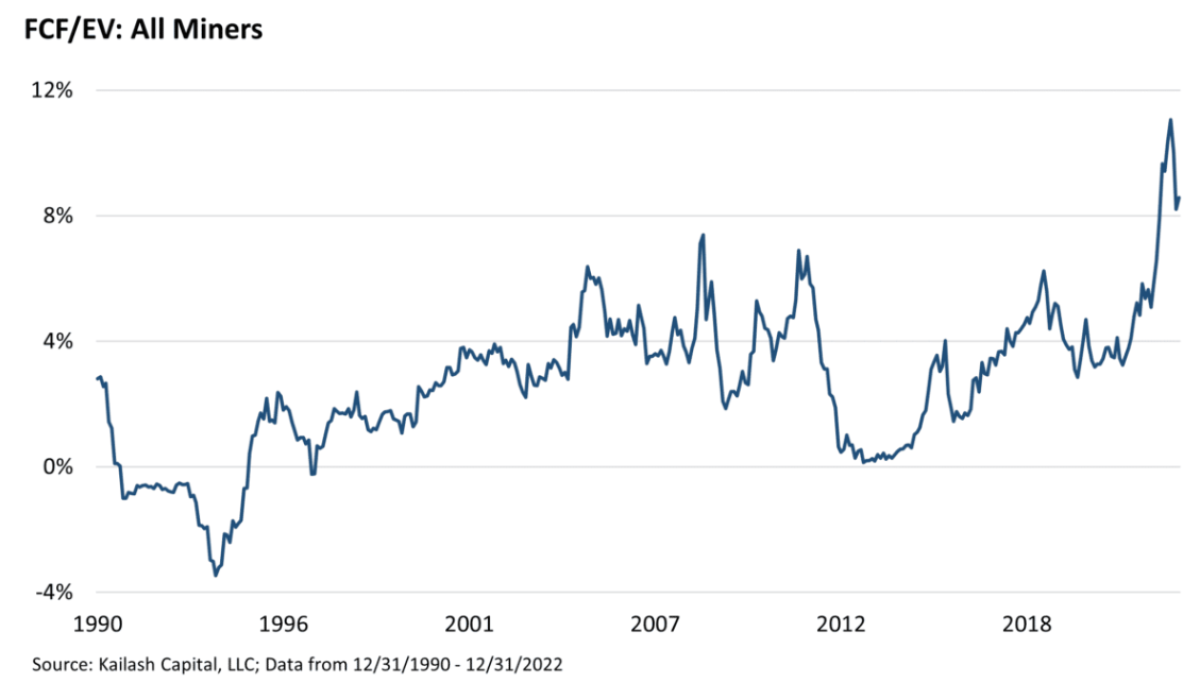
Building off our work, The Role of Critical Minerals in Clean Energy Transitions, the below updates a chart from The Mining Boom Nobody Believes. That piece explained that Metals & Mining stocks had never been cheaper in over 30 years. Fully updated, you can see that the summary point stands: nobody believes mining stocks’ fundamentals have any chance of persisting.
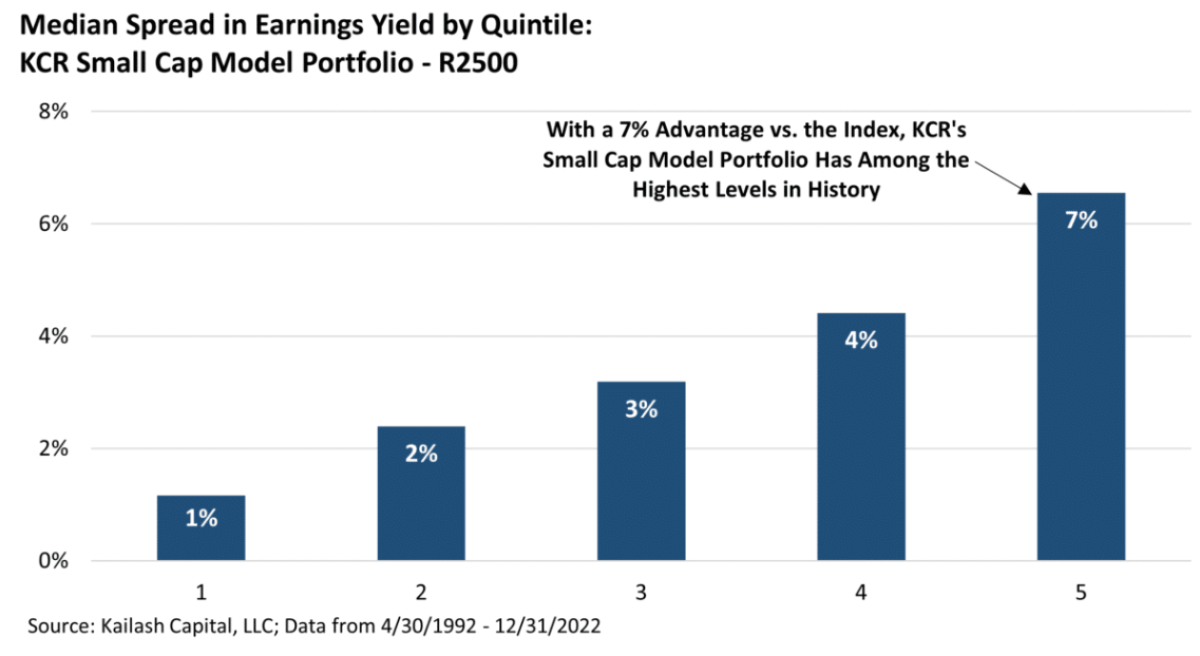
From our work Small Cap Quality Stocks: the Gift from the Index Fund Complex, the chart below shows the spread in earnings yield of small-cap stocks in KCR’s model portfolio compared to the index. In that piece we explained that KCR’s small-cap model portfolio is now in the fifth, or cheapest, quintile of history. Updated through year end, the circumstances have not changed and the opportunity continues to tantalize.
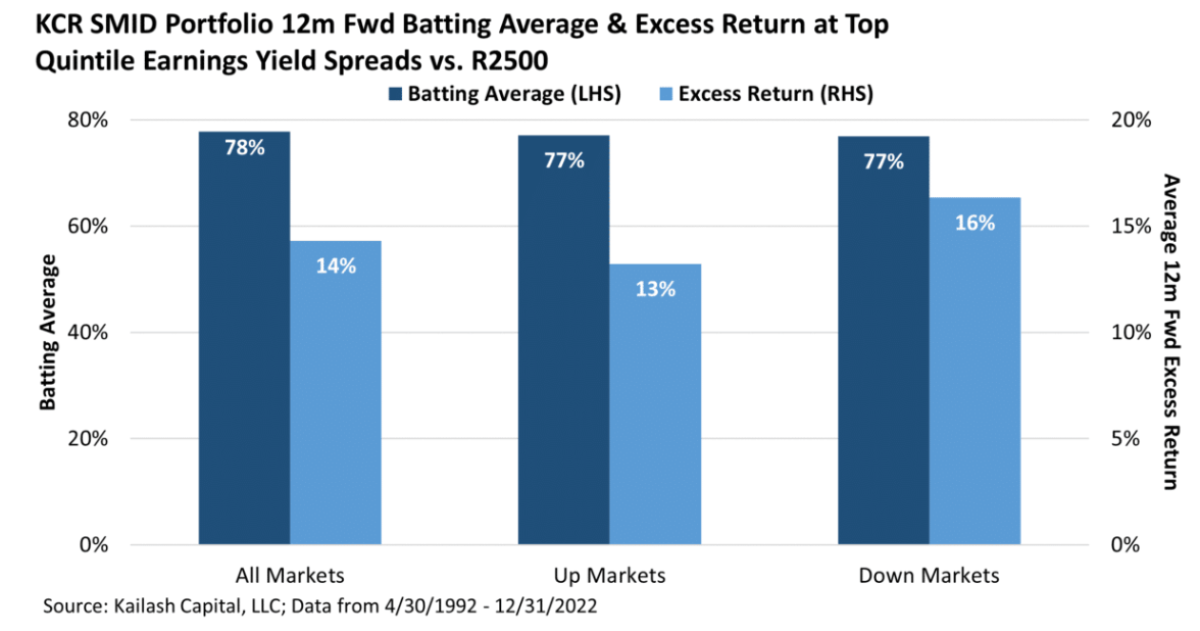
This matters because history is clear: cheapness, or value, works over the long haul. The chart below shows that investing in our KCR small cap model portfolio has generated terrific batting averages and excess returns whenever it has this much of a value advantage over the index. What’s remarkable is that the KCR model portfolio tends to win regardless of the market’s direction. So even if markets go down, you’ve historically lost a lot less money being in a portfolio like ours.
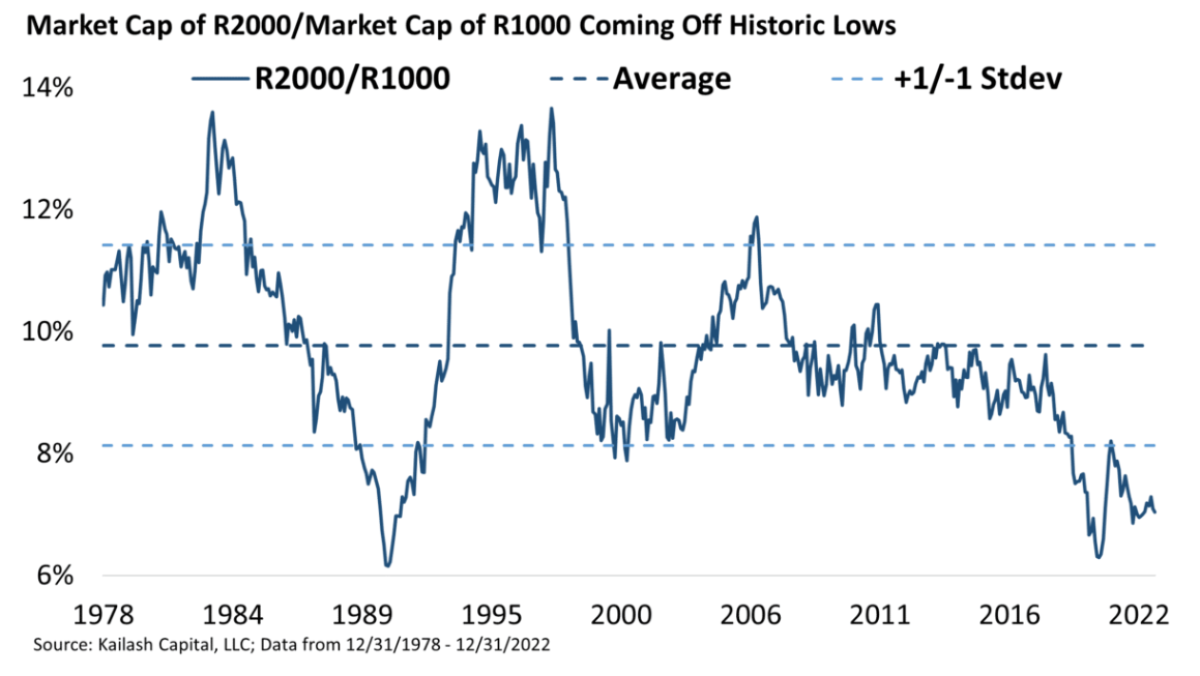
From our video on Small Cap Investing Strategies, the chart below updates the total market cap of the Russell 2000 divided by the total market cap of the Russell 1000. Small caps have less economic representation than at any time since 1989. A year that would mark a historic run of small caps relative to large caps. Our research suggests this is, once again, a generational opportunity to invest in smaller companies with massive potential to grow.
About the Authors:
Dr. Sanjeev Bhojraj
Co-founder of Kailash Capital
Sanjeev is a co-founder of Kailash Capital. He is also a portfolio manager and co-founder of L2 Asset Management. Dr. Bhojraj is widely published in the top journals in finance and accounting and specializes in behavioral finance. Dr. Bhojraj is also a Chaired Professor in Asset Management and the co-Director of the Parker Center for Investment Research at Cornell University’s Business School. Dr. Bhojraj has a Ph.D, ACA, ACMA, and B.Com.
John Durkin
Operations Officer
John is former head of Operations for Equity Research at Baird Kailash and Knight Capital Group. John is a graduate of Stonehill College and has passed his CFA Level I.
Matt Malgari
Co-founder of Kailash Capital
Matt is a co-founder of Kailash Capital. He is also a portfolio manager, Managing Member, and co-founder of L2 Asset Management. Matt spent 14 years at Fidelity working as an Assistant Portfolio Manager on the Diversified International Fund, sector analyst, diversified analyst, and trader. In 2010 Matt became the Managing Director of Equity Research for Knight Capital Group. Matt received his MBA from Cornell University and BA from Middlebury College and has used a quantamental approach to stock selection since the 1990s.
Nathan Przybylo
Quantitative Programming
A former associate at Beghou Consulting, Nathan received his MBA from Cornell University. He received a BS in Applied Mathematics from Northwestern University.
Kailash Concepts, LLC is the exclusive distributor of data analytics and research developed by Kailash Capital LLC, an unaffiliated registered investment advisor in Massachusetts.
As a reminder for our Financial Advisors: our models are available on a continuous basis, and most have been in production for over a decade. If you are looking for a simple, concentrated, low turnover, and hard-hitting GARP investing strategy, we would like to talk with you. Similarly, if you are looking for a model portfolio of the most proven and durable dividend payers that is simple to implement, please let us know. KCR also offers a wide range of easy-to-use but sophisticated tools like our Equity Duration product, which allows you to estimate a given portfolio’s interest rate and inflation risk. Over the last 12 years, KCR has built and offers time-tested and class-leading products built by experienced and proven money managers for fixed to low prices.
Kailash Capital’s sister company, L2 Asset Management, runs market neutral, long/short, large-cap, and mid-cap long-only portfolios with a value and quality bias. L2 employs a highly disciplined investment process characterized by moderate concentration, low turnover, high tax efficiency, and low fees. While nobody can predict the future, we believe the recent resurgence in risk-adjusted returns seen across all products is the beginning of what may be a long period where speculation is punished, and prudence and patience rewarded.