


By Dr. Philip Maymin, Director of Asset Allocation Strategies at Janus Henderson Investors, as well as Associate Professor of Analytics and MSBA Program Director at the Fairfield University Dolan School of Business.
We often talk about using sports-style data analytics to evaluate investor behavior. Here’s what happens when we apply our investment analytics to the National Basketball Association.
At Essentia, we often draw on insights from sports analytics to apply to our area of behavioral portfolio analytics. We generate the equivalent of baseball cards for our managers. We break overall performance into component skills for further analysis. We use metrics such as Hit Rate, analogous to a batting average, and Payoff, analogous to the slugging percentage.
But some of our insights do not map perfectly onto sports; even Payoff, which is the ratio of the average winner to the average loser, isn’t quite a slugging percentage, because the slugging denominator is all at-bats, not just outs.
So what if we go the other way and apply some of our definitions back to the sports world?
The 2020-2021 NBA playoffs are now underway. What would the league look like on the Essentia Behavioral Alpha Frontier?
Our frontier maps the Payoff vs. the Hit Rate. Usually we map different investing skills onto this frontier. For example, perhaps a portfolio manager’s stock picking skill has a low hit rate but a high payoff: they don’t always get it right, but when they do, they get it really right. Or perhaps their exit timing skill has a very high hit rate but a very low payoff: their exit timing is generally good, except for a few extreme cases. The Frontier allows different combinations of Hit Rate and Payoff to be compared directly in a single chart.
In the case of basketball, these metrics are something new and something old: Hit Rate is nothing more than the team’s winning percentage. For example, the Houston Rockets ended the season a 0.236, the lowest in the league. Payoff, however, is not normally a metric used in sports analytics. It is defined here by analogy to the portfolio perspective as the team’s average margin of victory when they win divided by their average margin of loss when they lose.
This raw payoff can range from zero to infinity. To put it on the same scale as hit rate, we can apply a logarithmic transform so it ranges from zero to one, which is what we do for our Frontier graphic.
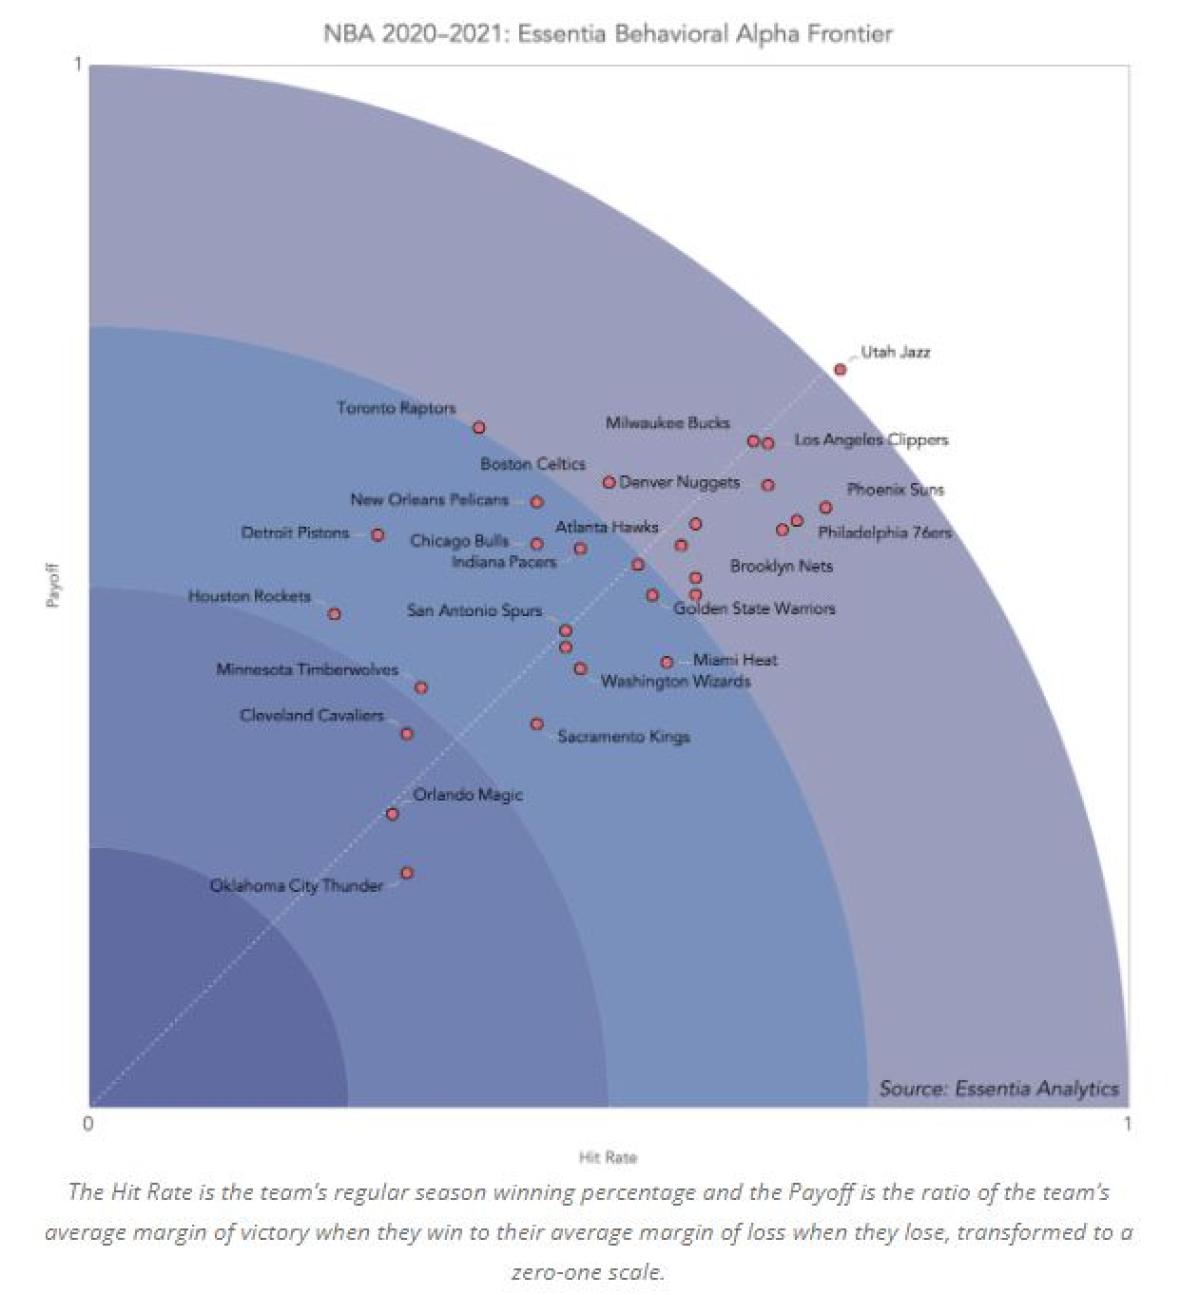
The Rockets and the Pistons are especially interesting. They have the two worst win-loss records in the league, but when they win, they tend to have some major blowouts, much more than the next four teams that have a better win-loss record than they do. In other words, they look like the worst, but they may be hiding upside, and all else being equal, may improve more next year than the Thunder, Magic, Cavs, and Wolves.
Of course, the Jazz are on another level entirely — they are quite literally off the chart!
If you follow the dotted white diagonal, there’s a sense in which we can say that teams to the right of that diagonal are relatively “lucky” in terms of their win-loss record when compared to their ratio of margin of victory to margin of loss. The Suns, Sixers, and Heat appear to be relatively “lucky” by this metric.
On the other side, the Toronto Raptors, in addition to the Rockets and Pistons, appear to be the most “unlucky,” in the sense that they lost more games than they probably should have. This interpretation of “lucky” or “unlucky” implies a variety of assumptions about the distribution of wins and talent and is merely suggestive rather than prescriptive, but it is worth noting that Toronto was the only team forced to play outside of its home market due to Canadian Covid-19 restrictions, they got ravaged by an outbreak of Covid-19 cases, and they ended up missing the playoffs for the first time in eight years.
Essentia is often inspired by advances in sports analytics, so it’s a pleasure to be able to return the favor!
About the Author:
Dr. Philip Maymin is the Director of Asset Allocation Strategies at Janus Henderson Investors, as well as Associate Professor of Analytics and MSBA Program Director at the Fairfield University Dolan School of Business. He is also the CTO for Swipe.bet, an instructor at Analytics.Bet, the co-founder and co-editor-in-chief of the Journal of Sports Analytics, the founding managing editor of Algorithmic Finance, and the co-founder and co-editor-in-chief of the Journal of Sports Betting. Dr. Maymin was formerly an Insight Partner with Essentia Analytics, working directly with portfolio managers to measurably improve their decision-making.
