


By Stephen L. Nesbitt – Chief Executive Officer, Chief Investment Officer of Cliffwater.
Alternative Investments Up 10% in Five Years; Shift to Private Alternatives
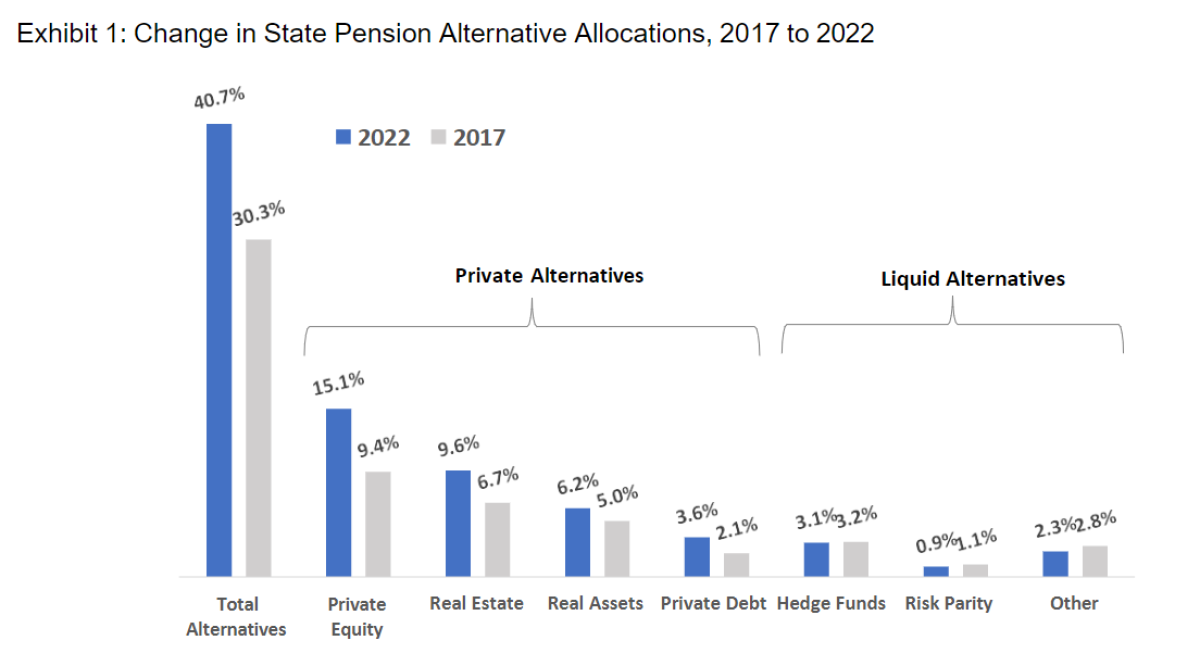
Allocations to alternatives have increased among all investor groups, but perhaps nowhere more than the $3 trillion state pension market, where alternatives increased a remarkable 10% in just the last five years, reaching 41% of total state pension assets as of June 30, 2022. However, not all alternative asset classes benefited. Those alternative asset classes relying upon the private markets (private equity, real estate, real assets, and private debt) rose 11% over the most recent five-year period while liquid alternatives (hedge funds, commodities, managed futures, risk parity, and other risk-mitigating strategies) fell -1%.
Liquid Alternatives Have Struggled to Meet Early Expectations
Institutional allocations to alternatives first jumped after the 2008 Financial Crisis as investors sought to de-risk their portfolios from large allocations to public equities. Liquid alternatives promising low equity correlations became fashionable, including hedge funds, commodities, risk parity and other risk-mitigating strategies. More than a few institutions created separate allocations to loosely defined Opportunity, Innovation, or Strategic investments with an emphasis on low equity correlation. Subsequent overall results from these liquid strategies have been mixed. Returns have been lower than expected while correlations have been higher than expected.
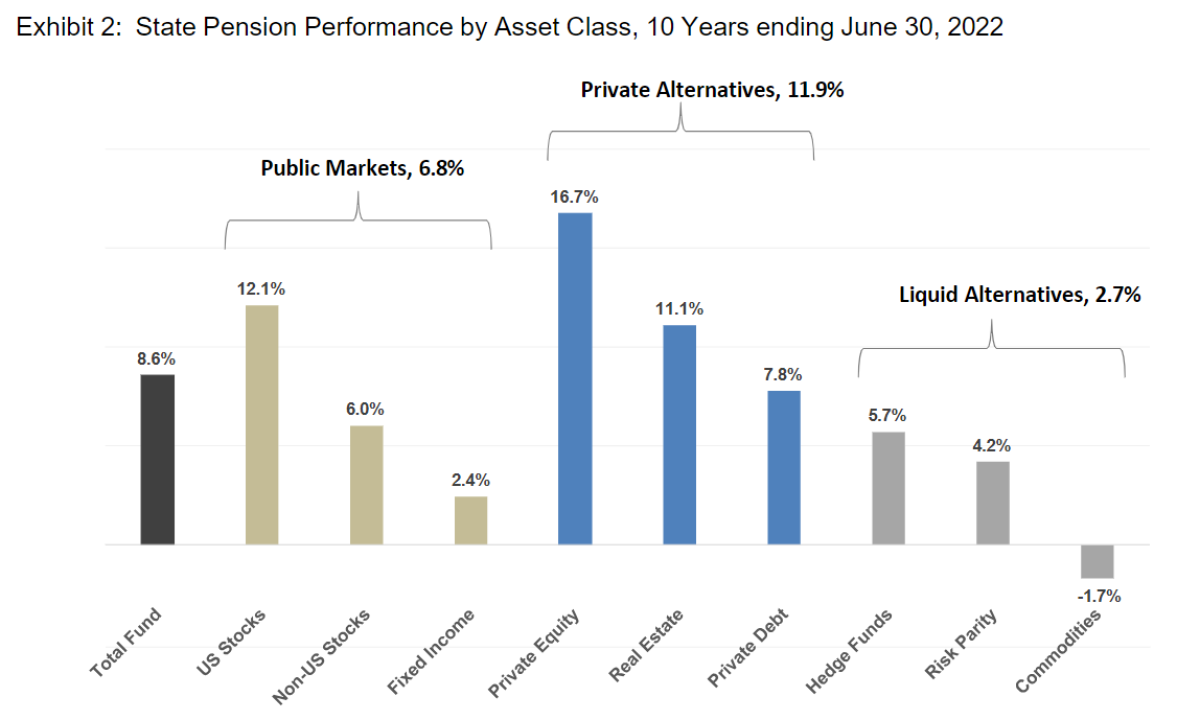
From a return perspective, the five-year institutional shift to alternative investments and private alternatives specifically may be largely explained by performance, as shown in Exhibit 2 for the 10-year period ending June 30, 2022. The 8.6% total state pension total return is broken down into public asset classes (averaging 6.8%), private alternatives (averaging 11.9%), and liquid alternatives (averaging 2.7%). Even if liquid alternatives reduce short-term risk, the give up in long-term return may be too high a price for institutions. From a risk perspective, liquid alternatives had mixed results over the last 10 years. Risk parity fell almost 20% in 2022, commodities fell almost 30% in 2015, and hedge funds provided only modest protection when stocks fell in 2016 and 2022.
Private Alternatives Deliver an Illiquidity Premium
The reallocation to private alternatives is a likely reflection of the higher returns from private asset classes over public asset classes, as shown in Exhibit 2 where private alternatives returned an annualized 5.1% above public asset classes (11.9% minus 6.8%) over the 10-year period. The emergence of private debt within institutional portfolios, while still at modest 3.6% allocation levels, has perhaps the greatest potential for growth because of its high and persistent yields and lack of interest rate risk.
About the Author:
Steve Nesbitt is the Chief Executive Officer and Chief Investment Officer of Cliffwater, and is primarily responsible for the day-to-day management of Cliffwater Corporate Lending Fund (CCLFX) and the Cliffwater Enhanced Lending Fund (CELFX), an SEC registered credit interval fund focused on the US corporate middle market.

Steve is recognized for a broad range of investment research. His papers have appeared in the Financial Analysts Journal, The Journal of Portfolio Management, The Journal of Applied Corporate Finance, and The Journal of Alternative Investments. His private debt research led to the creation of the Cliffwater BDC Index, measuring historical BDC performance, and the Cliffwater Direct Lending Index, measuring historical performance for direct middle market loans. Steve authored the book, Private Debt: Opportunities in Corporate Direct Lending, Wiley Finance (2019) which provides the analytical and empirical underpinnings of the private debt market.
Stephen L. Nesbitt snesbitt@cliffwater.com
The views expressed herein are the views of Cliffwater LLC (“Cliffwater”) only through the date of this report and are subject to change based on market or other conditions. All information has been obtained from sources believed to be reliable, but its accuracy is not guaranteed. Cliffwater has not conducted an independent verification of the information. The information herein may include inaccuracies or typographical errors. Due to various factors, including the inherent possibility of human or mechanical error, the accuracy, completeness, timeliness and correct sequencing of such information and the results obtained from its use are not guaranteed by Cliffwater. No representation, warranty, or undertaking, express or implied, is given as to the accuracy or completeness of the information or opinions contained in this report. This report is not an advertisement, is being distributed for informational purposes only and should not be considered investment advice, nor shall it be construed as an offer or solicitation of an offer for the purchase or sale of any security. The information we provide does not take into account any investor’s particular investment objectives, strategies, tax status or investment horizon. Cliffwater shall not be responsible for investment decisions, damages, or other losses resulting from the use of the information. Past performance does not guarantee future performance. Future returns are not guaranteed, and a loss of principal may occur. Statements that are nonfactual in nature, including opinions, projections, and estimates, assume certain economic conditions and industry developments and constitute only current opinions that are subject to change without notice. Cliffwater is a service mark of Cliffwater LLC.