


By Stephen L. Nesbitt – Chief Executive Officer, Chief Investment Officer of Cliffwater.
Alternative investments are fast-growing among wealth management, and vehicles that are perpetual by design are quickly replacing traditional private funds due to their enhanced investor protections, administrative convenience, immediate investment, and enhanced liquidity. These perpetuals include SEC-registered private BDCs, private REITs, interval funds, and tender funds, each with important differences, but collectively offering high-net worth investors a more convenient path to accessing alternative investments.
Private Debt Replaces Real Estate
In total, perpetuals grew from $42 billion to $184 billion in just over three years. However, as illustrated in Exhibit 1, growth was very uneven across the three major alternative categories: real estate, private debt, and private equity.
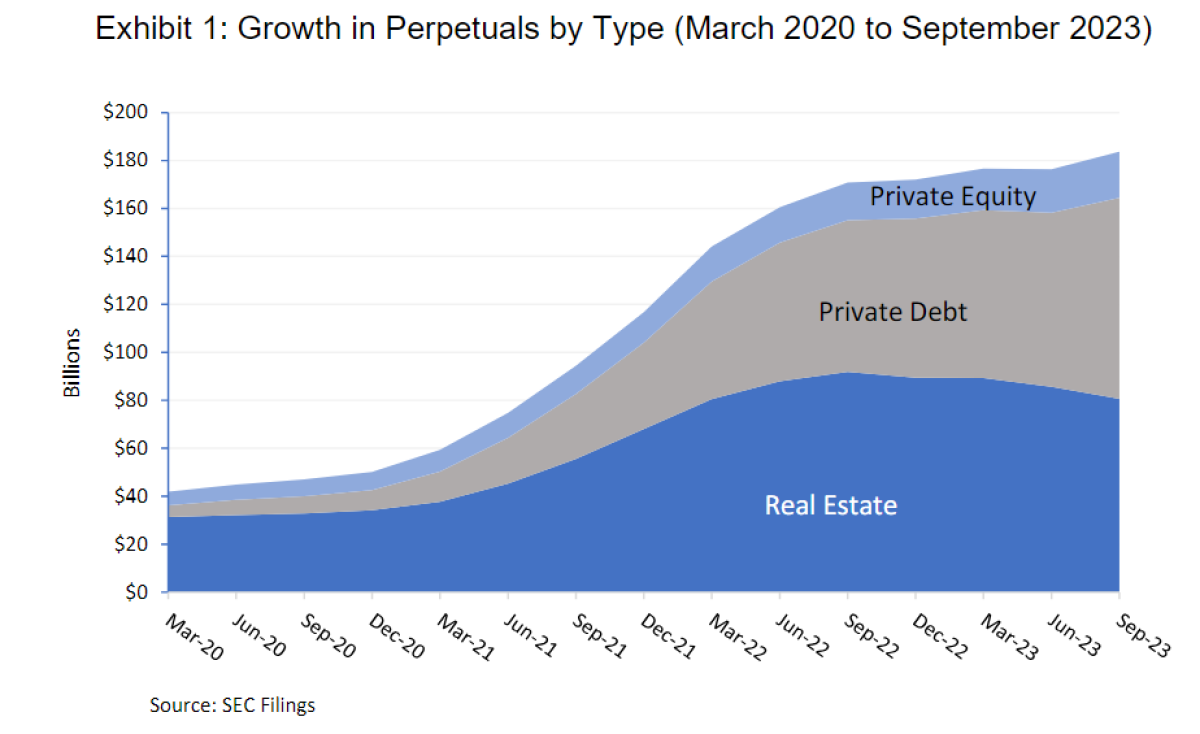
Real estate, consisting primarily of private REITs, saw significant growth until 2022 when valuation concerns led to net redemptions which have continued to this writing. Real estate perpetuals reached a 2022 asset peak of $92 billion but have since fallen to $80 billion. Thus far, the same valuation concerns have not attached to private equity or private debt. Private debt, specifically, has seen consistent growth in assets and is now the largest perpetual category with $84 billion in assets. The growth in private equity assets has been consistent, but well below private debt, reaching $19 billion on September 30, 2023.
What Happened to Real Estate?
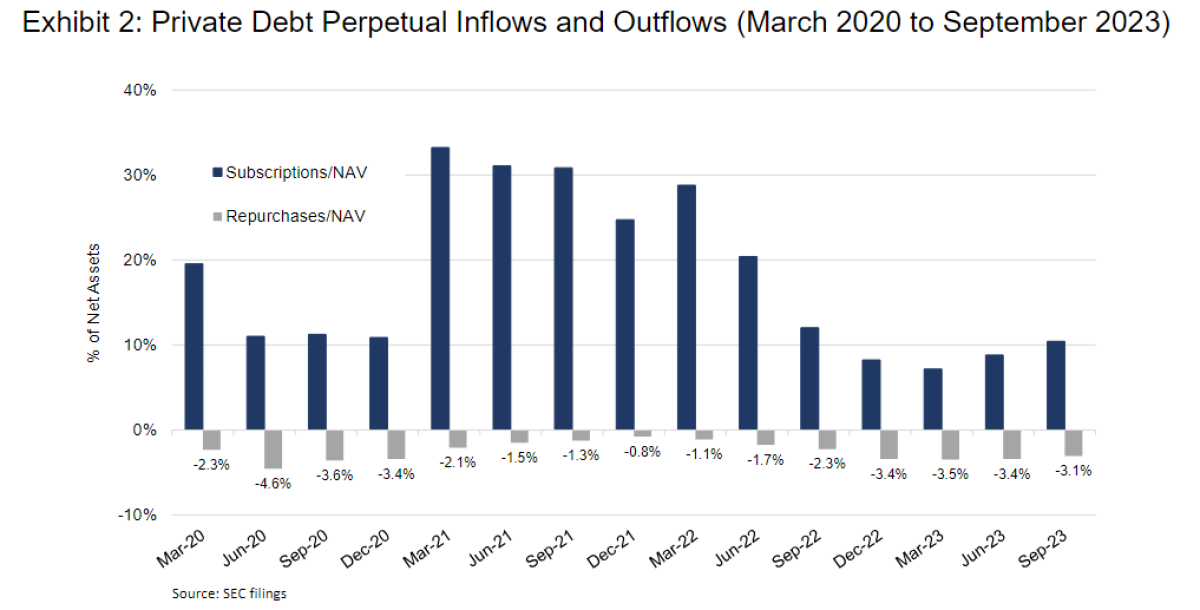
A major advantage of perpetuals is investor liquidity, typically up to 5% quarterly at the fund level. This should mean that investors should be able to get most, if not all, of their money out once a quarter. For example, Exhibit 2 reports collective quarterly inflows and outflows for private debt perpetuals. This illustrates a healthy condition where inflows exceed outflows and outflows are below the 5% quarterly maximum. Importantly, private debt remained healthy despite two “risk-off” time periods, COVID and the Russian Invasion.
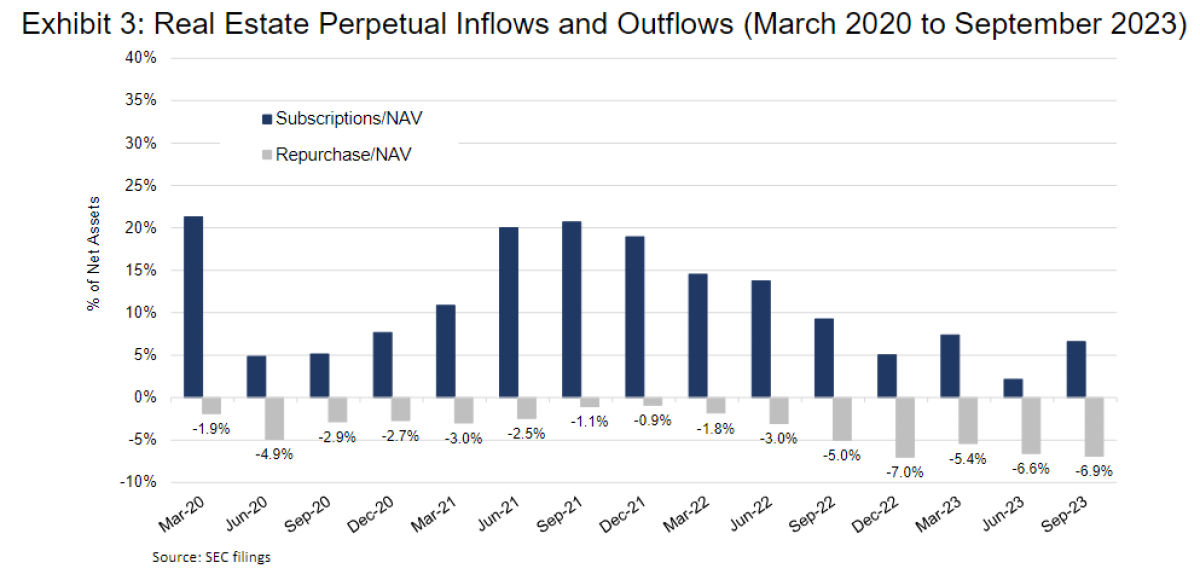
Real estate perpetuals, on the other hand, have struggled, as shown in Exhibit 3. Over the last five quarters investor redemptions (fund repurchases) have exceeded the 5% quarterly maximum, a condition called “proration1” where funds cut back investor redemption requests, pro rata, so as not to exceed the 5% fund maximum.
The reason real estate is in liquidation while private debt continues to grow is a fundamental difference in investor confidence in valuation. Real estate’s valuation problems go back decades and should not be a surprise.2 Historically, private real estate values begin a decline roughly one year after public REITs enter a bear market and that their lowest valuation occurs roughly one to two years after public REITs find their peak drawdown.3 These historical patterns point to significant overvaluation in private real estate for up to two years after public REITs enter a drawdown.
Exhibit 4 uses the 2008 Financial Crisis experience to illustrate the valuation problem with private real estate while comparing its experience to private debt and private equity.
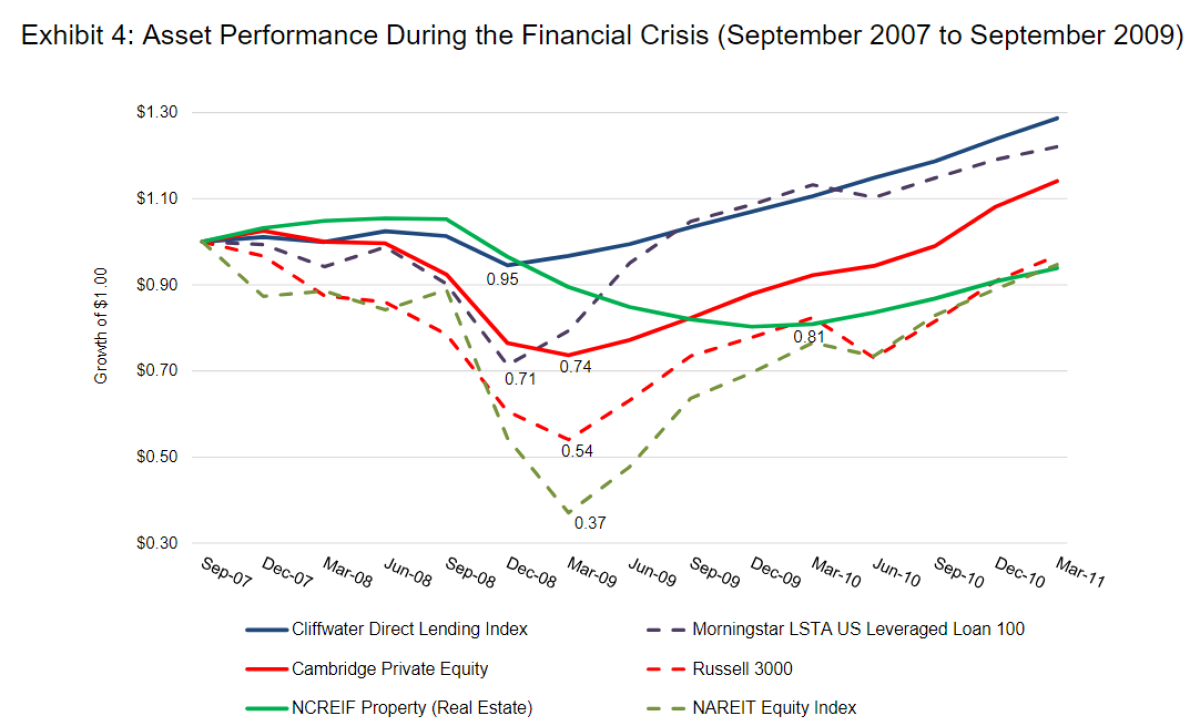
Exhibit 4 covers the Financial Crisis drawdown and recovery from September 30, 2007, to March 31, 2011. Three private asset class cumulative returns are plotted using solid lines: (1) private debt (Cliffwater Direct Lending Index), (2) private equity (Cambridge Private Equity), and (3) private real estate (NCREIF Property Index). Each of the three private asset classes has a public market equivalent, plotted by dashed lines in Exhibit 4: (1) the Morningstar LSTA US Leveraged Loan 100, (2) the Russell 3000, and (3) the NAREIT Equity Index.
Private Debt
Private debt follows a rational pattern relative to its public equivalent, the Morningstar LSTA US Leveraged Loan Index. First, both the private and public debt begin and end their downturns in the same quarters (Q3 2008 and Q4 2008). Second, the gap between private and public index valuations is significant but short-lived, closing three quarters after the drawdown. The gap in drawdowns is to be expected as the public markets trade down more, reflecting the cost of liquidity. Private assets, however, do not trade.
Private Equity
Private and public equity begin their downturns one quarter apart, in Q4 2007 and Q1 2008, respectively. However, like public and private debt, their downturns end in the same Q1 2009 quarter. The public and private gap in drawdown is about the same as for public and private debt but does not close during the period covered. The public-private convergence should be more powerful for debt due to the pull-to-par phenomenon.
Private Real Estate
Private real estate behavior during the Financial Crisis departs significantly from private debt and private equity. First, the private real estate drawdown begins four quarters after the public real estate drawdown begins. Second, the private real estate drawdown ends three quarters after the public real estate drawdown ends. Third, the private-public real estate valuation gap is twice the gap for private debt and private equity and takes four quarters to close.
The price behavior of private versus public markets during the Financial Crisis would likely provide private market investors with high confidence in private debt valuation, moderate confidence in private equity, and weak confidence in private real estate. Memories can be short, but likely not short enough to cause real estate investors to forget the significant lagged valuations in private real estate and, in turn, causing high redemptions and proration among private REITs.4
Exhibit 5 examines private and equivalent public asset class returns in 2022 through September 2023.5
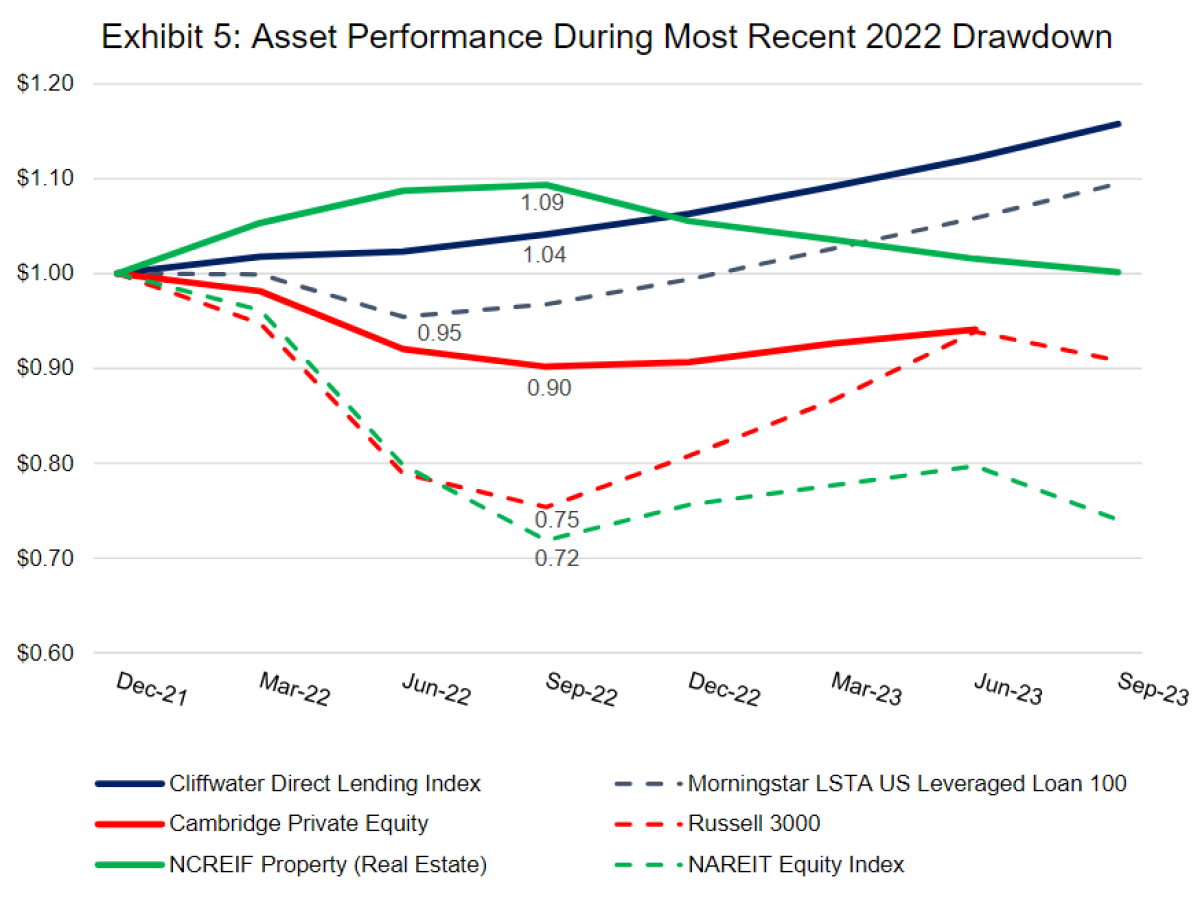
Private Debt
The private-public return pattern for debt is not concerning. The 5% price gap is largely explained by yield differences and is far less than the 24% price gap during the Financial Crisis.
Private Equity
The private-public return pattern for equity parallels that of the Financial Crisis, though the drawdown is lower. The private and public equity drawdowns begin and end in the same quarters and private-public equity valuations hit convergence three quarters after the peak drawdown, far better than the Financial Crisis.
Private Real Estate
While private-public valuations for debt and equity follow or improve upon Financial Crisis patterns, real estate private-public valuations are more concerning. One positive is that the private real estate drawdown began three quarters after the public real estate drawdown, which is one quarter earlier that during the Financial Crisis. On the other hand, the public real estate drawdown ended four quarters ago while private real estate values are still falling. By comparison, private real estate declines ended three quarters after public real estate declines ended during the Financial Crisis. Finally, the private-public valuation gap remains by far the largest for real estate compared to debt and equity.
What’s Next for Perpetuals
Perpetuals should expect accelerated growth for several reasons, particularly in the wealth management channel.
1. The push to add alternatives to high-net worth portfolios is only growing.
2. The administrative convenience and allocation flexibility of perpetuals is significant and only beginning to be understood.
3. Perpetual launches by larger and well-managed firms will accelerate.
4. Private equity perpetuals will likely see increased growth with new offerings by established alternative investment firms.
5. Daily valuation and trade execution across perpetuals will further interest within the wealth management channel and beyond.
Footnotes:
1 Proration occurs when investor demand for fund liquidity exceeds specified limits. For example, take a fund that offers quarterly
redemptions subject to a 5% fund-level limit, not an individual-level limit. If, collectively, investors redeem 5% or fewer of outstanding shares then all investors that requested liquidity will get all their requested money out of the fund. If investors collectively request more than 5%, say 10%, then a rationing process occurs – aka proration – wherein each investor requesting redemption receives the same fractional amount of liquidity, 5/10ths or 50% of requested amount, in our example.
2 See, for example, Cliffwater research paper, “Forecasting Risk for Illiquid Asset Classes, October 2019.”
3 Based upon major real estate recessions starting in December 1989 and March 2007.
4 The Cambridge Private Equity return is not available for Q3 2023.
About the Author:
Steve Nesbitt is Chief Executive Officer and Chief Investment Officer of Cliffwater, and is primarily responsible for the day-to-day management of Cliffwater Corporate Lending Fund (CCLFX) and the Cliffwater Enhanced Lending Fund (CELFX), an SEC-registered credit interval fund focused on the US corporate middle market.

Steve is recognized for a broad range of investment research. His papers have appeared in the Financial Analysts Journal, The Journal of Portfolio Management, The Journal of Applied Corporate Finance, and The Journal of Alternative Investments. His private debt research led to the creation of the Cliffwater BDC Index, measuring historical BDC performance, and the Cliffwater Direct Lending Index, measuring historical performance for direct middle market loans. Steve authored the book, Private Debt: Opportunities in Corporate Direct Lending, Wiley Finance (2019) which provides the analytical and empirical underpinnings of the private debt market.
.
Stephen L. Nesbitt snesbitt@cliffwater.com
The views expressed herein are the views of Cliffwater LLC (“Cliffwater”) only through the date of this report and are subject to change based on market or other conditions. All information has been obtained from sources believed to be reliable, but its accuracy is not guaranteed. Cliffwater has not conducted an independent verification of the information. The information herein may include inaccuracies or typographical errors. Due to various factors, including the inherent possibility of human or mechanical error, the accuracy, completeness, timeliness and correct sequencing of such information and the results obtained from its use are not guaranteed by Cliffwater. No representation, warranty, or undertaking, express or implied, is given as to the accuracy or completeness of the information or opinions contained in this report. This report is not an advertisement, is being distributed for informational purposes only and should not be considered investment advice, nor shall it be construed as an offer or solicitation of an offer for the purchase or sale of any security. The information we provide does not take into account any investor’s particular investment objectives, strategies, tax status or investment horizon. Cliffwater shall not be responsible for investment decisions, damages, or other losses resulting from the use of the information. Past performance does not guarantee future performance. Future returns are not guaranteed, and a loss of principal may occur. Statements that are nonfactual in nature, including opinions, projections, and estimates, assume certain economic conditions and industry developments and constitute only current opinions that are subject to change without notice. Cliffwater is a service mark of Cliffwater LLC.