


By Paul Kenney, CFA, SVP – Client Solutions, and Jake Goldstein, Analyst at Syntax Data.
Summary
Geographic diversification across major benchmark indices may be insufficient to ensure that a portfolio is sector-risk averse.
Following the 2022 tech stock sell-off, the U.S. market, represented by the S&P 1500 Index, still has substantial exposure to the sector. As of 30 June 2023, the Index’s total tech exposure, based on Syntax’s classification methodology, is 40%, which is significantly higher than the 27% reported by S&P for the Information Technology sector.
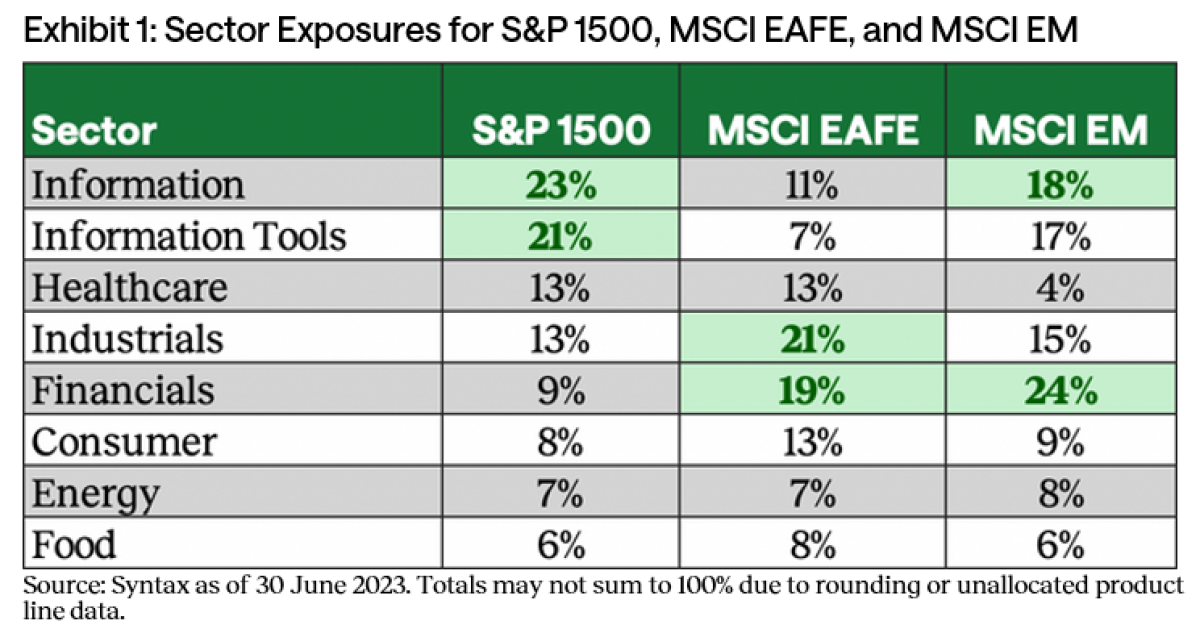
The International Developed ex-U.S. market, represented by the MSCI EAFE Index, has significant allocations to the Industrials (21%) and Financials (19%) sectors. MSCI EAFE also has the largest allocation to the Consumer sector (13%) across the three market categories.
Emerging markets, represented by the MSCI Emerging Markets Index, is overweight Financials (24%), with Banking (17%) as the largest component. Tech exposure (34%) also poses a potential concentration risk.
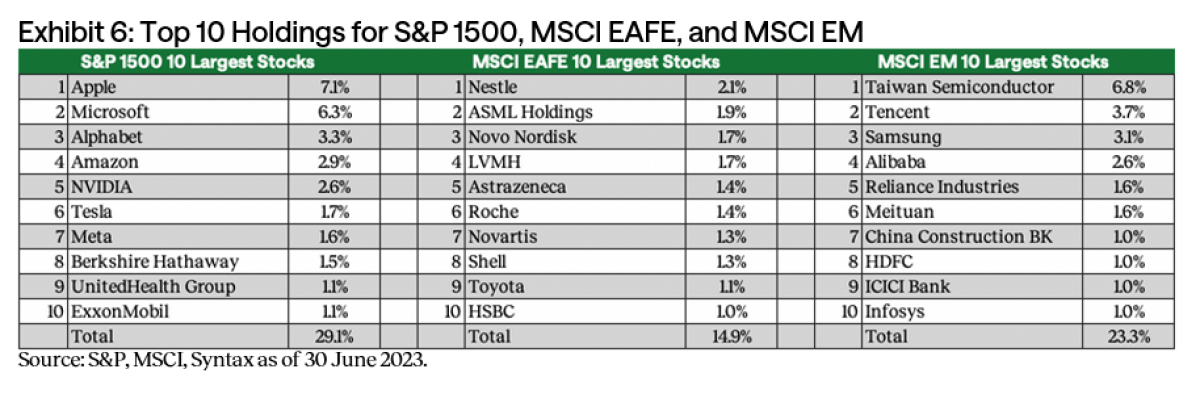
Based on total top 10 holding weights, both the S&P 1500 (29%) and MSCI EM (23%) indices face potential single stock concentration risk.
Introduction
It is common practice for public equity investors to allocate assets across the U.S., international developed, and emerging markets to pursue geographic diversification. Geopolitical and macroeconomic factors are often considered in determining asset allocation, but what tends to be overlooked is each market’s contribution to a portfolio’s sector and thematic exposures — an important element for diversification-minded investors. However, even investors who are attuned to these factors face challenges with existing industry classification systems. These systems fail to recognize that most companies today have multiple product lines or individual product lines that span multiple sectors. As a result, the true extent of sector risk concentration in major geographic indices is unclear. For example, well-documented cases of concentration risk, such as tech in the U.S. market, may be more underestimated than predicted.
In this paper, we leverage Syntax’s Functional Information System (FIS®), our proprietary industry classification framework, and the Affinity® platform, a web-based user interface for accessing FIS data, to analyze the sector and thematic exposures of three well-known, geographic indices.
A Deeper Look at Sector Exposures¹
Exhibit 1 shows the primary sector exposures of the S&P 1500, MSCI EAFE, and MSCI Emerging Markets indices based on FIS product line classifications. The product lines of each underlying company in the three indices are categorized into individual sectors, unlike the long-standing, industry practice of grouping all of a company's product lines into one sector based on its primary business segment. The two largest exposures for each index are highlighted in green.
Sizing Up the Exposure to the Financials Sector
Both MSCI EAFE (19%) and MSCI EM (24%) have large allocations to the Financials sector, with the latter having the largest percentage exposure to a single sector across the three representative indices. Based on the FIS framework, the three main segments of the Financials sector are Banking, Insurance, and Real Estate. Exhibit 2 highlights the weights of these segments and their respective subgroupings. The values highlighted in green show the industries where the MSCI EAFE and EM weightings are 2% or more than those for the S&P 1500.
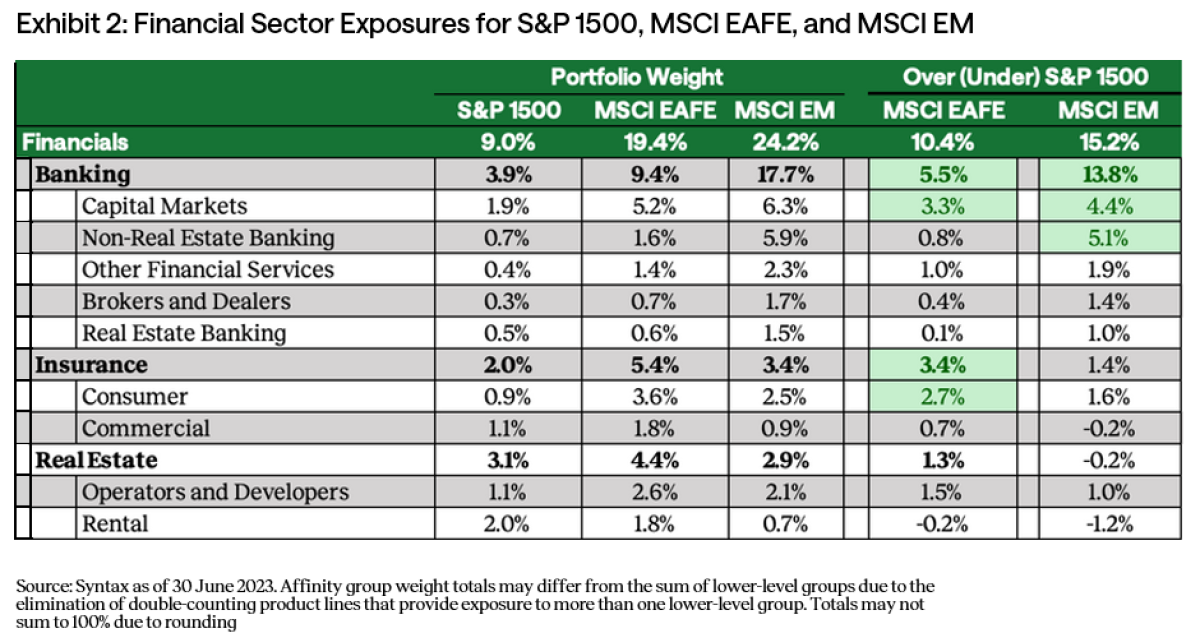
The analysis reiterates the extent of MSCI EM’s concentration risk from the Financials sector:
The argument can be made that the MSCI EM and MSCI EAFE’s overall exposure to Banking and Financials provides diversification benefits that may offset the S&P 1500’s relatively smaller exposure. However, the Financials sector, and particularly the Banking segment, can be prone to contagion risk. Investors who take a top-down view of geographic diversification should be aware of inherent risks, including the possibility that nearly 25% of their emerging markets exposure may consist of financial companies with a tilt to banking.
A Closer Look at the Exposure to Technology
According to published reporting standards, the S&P 1500 and MSCI EM, which utilize the GICS industry classification system, both have over 20% exposure to the Information Technology sector.² However, when the indices are analyzed through Syntax’s Technology Lens³ in Affinity, their technology exposure is even higher: 40% for the S&P 1500 and 34% for MSCI EM, with large concentrations in hardware and software companies for both indices. Exhibit 3 breaks down the types of tech-focused product lines of the constituents in each index. Shown in the two far-right columns are the weights of these product lines in MSCI EAFE and MSCI EM relative to the S&P 1500. Differences of greater than -2% and 2% are highlighted respectively in red and green.
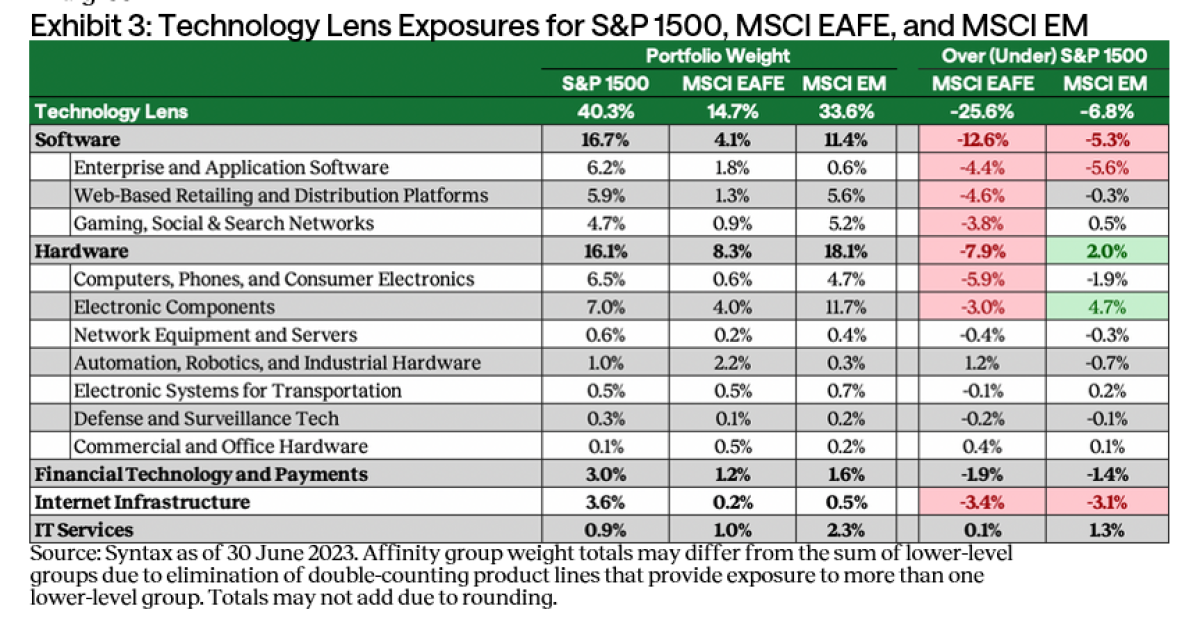
The difference in the technology exposure between the S&P 1500 (40.3%), MSCI EAFE (14.7%), and MSCI EM (33.6%) is striking, particularly in the Software category.
Like Software, the three indices have a high concentration of companies with Hardware product lines: 16.1% for the S&P 1500, 18.1% for MSCI EM, and 8.3% for MSCI EAFE. Notable observations about the indices’ exposure to Hardware include:
Based on the examples and observations above, it is evident that investors who rely on broad market indices like the three highlighted for geographic diversification could still encounter material concentration risks within the tech sector. In particular, they should consider how certain tech companies outweigh entire sectors. For example, Apple accounts for 7.1% of the S&P 1500, exceeding the 6% total weight of the Food sector. Taiwan Semiconductor Manufacturing comprises 6.8% of MSCI EM, which is larger than the Index’s 4% exposure to the Healthcare sector.
Analyzing Allocations to Industrials
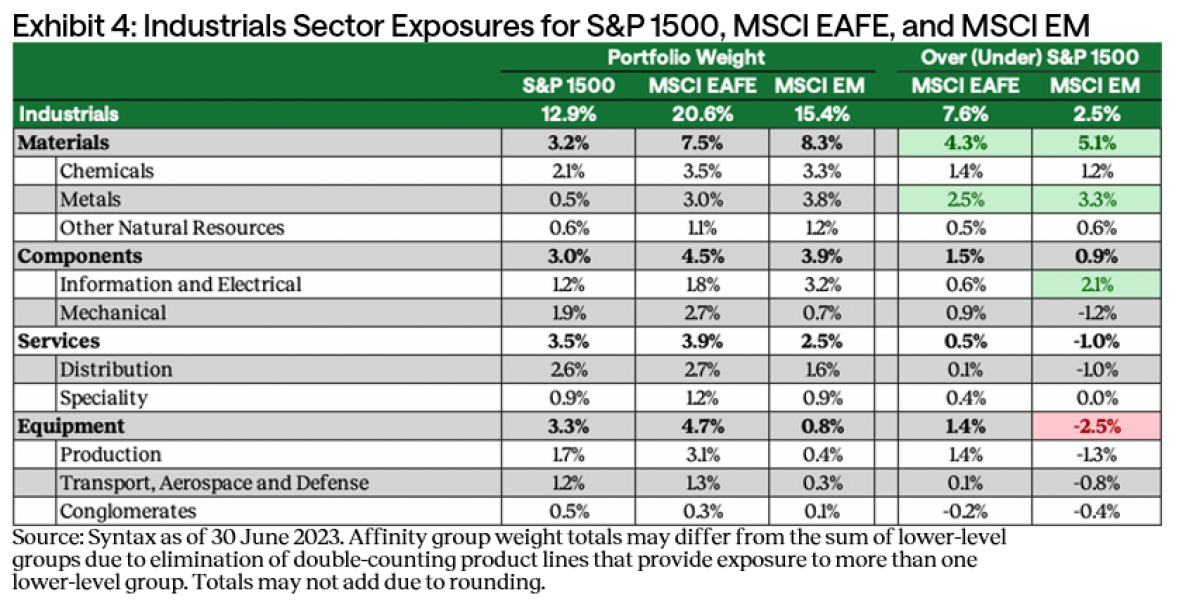
Besides Financials and Technology, the three indices also have substantial exposure to the Industrials sector, which is also MSCI EAFE’s largest primary sector (20.6%). Investors are likely to be particularly interested in the Materials category, which includes Chemicals, Metals, and Other Natural Resources — a product line that is often considered an inflation hedge. While MSCI EAFE’s total allocation to Industrials is higher than MSCI EM’s (15.4%), the latter has a larger allocation to Materials at 8.3% versus 7.5% for MSCI EAFE.
In Exhibit 5, we analyzed the exposure to the Materials sub-sector, applying the Affinity Commodities Lens to each index’s holdings. Similar to the Technology Lens, the Commodities Lens looks across sectors, identifying pure commodity exposure as well as companies that are part of the commodity supply chain. For example, the Lens pinpoints crude oil producers in the Energy sector alongside conglomerates in Industrials that manufacture drilling equipment – companies that are categorized into different sectors by traditional classification systems but that are similarly exposed to commodity price volatility.
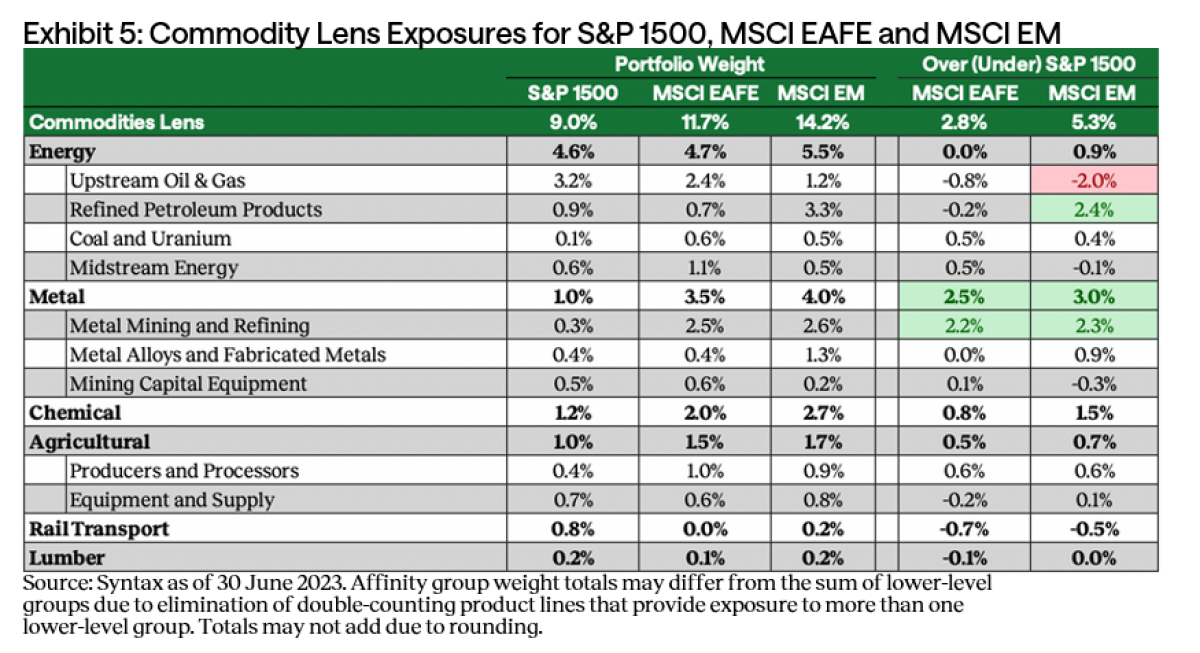
MSCI EM has the largest weight to the Commodities Lens at 14.2%, followed by MSCI EAFE at 11.7% and the S&P 1500 at 9.0%.
With its overall larger exposure to commodities, including non-energy commodities such as chemicals and metals, MSCI EM may serve as a better option for hedging inflation risk than the other two developed market indices.
Single Stock Concentration Risks
The S&P 1500 and MSCI EM indices have a relatively high concentration risk with their top ten holdings accounting for 29.1% and 23.3% of their total weights, respectively. In contrast, the top ten holdings of the MSCI EAFE make up only 14.9% of the Index.
The concentration risk to large tech companies is well documented in the U.S. For instance, Apple represents 7.1% of the S&P 1500 while Microsoft is 6.3%. The third and fourth largest index holdings are also tech names – Alphabet at 3.3% and Amazon at 2.9%. The MSCI EM index also faces identical concentration risk. Tech names dominate the list of top 10 holdings: Taiwan Semiconductor Manufacturing is the largest constituent at 6.8%, followed by Tencent at 3.7% and Samsung at 3.1%. In contrast, MSCI EAFE does not face the same concentration risk as the other two indices, with Nestle at 2.1% as its top holding.
Conclusion
Public equity indices are useful resources for investors when developing asset allocation targets and benchmarking performance. Frequently, however, they are considered as a default way to gain access to particular equity markets. In this paper, we have highlighted that all market-capitalization indices exhibit inherent biases that influence their respective performance in certain market environments. Recognizing and understanding these biases will enable investors to:
Select active and passive managers that are complementary and aligned with your objectives.
About the Authors:
Paul joined Syntax Advisors in 2021 as a Managing Director focusing on product development and client solutions for the institutional market. In this role, he works closely with the firm’s Research and Data Science teams on the design of the company’s Stratified index products and the functionality of the firm’s Affinity software.
Affinity is designed to help plan sponsors, investment managers, and fiduciaries better understand the business risks embedded in their portfolios. Prior to joining Syntax, Paul worked at NEPC for nearly 20 years where he held leadership positions overseeing NEPC’s Detroit office and serving as the consulting team leader for both the Corporate Defined Benefit and Healthcare teams. Paul’s experience also includes his role at Ford Motor Company where his responsibilities included overseeing the company’s $37 billion defined benefit pension plan and a $15 billion fixed-income operating portfolio.

At Syntax, our mission is to power economic analysis and enable investors to make better decisions. We are committed to helping investors better understand what they own by relying upon granular and precise data powered by our proprietary FIS framework and technology. For more information, visit www.syntaxdata.com.