


By Michael Green, Portfolio Manager and Chief Strategist at Simplify. Simplify was founded in 2020 to make institutional-grade alternative strategies available to all investors through the low-cost and transparent ETF vehicle.
A new paper further validates some of Michael Green's work on fund flows.
Summary
- Flows drove ARKK performance: My analysis of ARKK's performance was driven by three components: a negative alpha (poor stock-picking skills), a greater than 1.0 beta to the QQQ (market beta), and a significant flows beta, indicating that new investor inflows significantly impacted returns. The analysis results have now been almost perfectly replicated by academics as part of a broader “flow impact thesis”
- Impact of Flows on Returns: The recent paper by Van der Beek and Bouchaud confirmed the substantial role of flows in driving returns, particularly in thematic, concentrated ETFs like ARKK. Their findings showed that large inflows could create a positive feedback loop, leading to significant price impacts due to the high concentration of holdings.
- Active vs. Passive Fund Dynamics: While active funds, like ARKK, are more affected by inflows and outflows compared to passive funds, their size and concentration makes them the exception. Passive funds, despite their large market impact, have more stable flows and are less likely to experience accelerated booms and crashes, but the evidence is that the inelasticity for these funds is LARGER as we aggregate identical style strategies.
The Main Event
Back in early 2022, ahead of the broader market selloff, but after the ARKK/meme stock selloff of 2021, I noted that the performance of Cathie Wood’s ARKK funds was poorly understood:
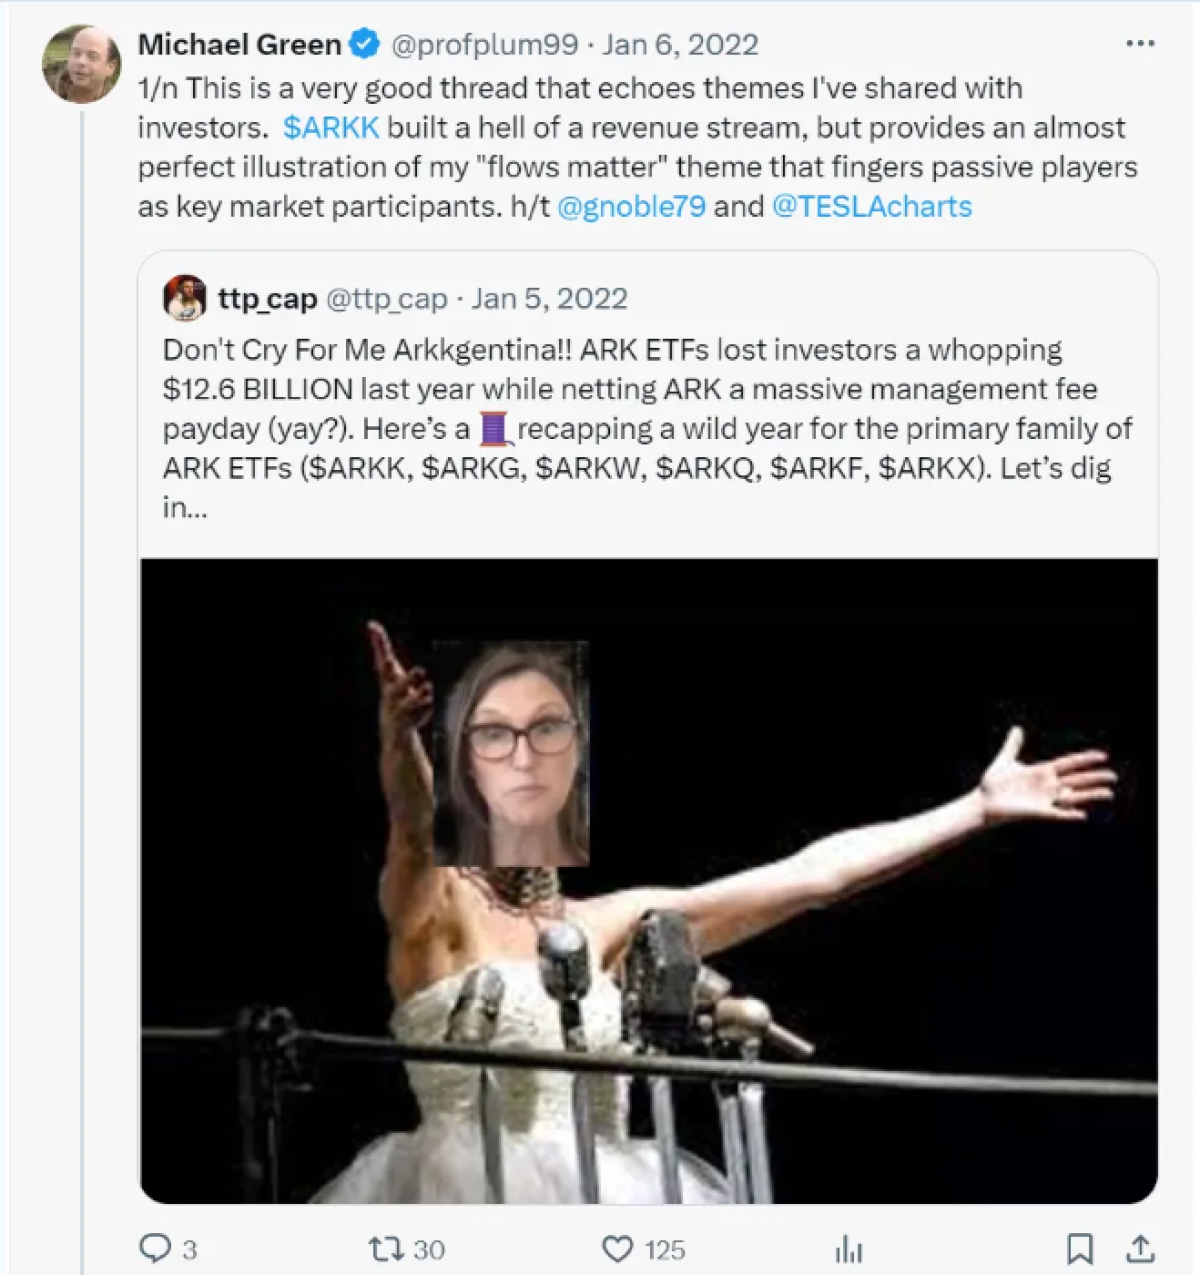
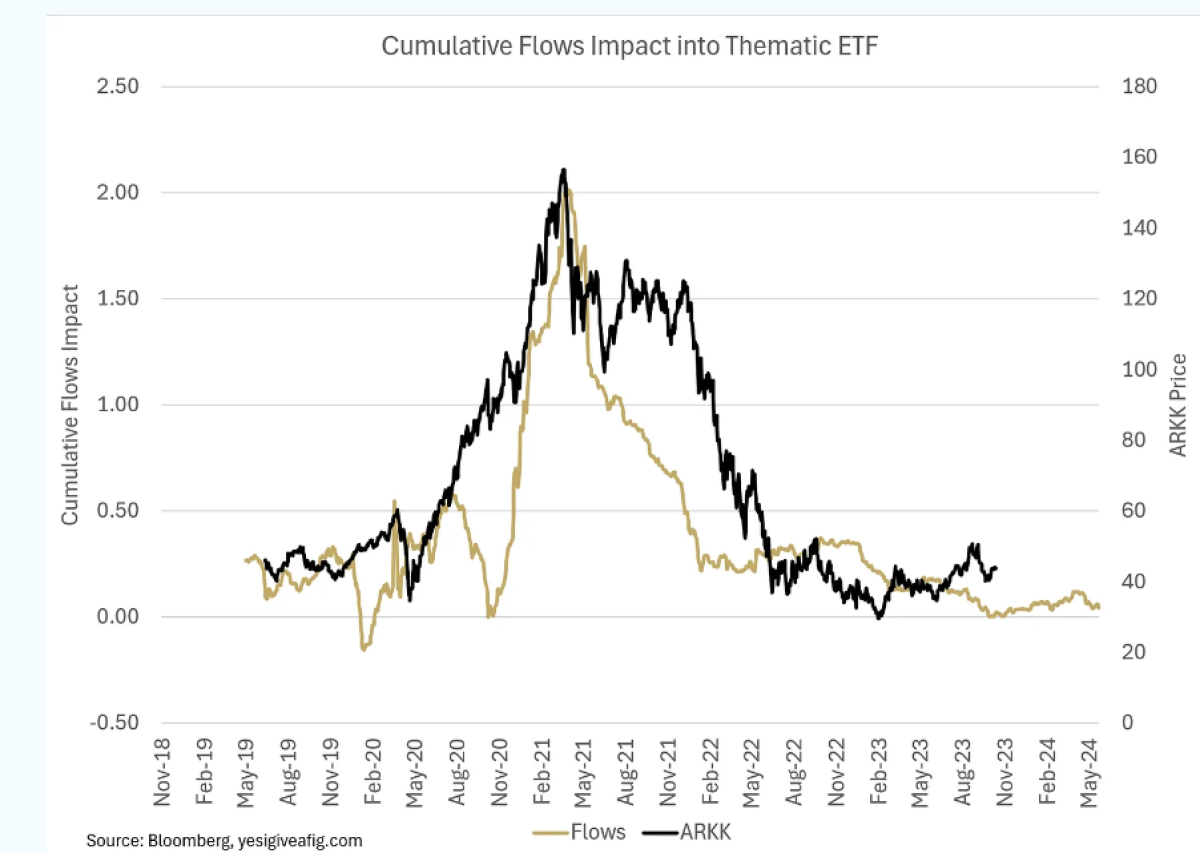
In a very simple analysis, it was clear that we needed to disaggregate the performance of ARKK into three components — an “alpha” return, a “market” (NDX) beta, and a FLOWS beta that measured the impact of new buyers entering ARKK and providing capital to buy the underlying names. My analysis looked like this (updated to present):
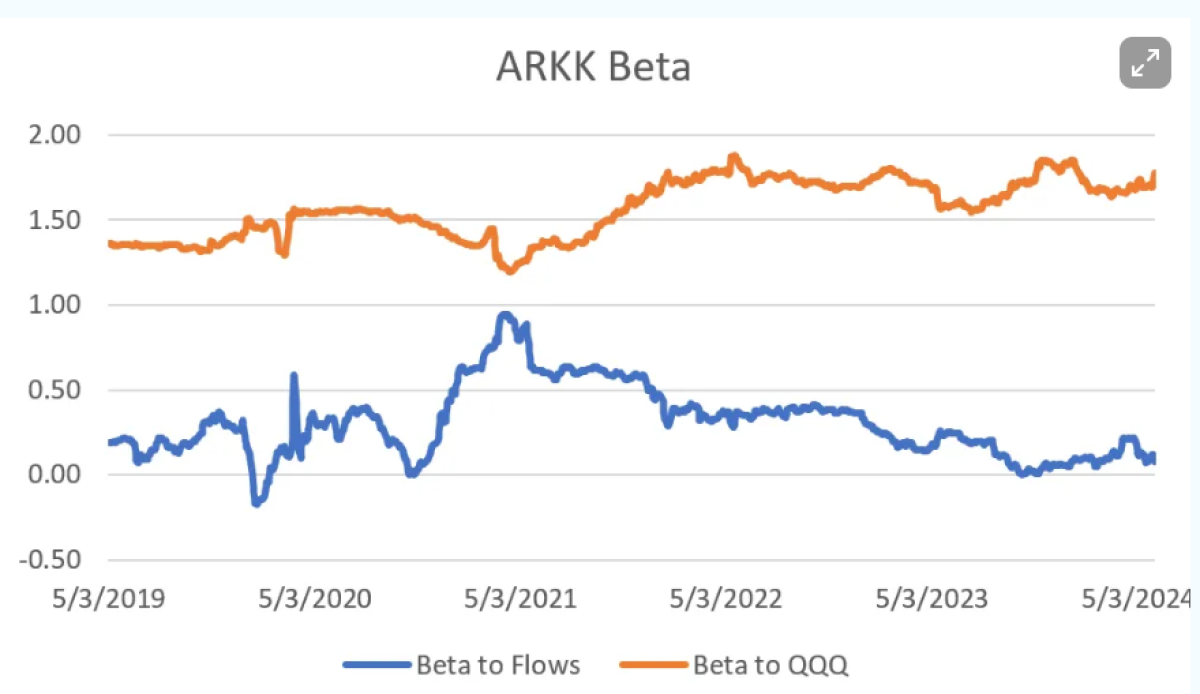
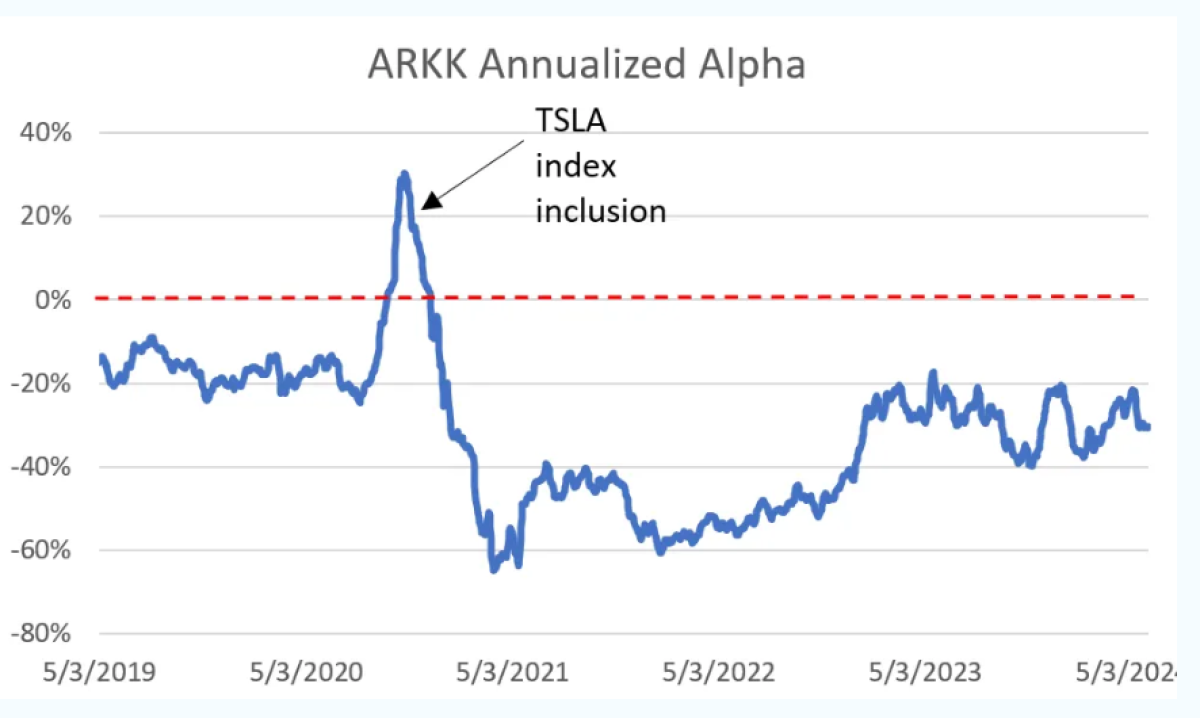
It was painfully clear that the “skill” (alpha) at ARK funds was negative, even as outperformance had been driven by a greater than 1.0 beta to the QQQ. As tech stocks soared from 2017 and rebounded sharply in 2020, that 1.5x beta more than offset the negative alpha, and funds raced into ARKK:
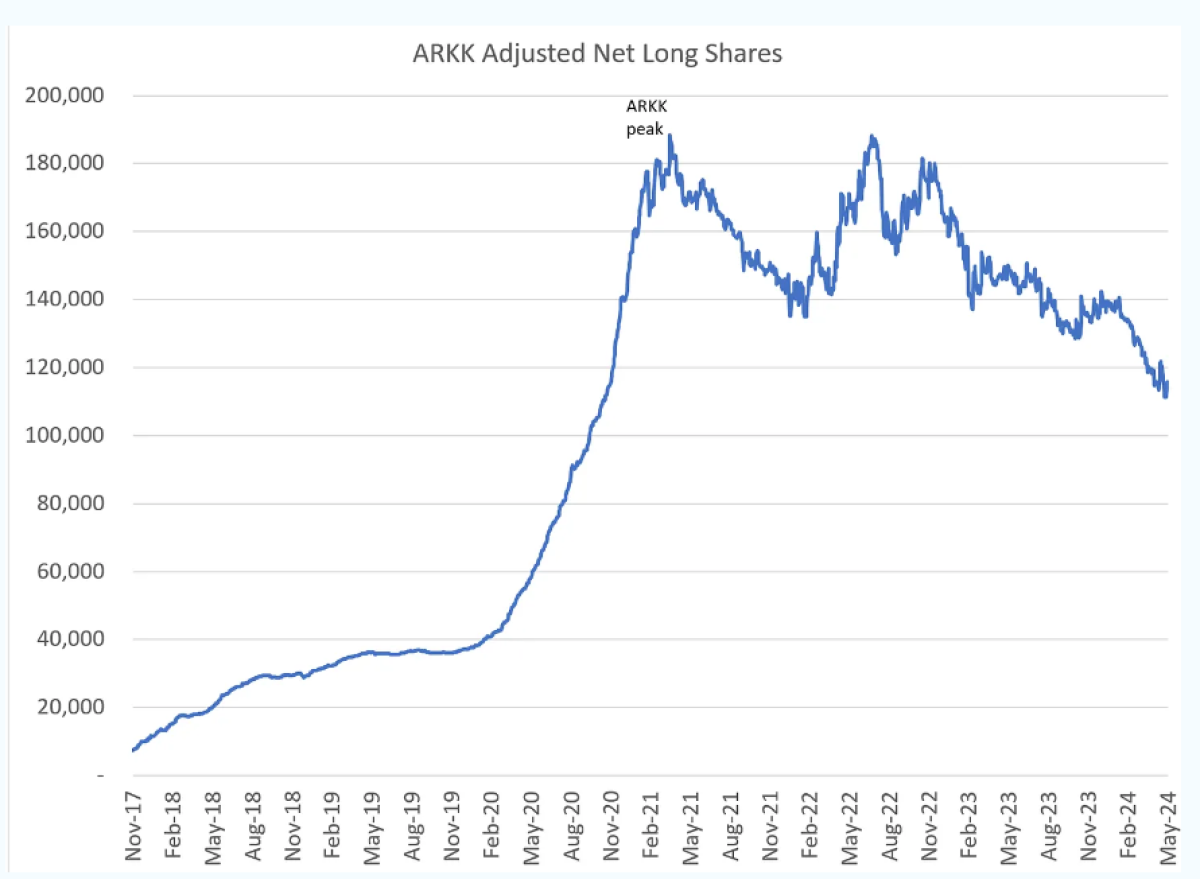
When I evaluated the aggregate source of returns, it was clear that the source of the returns in 2020 was the FLOWS, not the stock picking:
Ponzi Finance
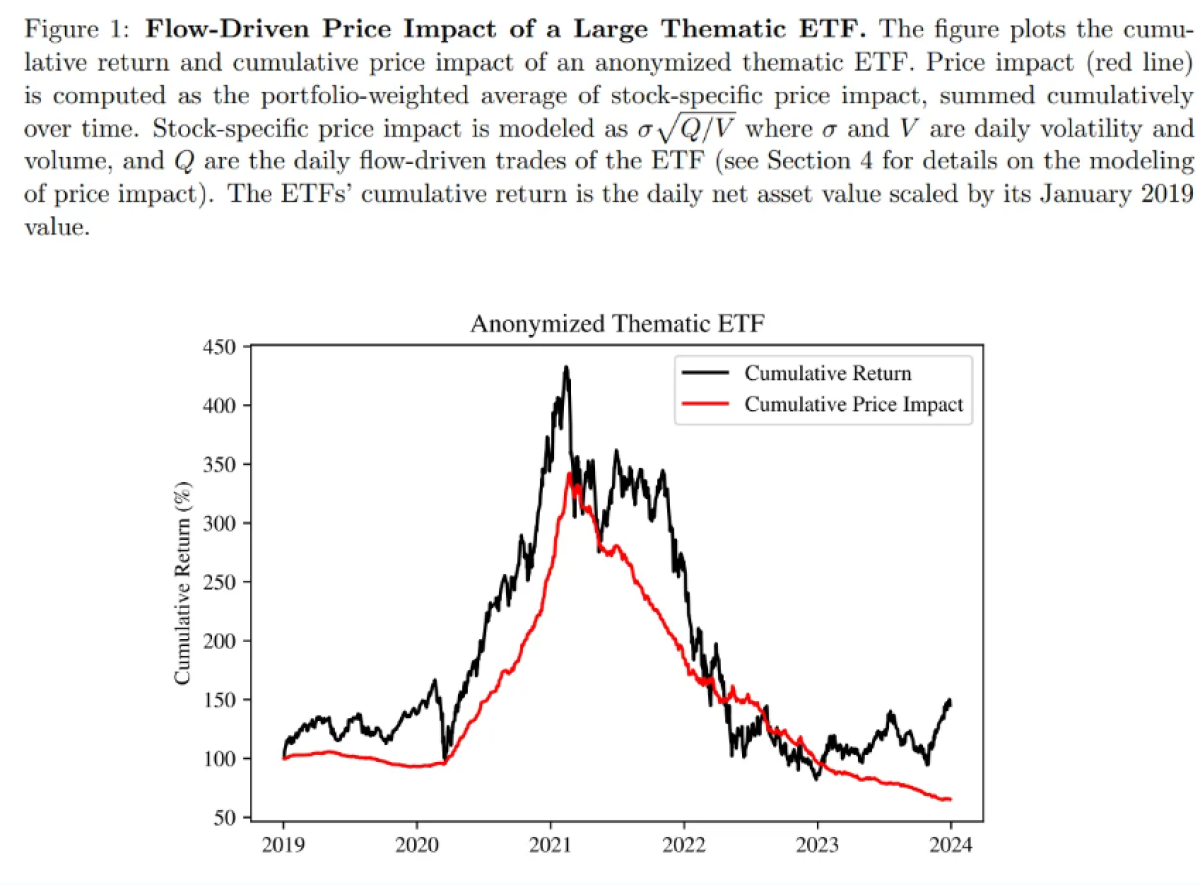
Last week, this analysis received a vote of support from a new paper by Phillip Van der Beek and JP Bouchaud. Regular readers will be familiar with Bouchaud, who’s masterful extension of Gabaix & Koijen’s “The Inelastic Market Hypothesis” is one of the best papers I’ve ever read. The new paper, provocatively titled “Ponzi Finance” evaluates the role of flows in determining returns. Not coincidentally, they chose to focus their analysis on a “thematic concentrated ETF” — the not-so-innocent shall not be named. To cut to the chase, using far more sophisticated methods, they come to almost the exact same conclusion:
In written words:
“During this period, the thematic ETF’s positions were 20 times larger than the daily dollar volume in those securities. This implies that whenever the thematic ETF received a 1% inflow on a certain day and proportionally rescaled its positions, it bought 20% of the daily volume in the underlying stocks. Because its portfolio was heavily concentrated in these individual securities and it received over 200% inflows, a large portion of its portfolio return was driven by its own price impact.”
Van der Beek and Bouchaud extend the work of academics like Haddad, Gabaix, Koijen, Yogo, etc by digging into ETFs where daily flows are available. This is a SUBSTANTIAL upgrade from the quarterly flow data available in mutual funds. And yet, they find almost exactly the same results:
“Quite remarkably, our price impact estimate from flow-induced trades matches well the estimates from the recent microstructure literature (e.g. Toth et al. (2011); Frazzini et al. (2018); Bouchaud et al. (2018)).”
The paper has several innovations, but the most important is a FUND rather than stock or asset-based analysis. The second key innovation is to consider the feedback loop that can be created if fund inflows create outperformance, leading to more inflows. The third innovation is to parameterize the impact of outflows. And the final innovation is to estimate how much “Ponzi” chasing of returns is actually taking place.
The paper is mathematically intense, but a few key stylized facts can be drawn out:
- Based on the traditional price impact equation for an individual stock:
Price Impact = σ(Q/V)^0.5
where σ and V are daily volatility and volume, and Q are the daily flow-driven trades.
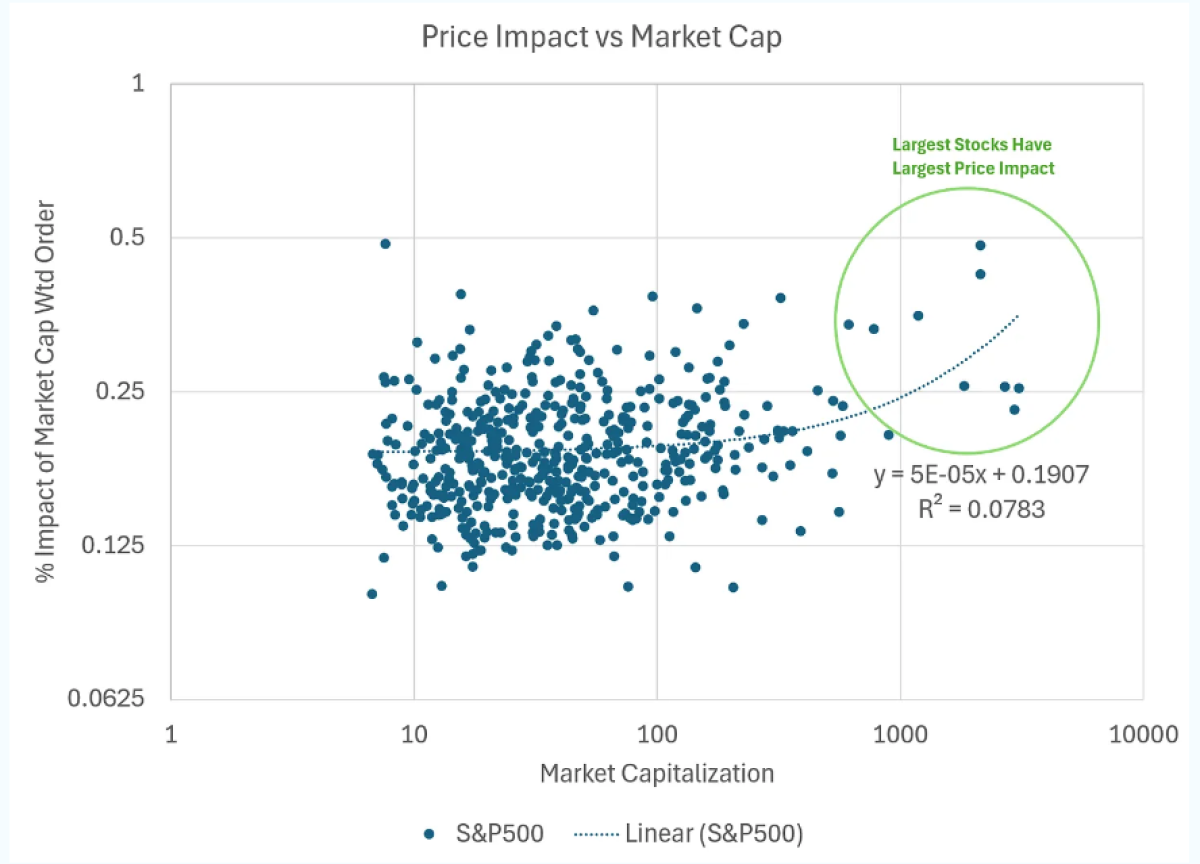
We see that price impact scales POSITIVELY with volatility (all else equal, a more volatile stock will experience a larger price impact from order flow), POSITIVELY with order size/flow, and NEGATIVELY with Volume. As you’ve heard me discuss before, ironically, this means the price impact of a market capitalization-weighted order (e.g. an index order) will have a LARGER price impact on the largest stocks:
You can extend price impact on individual stocks to a portfolio by weighting the price impact of an order against the weights within the portfolio. In this construction, they are calculating the “illiquidity” of the fund’s stock positions as:
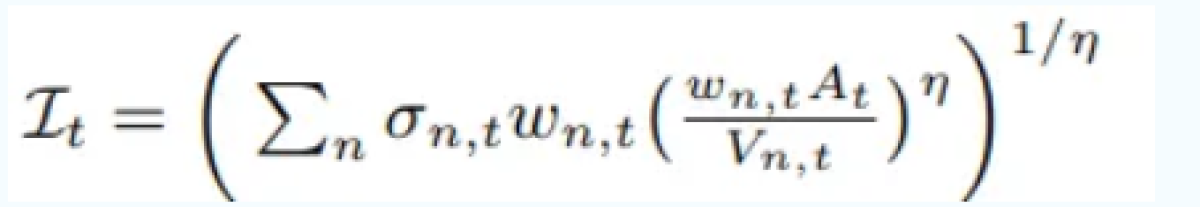
Where the fund position in Stock “n” is the weight (w) in Stock “n” times the total fund assets (A). This is then divided by the average dollar volume. They cite the example of the ROKU position in ARKK:
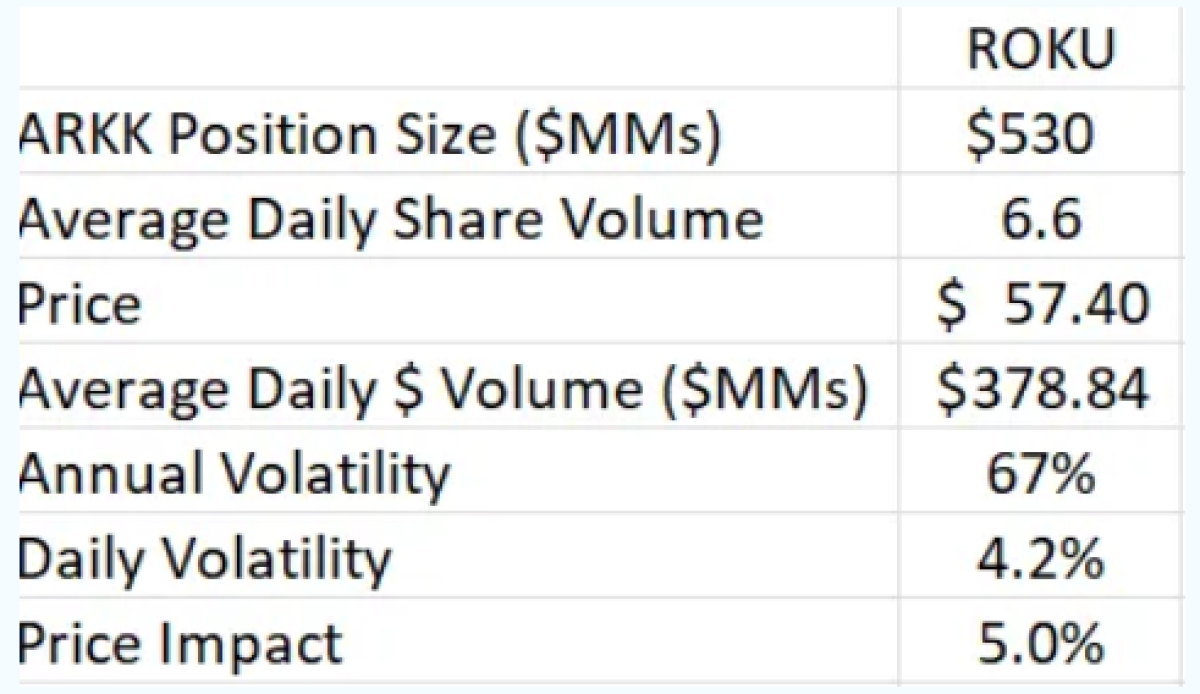
The larger the fund, the bigger the impact. The more concentrated the fund, the bigger the impact. A large, concentrated fund? Large impact! A graphical representation of the ETF universe is provided:
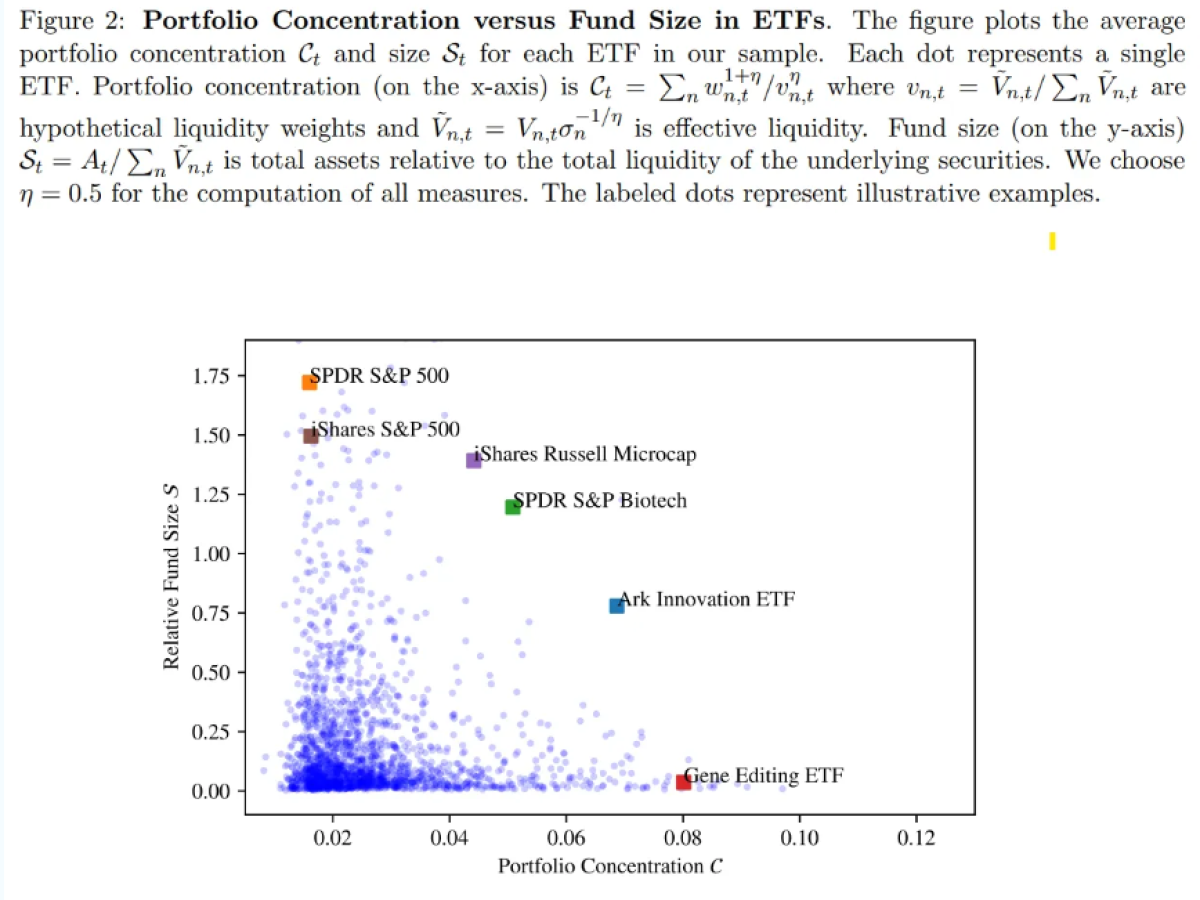
In general, active ETFs like ARKK represent an anomaly — highly concentrated and LARGE. As a result, it’s a perfect illustration of the impact of flows. Once again, the lower the concentration, the less impact; the smaller the fund, the less impact. Note, importantly, that the SPDR S&P500 (and iShares S&P500) have low concentration, and therefore, we should expect a smaller impact.
Fine print matters — the authors define concentration as “deviation from the universe of available stocks”:
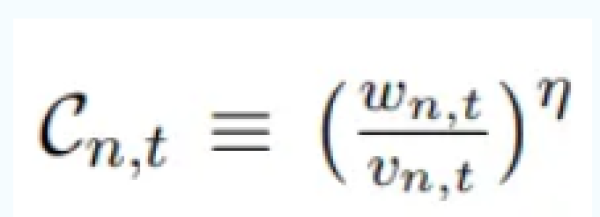
where w is the portfolio weight and v is the universe weight. This means that market-cap-weighted index products are assumed to represent the liquid portfolio. Large cap equity products ONLY diverge from the universe by their exclusion of small caps. With small caps now an increasingly tiny fraction of the universe, by definition these products are “low concentration.” We’ll return to this later.
The paper reinforces the growing literature that flows have a LARGE impact on returns rather than the EMH-assumption of near perfect elasticity. With this hypothesis rejected, the authors ask a key question: “Do flows beget flows?”
“In most neoclassical models, price impact (θ) is close to 0, and therefore flows do not affect realized returns (Ri,t ≈ R⊥ i,t). In the presence of non-zero price impact θ > 0 returns are driven by both fundamentals and price impact.”
“If investors weighted all past return realizations equally, then self-inflated returns would have a smaller effect on flows: Over long time scales, average returns are less affected by self-inflated returns which are primarily driven by short-lived spikes in inflows. However, because investors place a high weight on the most recent return, even short-lived self-inflated returns can strongly affect future flows leading to a positive feedback loop. The strength of the effect depends on i) how much of the variation in fund returns is driven by self-inflated returns and ii) how persistent the price impact is.
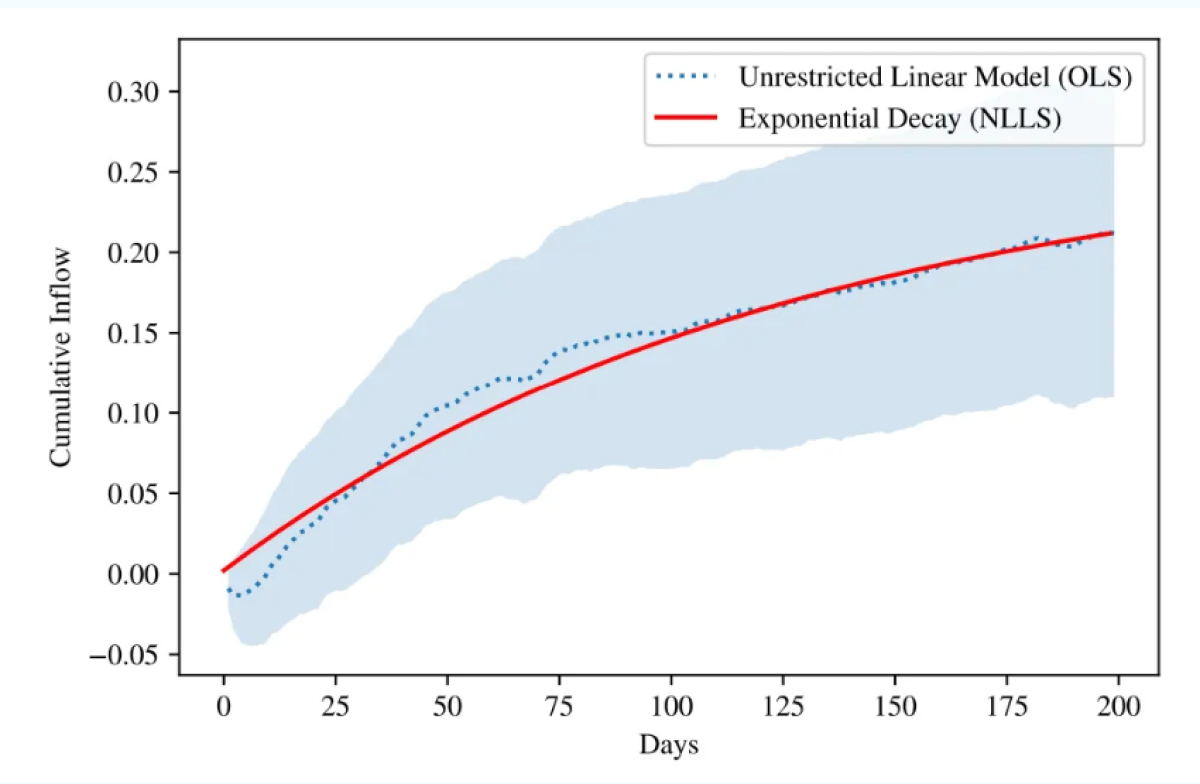
The authors conclude that the cumulative feedback loop over the course of 200 trading days is an additional 20% increase in flows:
Our Narrative Nature Strikes Again!
One of the more interesting results is that the feedback loop is MUCH stronger for active funds than passive funds.
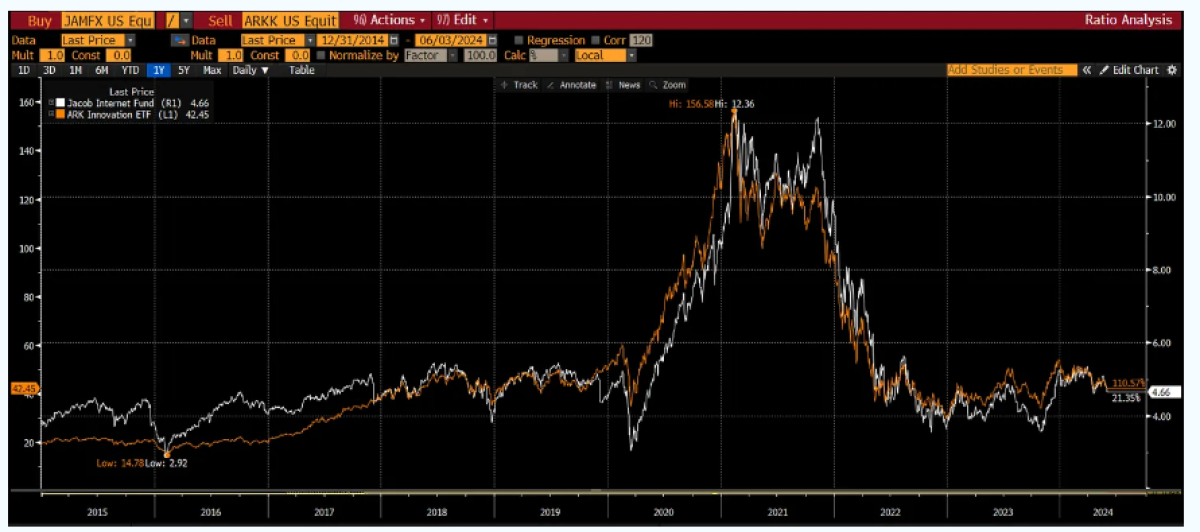
“For passive funds, the coefficients on R˜I i,t and R˜⊥ i,t are 0.19 (t-stat 2.9) and 0.18 (t-stat 2.7) respectively. For active funds, the coefficients are 0.77 (t-stat 4.3) and 0.89 (t-stat 8.1) respectively. Unfortunately, this suggests it will be much HARDER for active funds to regain lost assets. As Cathie Wood is discovering, the outflows push returns lower, driving yet more investors away. While some fraction of investors will remain simply due to inattention, a tarnished active manager rarely rises again. The Ryan Jacobs’ helmed Jacobs Internet Fund [JAMFX] continues to manage around $50MM at a 2.5% fee nearly 25 years after his 400% gain in 1999 (which was followed by a 95% wipeout). If you had any question whether 2021 was a DotCom type experience, look no further than the tight correlation between ARKK and JAMFX over the past decade:
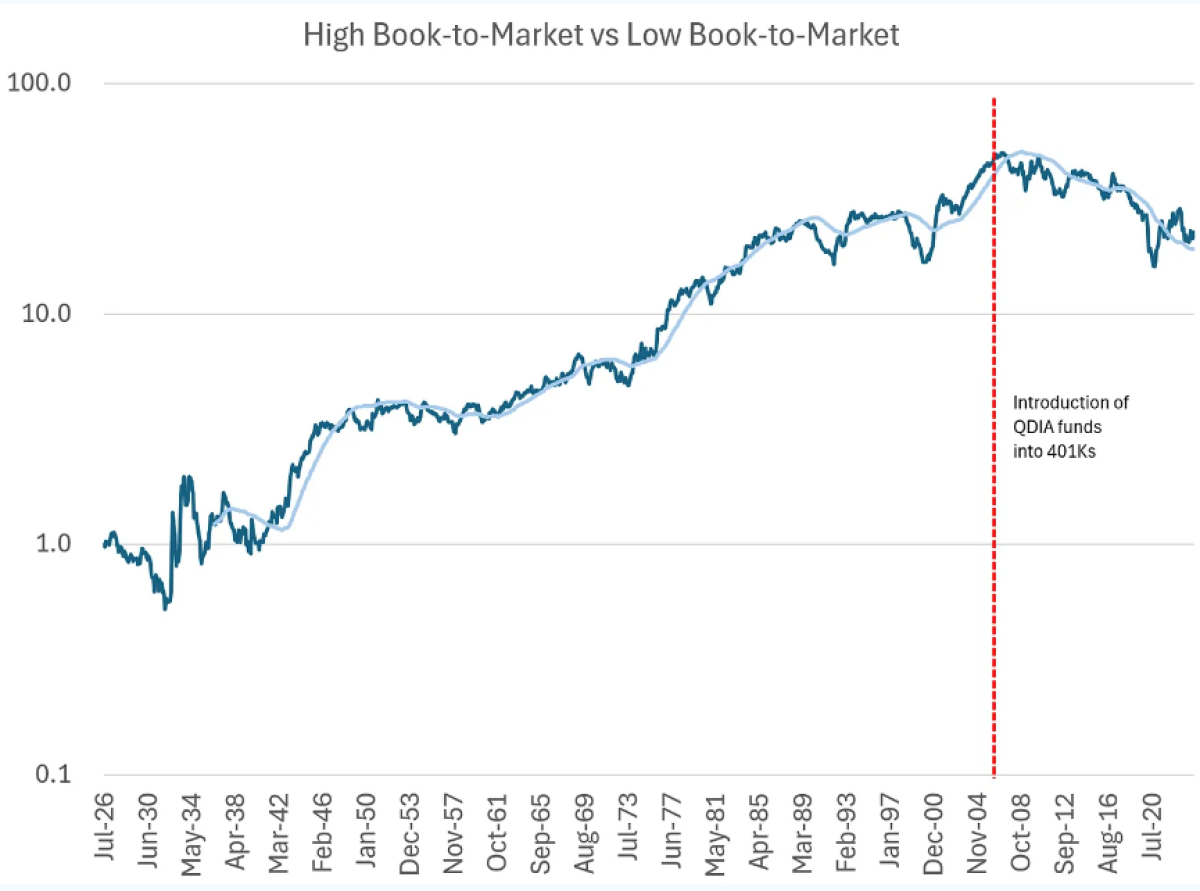
The authors do not fully explore the implications of this divergence, but I’d note that the higher the coefficient, the higher the probability that periods of outperformance are extended by the additional inflows. If my hot hand is positively influenced by inflows, then additional inflows support my hot hand. If the market is dominated by active strategies, the implication is that STYLES of investing will have longer and possibly more extreme cycles, e.g. a value cycle will extend as money chases the “brilliant” managers that avoided the DotCom collapse or the Nifty Fifty or the Great Depression. While far from dispositive, there are some indications that this may be true. Following the introduction of QDIA/opt-out 401K dynamics that supercharged passive, value began to experience an unprecedented drawdown that is consistent with the work of Xiong, Idzorek, and Ibbotson published last year and the outflows from active management:
We estimate that the flow-impact on annualized alpha for aggregated active funds industry was a positive 0.33% between 1/1991 – 12/2005, but it was a negative -0.10% between 1/2006 - 9/2021.
That break in the trend around 2006 is pretty undeniable:
Active vs Passive
If performance chasing is a bigger issue in active than passive, and large funds like SPY appear to have less concentration and price impact issues than concentrated active funds, does this argue that passive is less of a problem? Somewhat. The good news is something we already know — investors in passive funds are pretty much buy and hold, dollar cost averages. Bogleheads. This means their flows are more stable and LESS likely to result in accelerated crashes as we saw for ARKK/JAMFX.
Unfortunately, once we begin discussing indices, the FUND ceases to be the right metric.
The more diversified nature of passive funds means that each individual fund has less market impact. But buried in the paper is an interesting observation:
the underlying drivers of this feedback loop – return chasing and price impact – apply more generally. For example, trend following in futures markets and the $300 Billion wide CTA industry, are likely prone to self-inflated price spirals (see Lemp´eri`ere et al. (2014) and references therein). Similarly, the “quant crunch” in 2007 (Khandani and Lo (2011)) and other deleveraging spirals can be seen as outcomes of the interaction between return chasing and price impact
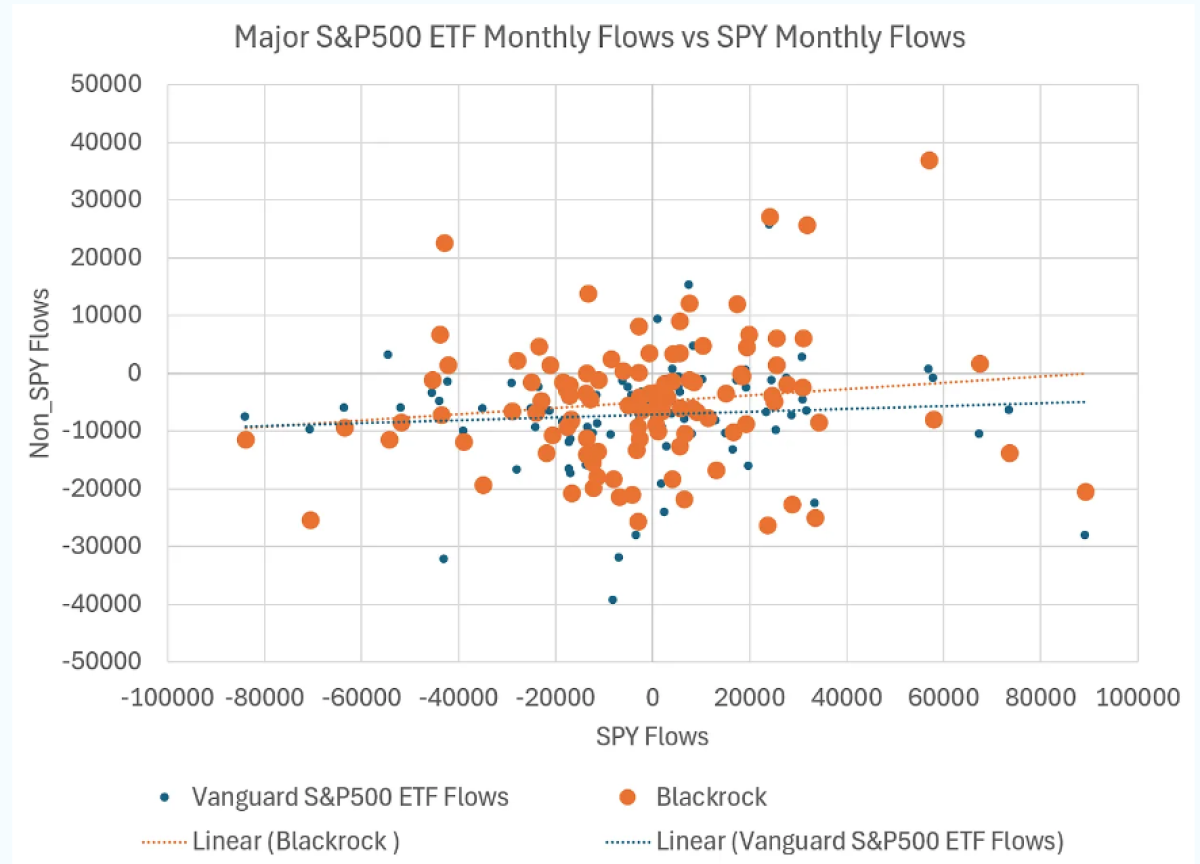
The same can be said of index investing. IF investors treated major S&P500 ETFs as substitutes, buying SPY and selling IVV, then the impact would be muted. Unfortunately, the correlation in flows is positive (albeit modestly) and this is certainly true at the mutual fund level as well. Once again, we are faced with the reality that “the Vanguard S&P500 fund” is less relevant than “all assets invested in the S&P500.” And while this paper assumes that these portfolios represent the liquid portfolios by virtue of their construction, this presents a RELATIVE picture, not an absolute picture. As assets become more concentrated in “Total Market” or S&P500 funds, the absolute concentration grows. This is the “This is Water” dynamic as the market itself is being changed. Adding to my readers homework, a 2022 paper identifies this dynamic, noting that concentration risks grow LARGER as we aggregate:
“We decompose demand imbalances in the U.S. stock market into components at different levels of aggregation and estimate their respective price impacts using a unified approach. The results reveal that the price multipliers form a continuum that is higher at more aggregate levels. Our findings are inconsistent with information-based explanations but are largely consistent with mechanisms based on risk-averse liquidity providers.” — Li and Lin 2022
As a result, we need to consider that coordinated sell-offs are harder, but ironically LESS performance dependent at the passive level (ie more tied to demographic features). And if we consider the impact of increased absolute concentration, the price impact continues to grow. Across the S&P500, a very similar dynamic is taking place to ARKK. With S&P500 funds (ETFs, mutual funds, CITs, futures, separate accounts, etc) holding over 33% of the S&P500 stocks per Marco Sammon (“Double What You Think”), the price impact of index flows in aggregate is greater than the effect of ARKK (20%) on its holdings. Now you understand why index rebalancing can get so wild.
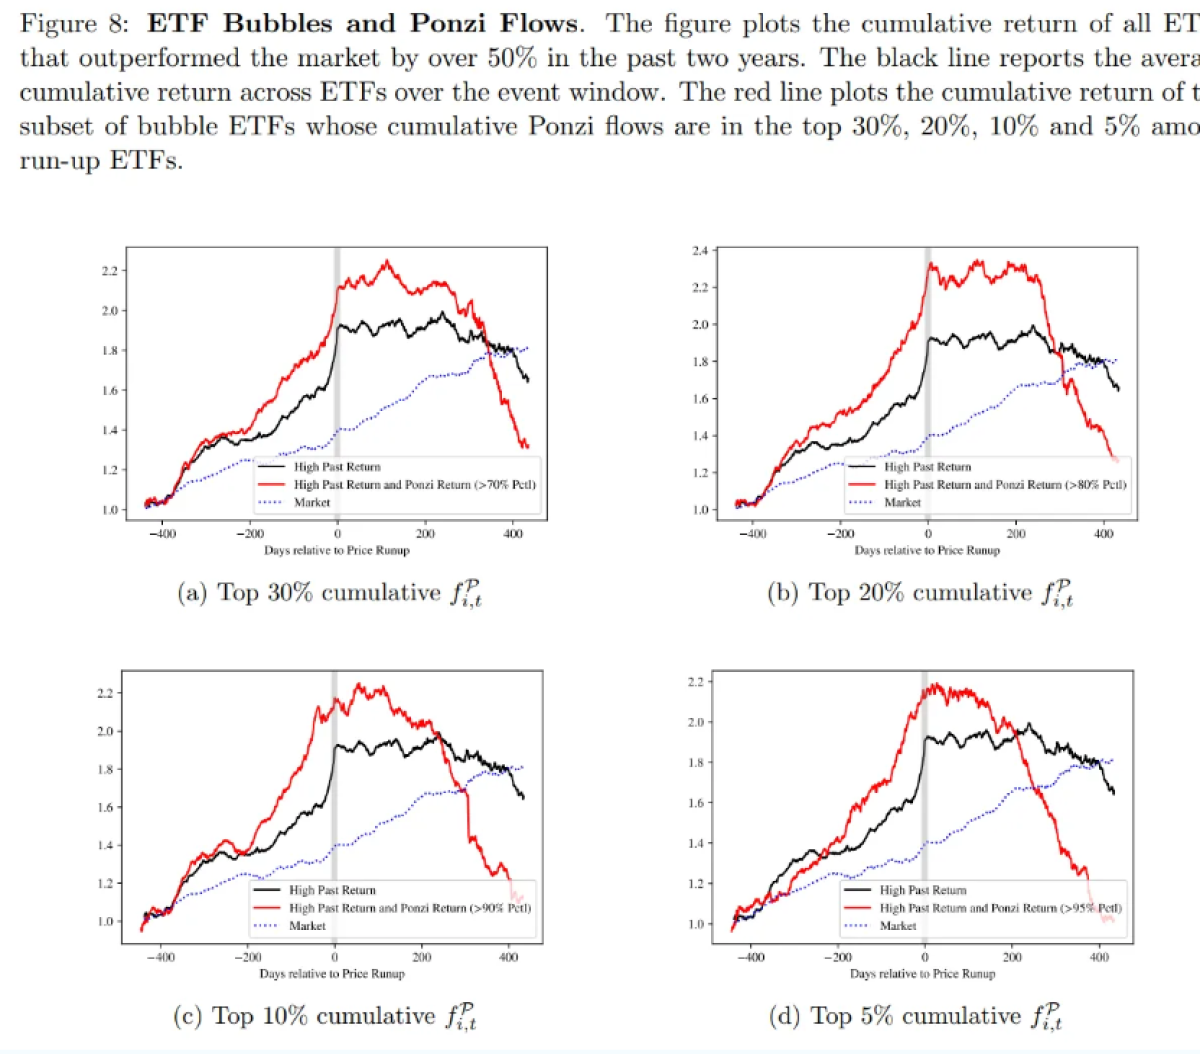
The unwind is ugly…
Once again, it is clear that passive is structurally changing the market. Van der Beek et al provide us with a bit of a crystal ball, looking at the impact of unwinds. Once again, the more illiquid the fund, the bigger the impact of the flows, both coming and going:
As I always say, “I hope I’m wrong, but I think I’m right…” and Van der Beek and Bouchaud unfortunately increased the probability that I’m right.
About the Author:
Michael Green, CFA, has been a student of markets and market structure, for nearly 30 years. His proprietary research into the shift from actively managed portfolios and investment funds to systematic passive investment strategies has been presented to the Federal Reserve, the BIS, the IMF and numerous other industry groups and associations.
Michael joined Simplify in April 2021 after serving as Chief Strategist and Portfolio Manager for Logica Capital Advisers, LLC. Prior to Logica, Michael managed macro strategies at Thiel Macro, LLC, an investment firm that manages the personal capital of Peter Thiel. Prior to Thiel, Michael founded Ice Farm Capital, a discretionary global macro hedge fund seeded by Soros Fund Management. From 2006-2014, Michael founded and managed the New York office of Canyon Capital Advisors, a $23B multi-strategy hedge fund based in Los Angeles, CA, where he established their global macro strategies, managing in excess of $5B of exposure across equity, credit, FX, commodity and derivative markets.
In addition to his work as a market theorist and portfolio manager, Michael has been noted for his work as a public speaker and financial media participant. He is a graduate of the Wharton School at the University of Pennsylvania and a CFA holder.
