


By Rajeev Dham, Partner, Anders Ranum, Partner, and Aditya Reddy, Associate, at Sapphire Ventures.
For nearly a generation, spreadsheets have been the de-facto tool for millions of information workers. From VisiCalc and Lotus 1-2-3 to Excel and Google Sheets, advancements in spreadsheet software have dramatically improved our ability to analyze, forecast, and share data. In this joint post from Sapphire Ventures and Canvas, we’ll introduce the next advancement in spreadsheet technology, the connected spreadsheet, and how it will drive faster, data-driven decision-making for modern business teams.
Sapphire’s perspective
The team at Sapphire Ventures has long been big believers in the value of companies that provide tools to operationalize and democratize access to data. Through investments in various BI, data prep, and horizontal AI/ML platforms over the past decade, the firm has developed a deep understanding of the business impact that ubiquitously accessible data across the organization can have in driving better internal decision-making and superior customer experiences. Over the past four decades, the spreadsheet has grown into one of the world’s most widely used pieces of software due to its flexibility, ease of use, and robust calculation functionality. However, as data and systems-of-record for various functions continue to proliferate, we believe there is a need for a next-generation spreadsheet platform that allows business analysts to introduce real-time data and cross-functional collaboration into their analysis and reporting workflows.
A brief history of the spreadsheet – the original “Killer App”
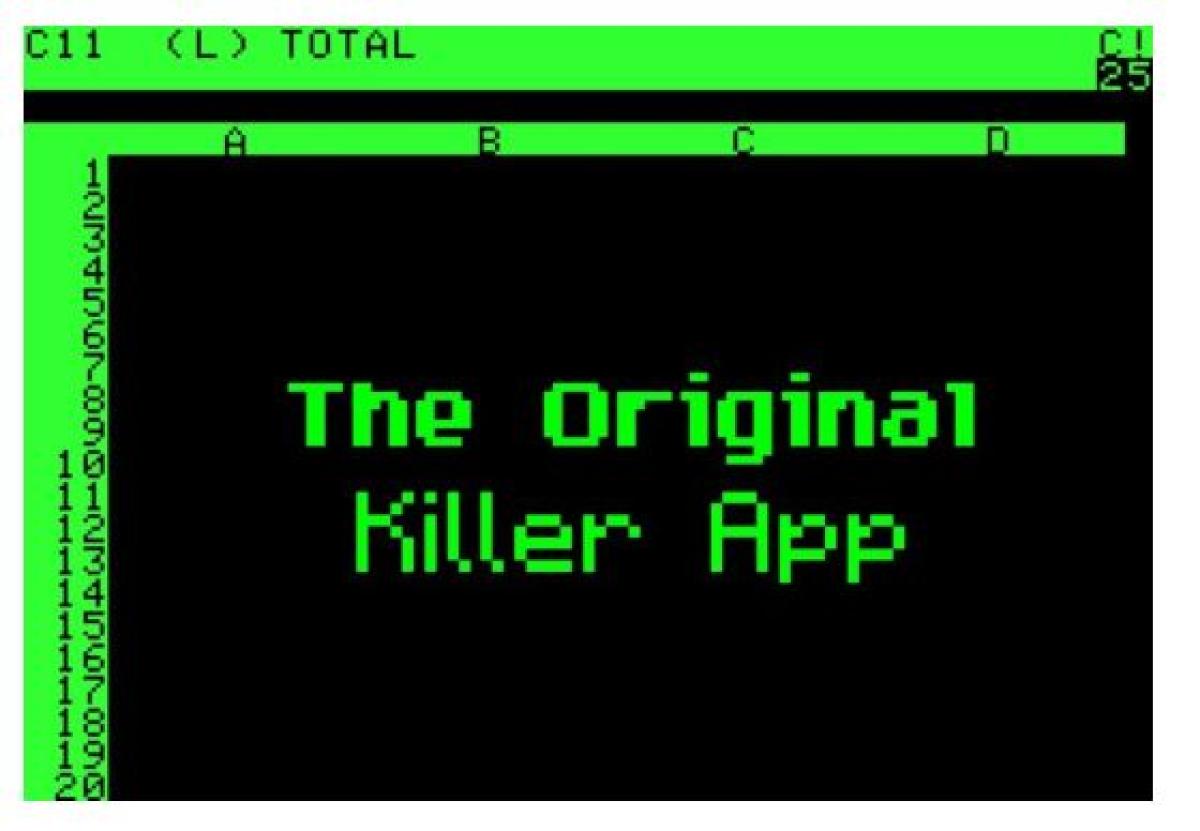
VisiCalc digitizes the Worksheet
Designed initially as digital analogs of paper-based accounting worksheets, VisiCalc is widely known as the first killer app that drove the success of the Apple II computer in the early 80s. Its WYSIWYG interface helped business users to perform calculations, fix errors, and share digital files.
Lotus 1-2-3, Excel and the Personal Computer
Lotus 1-2-3, a similar spreadsheet application built specifically for the IBM PC, was released a few years later and quickly became the killer app for the best-selling personal computer on the market. Lotus 1-2-3 maintained dominance for nearly a decade until Microsoft’s Office Suite and its killer app, Excel, took the world by storm.
Google Sheets – A Spreadsheet in the Cloud
With the rise of cloud computing in the 2000s, Google Sheets became one of the first killer spreadsheet apps for the browser, allowing users to collaborate and share spreadsheets without having to worry about file management.
What’s next?
Throughout computing history, spreadsheets have dominated the business world because of their simplicity and flexibility for new and advanced users. With its install base of nearly a billion users and its inclusion in school curriculums globally, Excel is often the first and only programming language information workers learn and need throughout their careers.
Yet, with the rise of cloud computing, automation, and big data, we believe today’s information workers face a unique set of challenges regarding data analysis using traditional spreadsheet applications.
Challenges with current spreadsheet workflows
Manual reporting workflows slow decision-making: Because many operators don’t know SQL, the standard language for querying databases, they often must export CSVs out of SaaS and BI tools into spreadsheets that are disconnected from data sources. Operators then must manually format, clean, join, and present this data. When it’s time to report on similar metrics again, they must refresh these sheets with the latest data.
Inefficient use of technical teams: With spreadsheets largely disconnected from source data and operators often lacking the ability to query real-time data, operators must lean heavily on technical teams for slight variations of data they need to access. These requests often distract technical teams from higher-order, strategic projects.
Big data brings performance issues: Because cloud-based spreadsheets like Google Sheets weren’t architected for large datasets, performance issues arise, slowing down analysis and forcing users to trim or separate datasets.
Lack of governance: Traditional spreadsheets have brittle permissions and version tracking, causing operators to be skeptical of sharing their work internally or externally. Without strong controls, teams can edit models and break references, causing version control issues and potential inaccuracies in the data.
Spreadsheet silos form due to lack of discovery: Because operators are often wary of sharing sheets given permission issues, silos can form in organizations. These silos hinder the sharing of insights and lead to potentially conflicting data between teams. Together, these forces may result in suboptimal decision-making and a potential breakdown of trust between teams fighting over whose numbers are correct.
While savvy operators have collaborated with technical teams to build in-house, custom solutions to alleviate some of these problems, a new category, the Connected Spreadsheet, has emerged to help operators use familiar skills to work with real-time, massive, and governed datasets.
Introducing the Connected Spreadsheet
We think of a connected spreadsheet as a browser-based platform with a spreadsheet-like interface that is integrated via API to one or more data sources and helps operators perform familiar workflows over real-time data. In the following sections, we’ll outline the key differentiators of a connected spreadsheet, introduce the vendors pioneering the space, describe the benefits it may bring your business, and help you understand if you’re ready to implement such a tool internally.
Benefits of Connected Spreadsheets
Automated connections to data sources: Connected spreadsheets were designed from first principles to integrate with data warehouses or lakehouses with SQL translation layers on top (like Databricks, Dremio*, Starburst, etc.), databases, and SaaS applications. Because of this, the data remains in this warehouse, where users can materialize views and save hours of CSV exporting and wrangling.
Designed for large datasets: Connected spreadsheets often leverage SQL on the backend, so you get the same performance from running SQL directly. These tools also avoid heavy client-side operations for improved performance over traditional Javascript-heavy spreadsheet applications.
Version control and role-based access control: Connected spreadsheets integrate with governed, trusted data sources. Because technical teams can manage RBAC in source systems and have additional controls at the interface level, teams can rest more easily when sharing datasets internally and externally.
Collaborative analytics: For the first time, we believe that data teams have visibility and control over the data, while operators and data teams can collaborate to ensure data is accurate.
Connected Spreadsheet use cases
Connected spreadsheets are designed to be flexible and have the potential to deliver value to teams across the business by improving many of their critical processes. Below, we outline just a small set of use-cases to illustrate how these platforms might fit into business teams’ workflows.
Automating end-of-period FP&A reporting: Build custom reports in a connected spreadsheet platform that refreshes data in real-time and enables finance teams to review their business’s performance with confidence in the accuracy of the output metrics.
Measuring free-to-paid conversion: Integrate with CRMs, product analytics tools, CDPs, and billing systems to visualize the percent of free users converting to paid over time. Opening this visualization up to GTM teams through a collaborative pane allows internal operations and customer-facing reps to remain aligned on progress towards improving conversion rates.
Tracking customer accounts at risk of churn: Integrate with product usage data (whether through the data warehouse or a customer data platform like mParticle, Rudderstack, Segment*, etc.) to provide real-time data access for success and support teams to quickly identify and address customer health issues.
Dynamically managing sales commission plans: Connect to CRMs, ERPs, HRIS, and the warehouse to enable real-time commissions calculations that power customized incentive programs. Platforms like CaptivateIQ*, Everstage, and QuotaPath offer a flexible spreadsheet-like solution targeting this use case.
Leading next-generation Connected Spreadsheet platforms

Canvas is a browser-based spreadsheet platform designed to help users visualize data from any source without SQL. Customers can connect SaaS applications or data warehouses to pull operational data into the platform. Business users can create data tables, apply filters to data sets using drag-and-drop functionality, join data from various sources, add formula logic and quickly visualize their analysis. When users have issues or questions, they can notify data teams, who can then inspect and edit underlying SQL code. With Canvas’s Figma-like approach, users can stitch together multiple data tables, prepare visualizations and collaborate with stakeholders.

Coefficient is a Google Suite-based side-bar application that supercharges Google Sheets by connecting it to various core data systems. It pulls complete data sets into the Google Sheets interface, allowing business users to manipulate the data using familiar functionality. Coefficient integrates with CRMs, SQL databases, and SaaS tools. Users can also read from and write to data sources.

Count is a browser-based, collaborative “Last Mile of Analytics” platform that empowers data teams to provide actionable data to business decision-makers. The platform integrates with SQL databases and data warehouses and offers a notebook-like experience where users can build queries using drag-and-drop functionality and collaborate. Through this approach, business teams have insight into the query-building process and can work more closely with data teams to build the right metrics/outputs while minimizing unnecessary iteration.

Equals is a browser-based connected spreadsheet platform built on the data warehouse. The tool enables non-technical users to access data without needing to use SQL (though a SQL editor is available if desired). Founded by the former head of Finance at Intercom, Equals has been designed with the Excel super-user in mind, down to the keyboard shortcuts that will delight spreadsheet fanatics.
Rows is a mobile-friendly, browser-based connected spreadsheet platform that leverages a drop-down form editor to slice and dice data.

The company has built out integrations with 40+ SaaS tools and public databases like Linkedin and Google Maps, which help analysts enrich their analyses. Rows targets cross-functional use-cases, including multi-channel ad performance tracking (marketing), user feedback collection (product), financial modeling (FP&A), team birthday alerts (HR), lead enrichment (sales), and more.
Founded in 2014, Sigma has been one of the longest-standing players in the category.

Sigma focuses on enabling business users within large enterprises to access data in their cloud data warehouse without requiring SQL. Sigma offers a browser-based spreadsheet UI/UX where users can leverage familiar spreadsheet formula syntax to analyze data and build visualizations quickly. The platform also facilitates collaboration at scale through shared workspaces, threaded discussions, and permissions. Sigma has doubled-down on its relationship with Snowflake, recently achieving “Elite” status in the Snowflake Partner Network and raising capital from Snowflake Ventures as part of its Series C funding in Dec’21.
The future of Connected Spreadsheets
We believe connected spreadsheets have the potential to transform how business and data teams collaborate and accelerate the rate at which data gets used to drive decision-making. A few observations and predictions for the future:
The rise of the Kimball Model lays the foundation for self-serve analytics
Database teams today continue to adopt the Kimball model for data warehousing, whereby business data is aggregated into a dimensional structure and linked together by common attributes. As these logically “joined” data tables continue to widen within the warehouse, analysts can more easily explore all of their data in a self-serve manner. Connected spreadsheets can facilitate a more self-serve interaction between context-aware business users and the underlying data warehouse.
Rise of the Metrics Layer enables trustable self-serve data access
While the evolution of the modern data stack has provided the infrastructure for capturing, storing and serving data, consumers of data have historically still lacked a way to extract consistently defined metrics. To ensure “apples-to-apples” analytics across the organization, the notion of a “metrics layer” of the modern data stack has emerged whereby data / BI teams define KPIs in code (i.e., outlining dimensions like time frame, geography, product segment, etc.) and enable data analysts to work with standardized metric logic. With consistent metrics defined on top of the warehouse, business analysts working within connected spreadsheets will be empowered to incorporate accurate, comparable metrics into their reporting and analysis.
Team-specific data “interfaces” emerge to cater to various personas across the business
As data teams adopt the metrics layer paradigm, which separates business logic from analytical interfaces, expect tailored platforms for different teams within the organization to emerge. It may become more common to see a variety of interfaces like Hex for data science, connected spreadsheets for operators, strategic dashboards for executives, and PLG CRMs for sales.
Operators are empowered to contribute directly to the data model workflow
It’s widely known today that highly-analytical, non-technical data users vastly outnumber those who are technical. With connected spreadsheets becoming more commonplace across the business (and operators gaining the tools to interact with their underlying data in a more self-serve fashion), individuals previously excluded from data model creation workflows can now contribute their domain expertise directly during the process. This speeds up development time, frees data teams to work on higher-value workstreams, and accelerates time-to-insight for the business.
How to know if and when connected spreadsheets are right for your business
If you’ve made it this far, you likely understand the potential advantages of leveraging a connected spreadsheet. But, you may still be wondering what it would look like to implement a connected spreadsheet in your business. Do you have the necessary data infrastructure and plumbing to use these tools? Are your teams ready to adopt a new solution for running their reporting and analysis? Does a connected spreadsheet replace Excel or Google Sheets?
Before you consider purchasing a connected spreadsheet platform, it’s important to understand how it will fit into your organization. These tools intend to accomplish many things but don’t expect them to replace your existing spreadsheet systems (e.g., Excel, Google Sheets). Excel is strong for ad-hoc analysis where model logic, as opposed to data, repeatability, and accuracy, is the primary driver of the analysis. So for that one-off, “back-of-the-envelope” scenario sensitivity you’re building, you’ll still want to fire up Excel/Sheets to do your work. Connected spreadsheets work best for analyses and reports with longer shelf lives that must be accessed by individuals across the organization, or require real-time data.
We believe the modern-day, data-driven business will deploy a connected spreadsheet alongside their existing spreadsheets, often bundled with email and docs. Doing so will enable non-technical business analysts to leverage the best of both worlds: a flexible tool for implementing highly complex model logic and a data-connected solution for running core operational reporting and analysis.
When selecting to adopt a connected spreadsheet solution, it is critical to consider your organization’s appetite and maturity level to get the most value out of this tool. Read on for a few signals to look for to know you are ready.
Signal: Maturity of your data infrastructure and data teams
Your organization has invested in initiatives to unify and govern data across the business, whether it is product usage data living in your CDP, billing data in your billing/revenue recognition systems, or employee data in your HRIS. If you’ve already adopted a data warehouse, you should be ready to integrate with the players mentioned above. Additionally, you’ll want some degree of data literacy for key stakeholders so they can respond to questions quickly. If you’ve hired a team of data experts, you’ll be in a prime position to deploy a connected spreadsheet platform to your business users at scale.
Signal: Sprawl in Excel reports driven by surging demand for data across the business
Another sign that you may be ready to adopt connected spreadsheets is if you’re beginning to see the sheer volume of spreadsheet-based reports ballooning within your organization. The typical causes for Excel report sprawl are indicators that your business is ready and hungry for quantifiable, data-driven insights. If sales leaders ask for weekly progress reports on funnel conversion metrics and product teams are curious about usage patterns for a new feature they just launched, you’re likely entering a stage in your business’s lifecycle where data has the potential to deliver a very high ROI through improving cross-organization decision-making. In response, business analysts are likely to resort to building custom reports in traditional spreadsheets which triggers several common “symptoms” associated with today’s paradigm of spreadsheet-based work: difficulty locating reports within your storage drive, issues with version control and challenges with data access and compliance due to lack of role-based access controls (to name just a few). If this sounds familiar, it may be time to consider implementing connected spreadsheets.
Signal: Increasing need to collaborate on spreadsheet reports and analyses
Suppose your company is on the smaller, earlier side of things. In that case, your teams are likely wearing multiple hats simultaneously, and everyone is empowered to make frequent decisions. On the flip side, if you are a large enterprise, your teams probably operate in silos and work out of static, disjointed systems. In either world, traditional spreadsheets are not cutting it for every workload, and there is likely a meaningful opportunity for your organization to implement a connected spreadsheet tool that effectively facilitates multi-persona, cross-functional collaboration in real-time.
Concluding thoughts
Organizations are capturing more volumes and varieties of data by the day and investing in building an internal culture around data-driven decision-making. We believe the advancements in modern data stack technologies have helped lay the technical foundation required to connect decision-makers with the metrics and insights they need. However, operators who are not proficient in SQL still rely on technical colleagues to access the data they need. Just as companies like VisiCalc, Lotus 1-2-3, Excel, and Google Sheets became one of the “Killer” apps for platforms of their time, we believe the connected spreadsheet has the potential to transform the modern data stack experience by becoming an accessible, real-time data access interface for operators.
If you’re looking to learn more about how connected spreadsheets might fit into your organization or are generally interested in chatting about the category, please don’t hesitate to reach out to Ryan Buick (Co-Founder @ Canvas) at ryan@canvasapp.com or Aditya Reddy (Investor @ Sapphire Ventures) at aditya@sapphireventures.com. We would love to hear from you!
This article was written in partnership with Ryan Buick, Co-Founder of Canvas and special thanks to Jason Mendel, Jane Lee, Kelsey Fantham, Will Pride, Luke Zapart and others for their insightful input!
Check out Sapphire's take on 'How Brands and the Metaverse Blend in Today’s Internet Age'
All posts are the opinion of the contributing author. As such, they should not be construed as investment advice, nor do the opinions expressed necessarily reflect the views of CAIA Association or the author’s employer.
About the Authors:
Rajeev Dham joined Sapphire Ventures in 2013, bringing with him broad technology investing experience. Rajeev’s investment focus is split between SaaS businesses as well as category-defining innovators in financial technology and healthcare.

Since joining Sapphire, Rajeev has been involved in dozens of investments and boards. Rajeev has led investments in and supports the boards of 6sense, ActivTrak, Adverity, CaptivateIQ, Catchpoint, Chargebee, Gorgias, Highspot, LeanData, Outreach, OwnBackup, Paper, Paradox, Pendo, Podium, Qualified, Reltio, and SWORD Health. Rajeev’s previous investments at Sapphire include Alteryx (NYSE: AYX), Cloudhealth (acquired by VMWare), Krux (acquired by Salesforce), Livongo (NASDAQ: LVGO) and Monday.com (NASDAQ: MNDY).
Rajeev also led the firm’s investment in Attentive, Braze (NASDAQ: BRZE), FalconX, Gem, Moveworks, Segment (acquired by Twilio), TaxBit and Wise (STO: WISE). In addition, he worked on investments in CircleCI, Clari, Looker (acquired by Google), Nutanix (NASDAQ: NTNX), Square (NYSE: SQ), Localytics (acquired by Upland Software), Punchh, PubNub, amongst others. His work has been recognized by GrowthGap, which named him a Top 40 Under 40 Growth Investor of 2020.*
Previously, Rajeev worked for Silver Lake, a technology-focused private equity firm, where he evaluated middle-market and growth equity investments across the software and internet sectors. Prior to his private equity career, Rajeev worked for the investment banking division of Goldman Sachs. He also spent time during business school working with Amazon’s corporate development group.
Rajeev holds an MBA from Harvard Business School and received a bachelor’s in business administration from the University of Southern California, where he graduated magna cum laude.
Anders Ranum has been investing at Sapphire Ventures since 2012. Currently, he is a board director or observer at Alation, Dremio, Exabeam, Feedzai, InfluxData, and JupiterOne. He led the firm’s investment in Kong, and worked on investments in Contentful and StackHawk. Anders is interested in next-generation enterprise infrastructure, data management, and cyber security solutions, as well as the intersection of autonomy, robotics, and disruptive technologies.

Anders’ previous investments at Sapphire include: Auth0 (Acq. by Okta), Cyphort (Acq. by Juniper), Iron.io (Acq. by Xenon Ventures), Portworx (Acq. by Pure Storage, JFrog (NASDAQ: FROG), and Sumo Logic (NASDAQ: SUMO).
Prior to joining Sapphire Ventures, Anders was an executive at SAP for 12 years in product management and strategy. He was also chief of staff to the CTO and executive board member of SAP. He worked closely on the acquisition of Business Objects and Sybase by SAP, among others.
Anders was born in Trondheim, Norway and has lived in Paris, South Dakota, and California. He has an MBA and a bachelor’s degree in management from the University of South Dakota.
Aditya Reddy joined Sapphire Ventures in 2021 as a member of the growth investment team. Prior to Sapphire, Aditya worked on the FP&A team at Sapphire’s portfolio company, Outreach, where he helped drive the consolidated top-line forecasting and reporting function for the business and supported the Marketing organization with ongoing business planning. Aditya began his career at J.P. Morgan in the Technology M&A group where he helped advise large technology clients on an array of strategic initiatives including M&A, divestitures and partnerships.

Aditya graduated from the University of California, Berkeley with a degree in Business Administration. Born and raised in the Bay Area, he enjoys playing basketball, traveling (adventure-style) and trying new foods.