A slim majority of hedge fund managers are in the red year to date, through April, according to the latest report from Eurekahedge. Specifically, 51.4% of managers have negative YTD performance. Over the same period in 2015, the analogous number was only 21.2%. That is a good indication of what a difficult period this is for the AI industry worldwide.
On the other hand, long/short equity funds were the only strategy in the negative YTD. It was down 1.35%, which is its worst YTD figure since 2008.
Yet even long-short equity funds were positive for the month of April. All the strategic mandates were up for the month so often associated with its showers, with the best performance coming from the managers of relative value funds, up 1.96%.
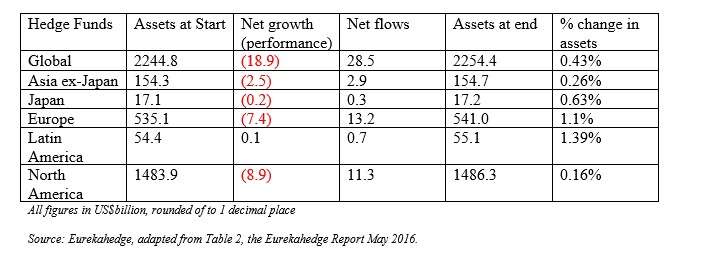
On a regional basis (and once again looking for YTD figures), everybody has had positive net flows, and everybody has had a positive total change in assets.
But – confirming the sense that this is an especially tricky time – only one of the regions has recorded a positive net growth in performance thus far in 2016. That’s Latin America. See the table below for more figures.

Versus Underlying Markets
Eurekahedge emphasizes that hedge funds outperformed their underlying markets in April and ended the month up 0.88% overall. Underlying markets, as represented by the MSCI World Index, gained only 0.67%.
Emerging market managers performed well in April and the commentary attributes this to “resilient oil and commodity prices which helped inject some investor optimism.” Also, the outlook turned up for China over the month of April, which itself helps across the commodity space.
Nonetheless, Eurekahedge’s commentary cautions that there is a “delicate balance” in the commodities world, and it might easily be upset, for example by “the Iran factor.”
Canada’s Globe & Mail put a point regarding Iran rather well, in an April 22 analysis by Mary Gooderham. Although the lifting of sanctions earlier this year created hopes of “a bonanza for those who want to get in on the ground floor” of a newly connected Iran, Gooderham wrote, subsequent weeks and months have been disillusioning.
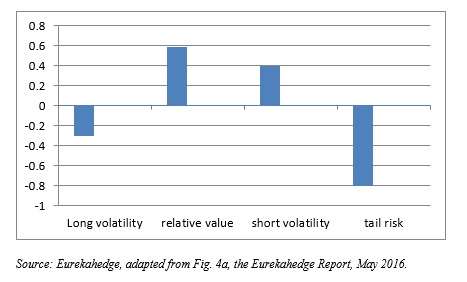
On another front: the CBOE Eurekahedge Volatility Indexes include four equally weighted indexes: long vol, short vol, relative value, tail risk. The graph below is based on the Eurekahedge report’s figure 4a, giving the returns for each volatility index for April 2016.
April 2016: Volatility Indexes

Source: Eurekahedge, adapted from Fig. 4a, the Eurekahedge Report, May 2016.
I won’t reproduce or adapt Figure 4b here. It gives the year-to-date results for the same group of indexes, and they look a lot like the YTD results above. For YTD as for April specifically: long vol and tail risk are down, relative value and short vol are up.
The tail risk and long vol strategies, though, are as the report says, “designed to deliver outsized returns during periods of extreme market volatility … hence losses can be expected during normal market conditions.”
Funds of Funds
The Eurekahedge report for May concludes with a discussion of the key trends in the world of funds of hedge funds.
The whole space has come under attack for a long time, at least since the global financial crisis of 2008, with many investors wondering why they should in effect pay for two levels of fees. If the answer is “diversification,” then, investors again wonder: ‘why can’t I diversity for myself?”
But Eurekahedge considers that “select regional and strategic mandates overseen by multimanagers continue to post strong returns which when combined with the trend of declining fees and superior management selection makes a strong case for the continued relevance of the funds of hedge funds model.”
There have been four consecutive years of positive performance based gains since 2012.
That’s good news for investors in this space. The news for managers, though, continues to be largely bad, as among their other woes they face heightened competition from liquid alternative products and hedge fund tracker vehicles.


