

By Mark Shore
As the discussions of trade wars and tariffs persisted throughout 2018 and into 2019, it may have influenced a sense of uncertainty in the global financial and commodity markets as companies might have to rethink their supply chains and manage potential disruptions and at least in the short-term experience increased pricing if the firm is on the buy side or potentially lose market share if they are on the sell side.
Uncertainty vs. Risk
Increased uncertainty frequently equates to market nervousness and increased volatility, potentially causing a reduction in investment and spending. Uncertainty may occur when markets or an economy are in a transition or future outcomes are less known. First, let’s define uncertainty and how it differs from risk. As noted by Frank Knight (1921), risk entails a set of known results and known probabilities. Uncertainty lacks enough information to determine a known set of expected outcomes and probabilities.1 Economists sometimes know it as “Knightian Uncertainty”.2 Uncertain scenarios lend itself to market and economic behavior when the participants have less confidence in what the result will be or when it may occur. 2018 was a year filled with global announcements on trade and this article looks at the question, have global trade tensions impacted European volatility as measured by the VSTOXX volatility index? The VSTOXX volatility index is a measurable instrument of the European market’s perspective of implied volatility. The EURO STOXX 50 Index is the underlying market for the VSTOXX volatility index, as noted in “Utilizing a European volatility Index for Pan-European volatility”, the index may be a proxy of volatility across many European markets.
The VSTOXX volatility index measures the implied volatility 30 day forward of EURO STOXX 50 index options and then annualizes the volatility. The index tends to rally when equities decline, also known as downside volatility. The EURO STOXX 50 Index represents the performance of the 50 “blue-chip” stocks of up to 11 Eurozone countries.3 Futures and options are available for the VSTOXX volatility index.
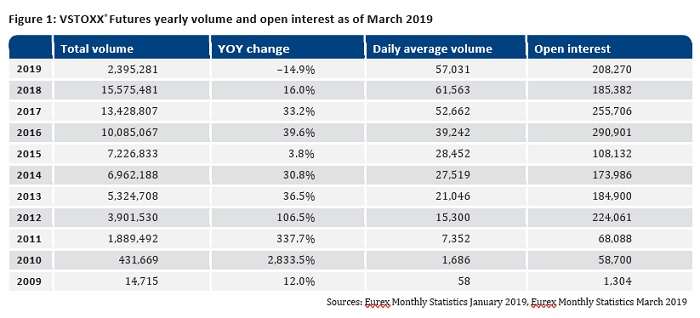
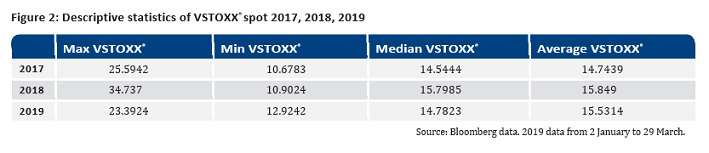
Europe experienced its share of volatility expansion in 2018 as displayed in Figure 2. Illustrated in “Is the recent low European volatility an anomaly?” the markets may have returned to a more “normal” volatility regime following 2017. For comparison, the spot VSTOXX volatility index median price from January 1999 to 31 December 2016 was 23.1.
However, trade wars are not the only issues troubling the global markets in recent years. Other matters concerning the markets include Brexit, European elections, fixed income markets, and slowing global economic growth. The OECD points out trade tensions as one of the headwinds of global growth with a potential consequence of supply disruptions fueling inflation.4 These issues have overlapped each other and possibly affected other extraneous economic factors. For example, the trade issues may be producing increased costs and reduction of sales for firms around the world. The longer the trade tensions last, the more likely other concerns are to occur. Trade disputes may be slowly creeping in as a factor in global economics. One of the unforeseen consequences of trade tensions includes Chinese firms seeking operations in Mexico and U.S. imports from Mexico growing by 10% in 2018, the largest in seven years.5
Trade Background
First, a little background of the E.U./ U.S. trade relations. The U.S. and the E.U. economies equate to about 50 percent of global Gross Domestic Product and an estimated 33 percent of world trade flows. It's not just trading, but also bilateral investment related to growth and jobs for both parties. An estimated 33 percent of E.U./ U.S. trade derives from intra-company transfers across the Atlantic.6 2018 experienced a 4.2 percent increase in imports to the E.U. from the U.S. and an 8 percent increase in exports from the E.U. to the U.S.7 The U.S. is the European Union’s largest trading partner at roughly 17.1 percent of the E.U.’s total trade and followed closely by China with 15.4 percent in 2018. Unique to this situation, the E.U. has the largest positive trade balance with the U.S. relative to its other trading partners and the largest negative trade balance with China relative to its trading partners.8 Therefore any trade tension between two of these three trading partners is likely to impact all three.
The tension between the European Union’s two largest trading partners is apparently declining German auto exports to China by 21 percent (annualized, as of Nov 2018). Goldman Sachs estimated the exposure most European countries have to the U.S. and China equates to 1 percent to 2 percent of each country’s GDP. Should the U.S. and China resolve their trade issues, this could hurt the E.U., as the goods exported to China from the E.U. and the U.S. have about a 0.6 correlation in similarity; therefore the E.U. may lose market share in those goods.9 E.U. companies with operations in the U.S. that export to China, such as Daimler and BMW experienced profit declines due to the Chinese tariffs on American-made autos. China’s increased purchases of Brazilian soybeans increased the cost of soybeans, causing Brazilian farmers to pay a higher price to purchase soybeans for feed grain, causing another unforeseen consequence.10
The above illustrates a constant play on the substitution effect as the trade wars may assist some industries and harm others, but overall it may increase market and economic uncertainty. As this trade war plays out in real time, there is an abundance of game theory both nations and companies may apply to try and formulate strategic or investment decisions in anticipation of each other’s future actions similar to playing chess on a global scale.
Measuring Volatility and Uncertainty
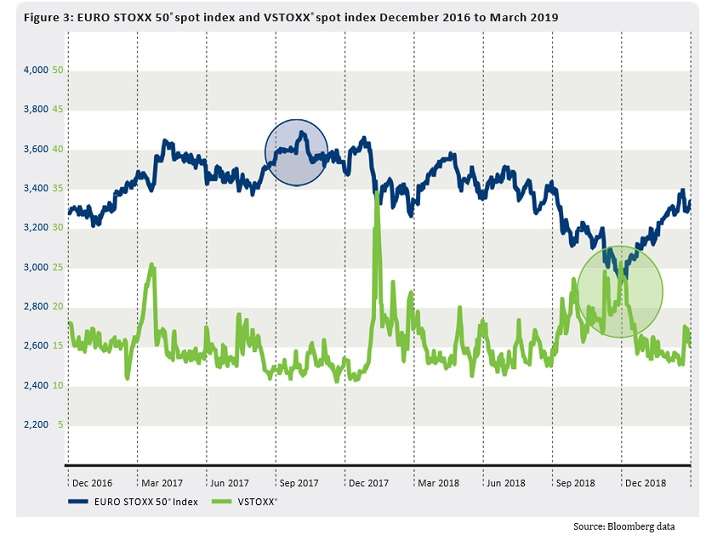
In Figure 3, the negative correlation between VSTOXX and the EURO STOXX 50 index is illustrated with a long term correlation of – 0.71 (Jan 1999 to March 2019). The equity market peaked in November 2017 (blue circle) while low volatility was sustained for an extended period and followed by a spike of volatility or as I refer to it as the “compressed spring effect”, in late January and early February 2018. Stocks declined the remainder of 2018 and bottomed 27 December 2018 while volatility simultaneously peaked (green circle). This coincided with announcements of the U.S. and China to hold trade talks.
On 22 January 2018, the announcement of the U.S. setting tariffs on solar cells and some washing machines began a string of announcements primarily between the U.S. and China for the remainder of the year and early 2019.11 For this study, the sample size was 144 announcements. The statements may have increased or decreased negative volatility depending on the announcement either increasing trade tensions or seeking resolution.
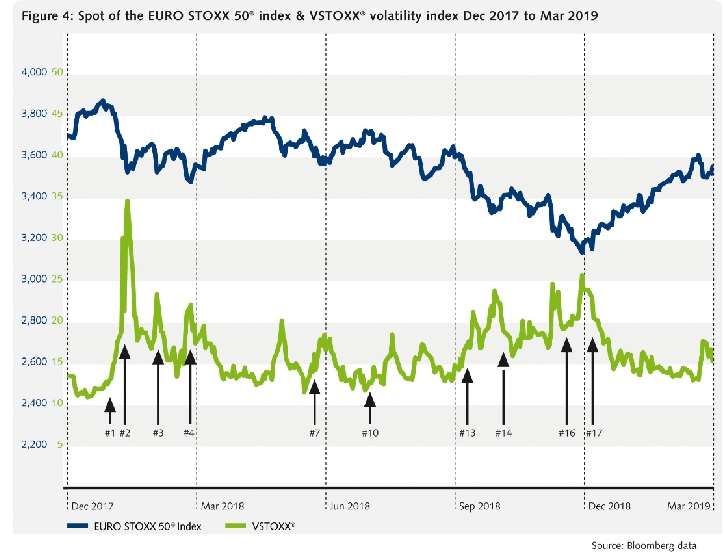
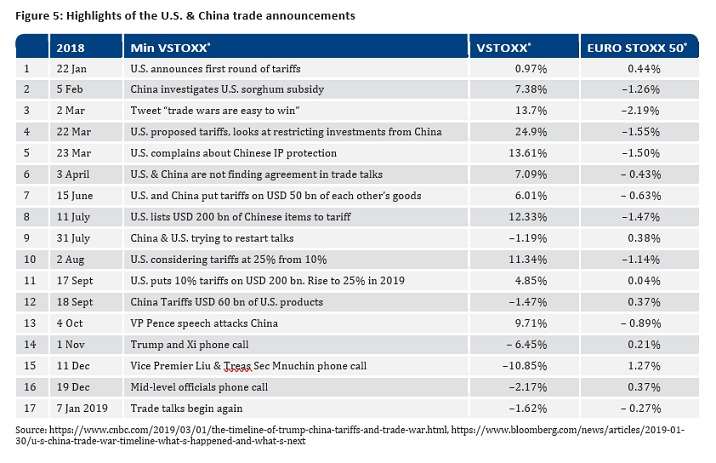
Examining 2018 more in-depth, Figure 4 illustrates several of the trade announcements and how it may have impacted the European markets. Some of the announcements may have affected the markets for several days. Others may have been a quick result if any. Sometimes it was a series of reports over several days as both parties quickly escalated their commitment attempting to inflict increasing economic costs on each other. The timeline should be considered a guideline of date ranges. Also if the information occurred after the European markets closed, the impact might show up in the next day’s trading. Figure 5 lists a sample of the trade announcements in 2018 and 2019.
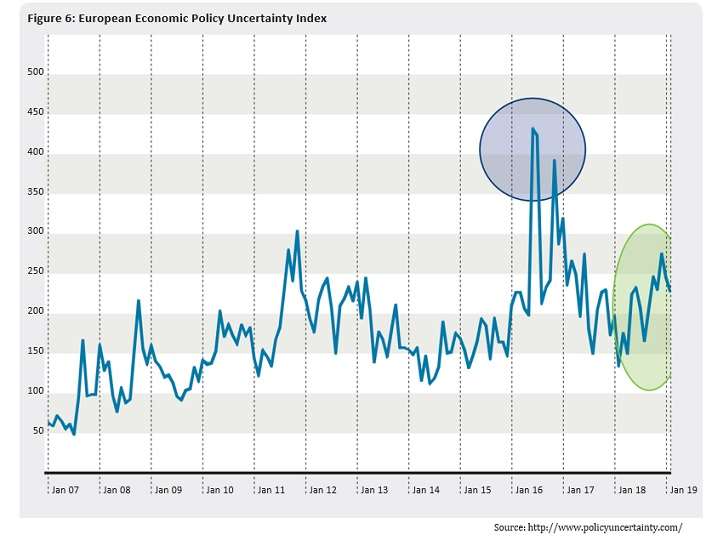
In discussing economic uncertainty, Figure 6 is the European Economic Policy Uncertainty index from January 2007 to February 2019. The index is determined from textual analysis of major newspapers in five countries (Germany, Italy, UK, France, and Spain). The methodology quantifies the number of economic policy related articles each month. Since the financial crisis, the index has trended higher. The blue circle in 2016 represents the Brexit vote. The green circle shows where the index bottomed in February 2018 and the recent top in December 2018. The 2018 bottom and top coincide with the start of trade tensions and when the U.S. and China declared a truce to allow for trade talks. As the perspective of uncertainty increases, that can translate into market behavior or actions taken by market participants.
Summary:
In Summary, the ongoing announcements and news of trade tensions appear to have introduced a new stream of uncertainty into the European economies and markets resulting in further market volatility. From this analysis, findings include:
- If trade tensions continue for an extended period of time, it may sustain a heightened sense of uncertainty that has gradually trended higher over the past
- The announcements and rhetoric in 2018 demonstrated an escalation of commitment, as both participants kept increasing the stakes, thus increasing the uncertainty of the outcome, costs and consequences.
- The E.U., China and the U.S. have strong trade relations. However, there could be potential economic concerns for the E.U. regardless if the U.S. and China resolve their issues or not. The U.S. and E.U. compete in similar markets in China. Some argue the markets could remain nervous in the near term. 12
- There are several other non-trade, but interrelated factors such as Brexit, central bank actions, and global economic slowdown simultaneously occurring that confounds the overall perspective of causation and correlation and unknown consequences, that may lend to sustained levels of uncertainty.
Mark Shore, Director of Educational Research at Coquest Advisors LLC, has more than 30 years of experience in alternative investments, publishes research, consults on alternative investments and conducts educational workshops. mshore@coquest.com
1 Shore, M. (2008). Introduction of Risk Management. Octane Research Newsletter.
2 Ruffino, D. (2014). Some Implications of Knightian Uncertainty for Finance and Regulation. FEDS Notes. Board of Governors of the Federal Reserve System. Retrieved from: https://www.federalreserve.gov/econresdata/notes/feds-notes/2014/some-implications-of-knightian-uncertainty-for-finance-and-regulation- 20140410.html
3 Source: www.stoxx.com, as of March 31, 2019.
6 http://ec.europa.eu/trade/policy/countries-and-regions/countries/united-states/
7 https://webgate.ec.europa.eu/isdb_results/factsheets/country/details_usa_en.pdf
8 http://trade.ec.europa.eu/doclib/docs/2006/september/tradoc_122530.pdf
10 https://www.cnn.com/2019/02/05/business/us-china-trade-war-europe/index.html
11 https://www.cnbc.com/2019/03/01/the-timeline-of-trump-china-tariffs-and-trade-war.html
"Past performance is not necessarily indicative of future results. The opinions expressed are solely those of the author and are only for educational purposes."