


By Beth Anne Byrne and Kara O’Halloran, FS Investments
Warren Buffett’s famous quote reads “You only learn who has been swimming naked when the tide goes out”. The tide is most certainly out now, and many portfolios have been exposed. The historic bull market has ended, and with it the ability for undiversified portfolios and strategies to hide behind equity-market returns.
For the two weeks ended March 20, both equities and fixed income suffered, with the S&P 500 down -22.4% and the Barclays Agg losing -5.5%, its worst two-week stretch since 1980. The move we’ve seen in gold is also alarming, as this and other traditional “safe havens” have tumbled alongside equities. Isn’t our current context the exact environment for which diversified portfolios are built? Unfortunately, many have seen the failures of traditional sources of diversification, which begs the question: Where has all the diversification gone?
With these wild swings, many portfolios are being tested for the first time in a long while, and many investors may be finding themselves less diversified than they had hoped as many asset classes have moved in virtual lockstep.
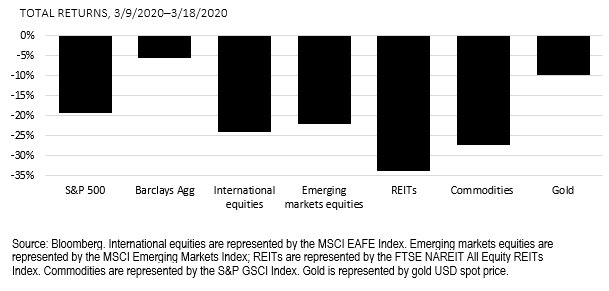
For the two weeks ended March 20, both equities and fixed income suffered, with the S&P 500 down -22.4% and the Barclays Agg losing -5.5%, its worst two-week stretch since 1980. The move we’ve seen in gold is also alarming, as this and other traditional “safe havens” have tumbled alongside equities. Isn’t our current context the exact environment for which diversified portfolios are built? Unfortunately, many have seen the failures of traditional sources of diversification, which begs the question: Where has all the diversification gone?
When diversification fails
Even during more normalized (i.e., less volatile) market environments, many portfolios are likely under-diversified. Many investors rely on traditional 60/40 portfolios, believing this mix of stocks and bonds offers adequate diversification. However, the volatility of stocks dwarfs that of bonds, which means that a 60/40 portfolio derives over 90% of its risk from its equity allocation. What many consider the“universal standard” for a balanced portfolio is, essentially, a bet on the equity markets.
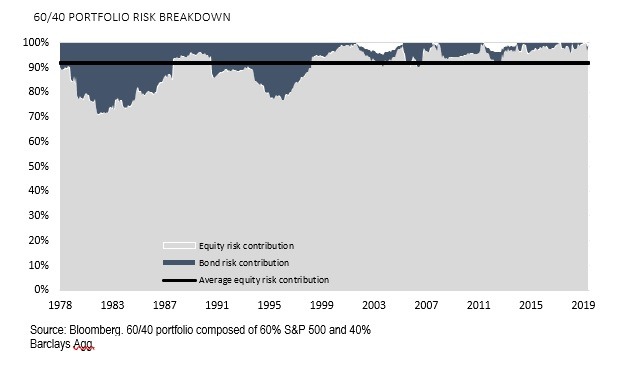
This is not to say that investors haven’t benefited from overlooking this concentration risk. A 60/40 portfolio has seen exceptional performance for much of the last decade due in large part to the secular decline in interest rates, which supported the price appreciation of nearly all types of risk assets, stocks and bonds included. In short, for the past 10 years, investors haven’t needed much diversification. The outsized equity risk inherent in a “balanced” portfolio was masked by strong returns with very little volatility. Many investors may have been unaware of how undiversified they were, until now. The mental challenge is that we don’t diversify for when things are going right. We diversify for moments like this, when unexpected events upend markets.
A crisis of correlation
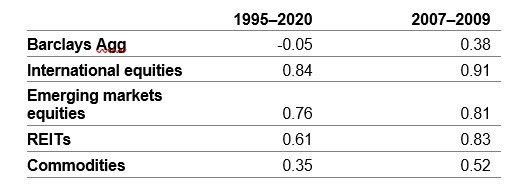
Of course, it’s impossible to predict exactly how markets and individual assets will perform in a crisis, but this phenomenon of converging correlations—and the resulting ineffective diversification—isn’t new. Said another way: Just when we need diversification from these traditional sources the most, it seems to disappear.
Converging correlations[1]
Trouble in paradise
Let’s focus more specifically on the correlation between stocks and bonds given the implications of their relationship for so many portfolios. For most of the past decade, bonds have been negatively correlated to stocks, making them a good equity hedge by providing both positive carry (interest income) and capital appreciation. Simply put, when stocks were down, bonds were up, and vice versa. We saw glimpses, however, of a breakdown in this relationship—the correlation turned positive, albeit briefly, a few times in 2016 and 2018.
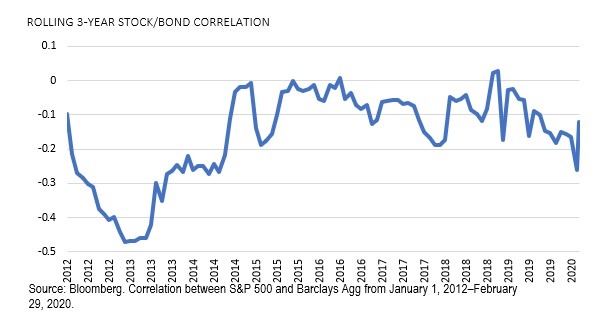
Looking at a longer time horizon shows a different story. Stocks and bonds have actually moved together more frequently than apart. Sometime in late 2001, the rolling 3-year correlation between stocks and bonds went from positive, as it had been for decades, to negative, where it has largely remained since.
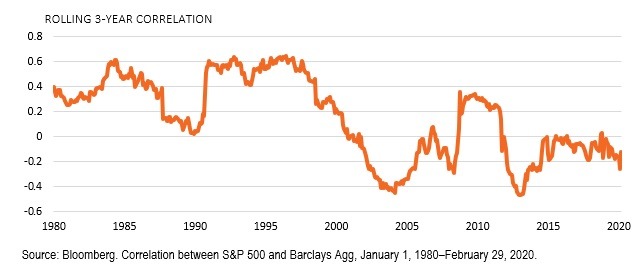
What drove this change in correlation? We believe it was the role of the central banks and accompanying investor behavior. Over the past several decades, central banks have stood ready to cut interest rates during times of recession risk in an attempt to regain financial stability. So, if equity markets saw signs of turmoil, central banks stepped in and lowered rates, boosting bond portfolios in the process. This reaction function, and the expectation by investors that the Fed will continue these policies, created the negative stock/bond correlation that has become the bedrock of portfolio diversification. However, as global yields have now plummeted to zero or even negative levels, we don’t believe this relationship will continue.
The current market crisis has illuminated this new reality. Bond exposures provided strong protection during the initial sell-off beginning February 20 as the Fed slashed rates to 0%. The unrelenting equity market decline has been accompanied by negative returns in fixed income, as investors questioned the economic benefit of holding bonds with such low levels of yield. A stark reality has emerged: There is little upside left in bonds—going forward, they may not provide a reliable hedge for investors.
Where to get diversification now
We’ve seen a lot more red than green in the markets lately, and traditional portfolio diversifiers are struggling.onventional safe-haven assets will continue to fail to protect from both equity and bond beta and volatility. But other options exist—investments that are mindful of beta, volatility and correlation whether markets are down, flat or up.
Many liquid alternatives possess these characteristics and are now proving their worth. These funds may capture exposures that are unique and robust but also sustainable through many market environments by investing in nontraditional ways. Dynamic strategies (trading long/short) identify distinct sources of return from structural, behavioral and risk-based dislocations that persist over time, making them compelling diversifiers.
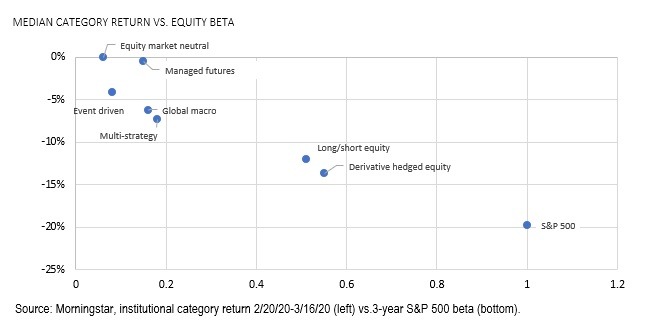
The chart below plots the universe of liquid alternative returns by Morningstar institutional category versus their equity market beta during the most recent sell-off. Unsurprisingly, those categories less exposed to equity markets have provided more meaningful diversification, as evidenced by their lower
drawdown rates.
Not all liquid alternatives have made good on their promises to be portfolio diversifiers, however. Just like in traditional portfolios, some liquid alternative funds have relied heavily on the equity market in recent years to generate strong returns, as evidenced by their high beta numbers. But this has also left them heavily exposed to equity market risk, and many are paying for it now. Those funds, which promised to be diversifiers, are leaving investors exposed to unexpected risks.
What now?
Given the dispersion in both return and risk statistics within the liquid alts category, we believe manager and individual fund selection is extremely important. Funds with low equity and bond beta, low correlation to equities, and low volatility offer the potential to provide the greatest diversification benefits. These return characteristics allow investors to mitigate downside risks, stay invested in the event of a correction, which is key given today’s uncertain market environment, and generate differentiated returns during ensuing flat or rising markets.
While no one knows how long this turbulence will last, we do know that volatility is a normal part of investing. It may not have materialized much over the past 10 years, but it’s here today. The past month has served as a wake-up call on how the diversification potential of traditional sources seemingly vanishes when markets get jittery. However, we believe there are options to stay invested and stay diversified in well-structured liquid alternatives, which may ultimately deliver a smoother ride toward financial goals.
The tide will certainly go out again. Our portfolios must be ready.
[1] Bloomberg. Correlation to the S&P 500 Index. International equities are represented by the MSCI EAFE Index. Emerging markets equities are represented by the MSCI Emerging Markets Index; REITs are represented by the FTSE NAREIT All Equity REITs Index. Commodities are represented by the S&P GSCI.