


By Karl Rogers, Managing Partner and Co-Founder of Athlon Family Office
- Over the past 20 years, allocating to a portfolio of recent top-performing managers does produce persistently better absolute returns than the market and its peers, while allocating to a portfolio of the recent worst-performing managers produces better returns than the average fund. Over the past 10 years, the market outperformed the top-performing manager portfolio, worst performing manager portfolio, and average return.
- Over the past 10 years, despite the top-performing manager portfolio producing better absolute returns, only the worst-performing manager portfolio brought in positive alpha.
- Choosing to allocate to a manager based on outperformance in an extreme year tends to lead to negative performance versus the benchmark over the following three years. These outlier managers show no consistency relative to the market.
INTRODUCTION Regulatory authorities require investment managers to put within their disclaimers ‘past performance is not an indication of future performance.' We all read it, but do we ignore it? Whether it is due to momentum strategies’ strong performance, recency bias, or the human desire to want the best, investors tend to put their money with the recent top performers. Is this a good strategy or a human bias? Many of our research notes study strategies and markets through an appropriate index, or average, return. We must always put in the caveat that, when using indices, there will be outperformers and underperformers. Similarly, when discussing research results with investors or managers, we hear, ‘’This may be the case; however, I know a Fund X that did very well that year.” In this short research note, we look to answer whether investing in a portfolio of top-performing managers is a strategy with positive expectancy across time or whether it is investors falling for human bias. We also seek to answer whether putting our money with individual top managers does lead to future positive return expectancy from them. TOP & BOTTOM MANAGER PORTFOLIO PERFORMANCE For this research note, we use fund data from our database partner, Nilsson Hedge. We isolated all funds that are classified as ‘Equity LS’ which provided us with a universe of around 113 different funds. We compared performance to the S&P 500, which was used as the market benchmark. We looked at annual returns from managers from 2000 – 2020, which takes in three separate and significant market drops and recoveries. We calculated the top-performing manager portfolio [‘top portfolio’] by identifying the managers that were in the 80th percentile and higher and formed an even-weighted portfolio of those managers for the following year. For example, we looked at all manager returns from 1999, isolated the managers within the 80th percentile of positively performing funds in 1999 and put together a portfolio of those managers for our 2000 performance. Similarly, for the ‘bottom portfolio’, we constructed our 2000 portfolio by identifying the managers that performed within the bottom 20th percentile of fund performance in 1999 and repeated this selection process for each subsequent year. To the delight of investors, Figure 1 below shows us that the top portfolio does produce persistently better returns than the other portfolios. Outperformance started around 2006 and significantly grew from 2013 onwards. The bottom portfolio showed strong outperformance during the first recession; however, it also showed worse performance during the GFC followed by consistent outperformance versus the average fund over that time period. 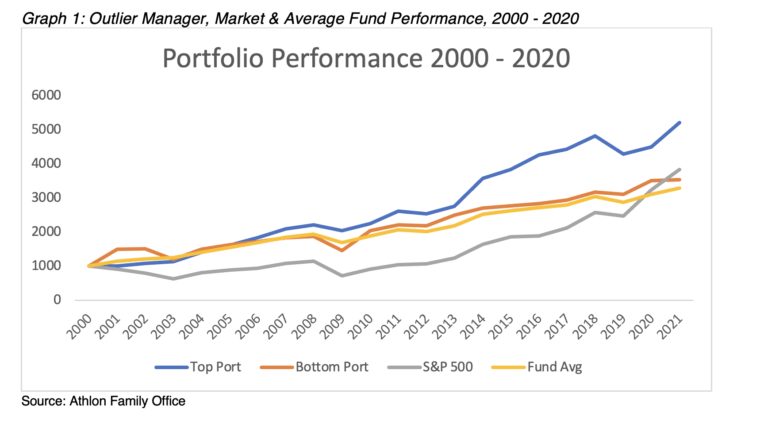 Graph 2 below looks at performance over the past 10 years. The market structure changed from the first half of the analysis period to the second half with Central Bank monetary policy intervention and ETF/Index investment gaining popularity and investment levels. The past 10 years shows more sobering results as all three portfolios underperformed the market by a significant margin. The past 10 years also shows the top portfolio outperforming both the average fund portfolio and bottom portfolio with similar relative results between the bottom portfolio and average fund return.
 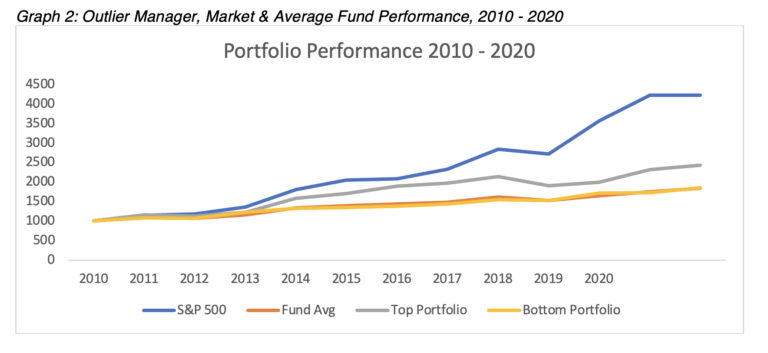 DO BETTER RETURNS EQUAL BETTER ALPHA? Does the top portfolio’s absolute return outperformance relative to its peers mean that they also bring in alpha outperformance? As many allocators say, we want to pay performance fees for idiosyncratic risk performance (alpha), not systematic risk performance (beta). While correlation looks at the co-movement of two assets, the beta co-efficient adjusts for the magnitude, or volatility, of returns. Alpha is not generated from higher returns as a function of bigger swings in the same direction as the market. We look at the recent 10-year period and calculate the peer portfolios (top, bottom, and fund average) alpha generation of each portfolio. Table 1 below shows us that despite the top portfolio providing persistently better absolute returns, its strong relationship with the market means that it provides negative alpha while the bottom portfolio is the only one of the three portfolios to provide positive annualised alpha over the same 10-year period.
 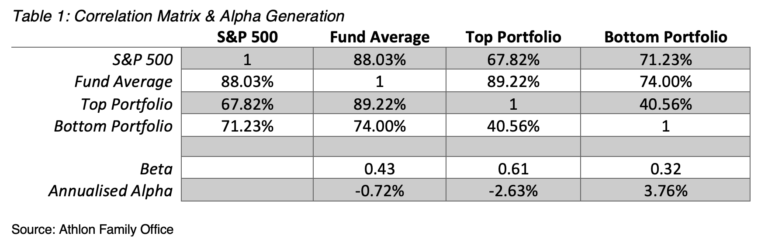 IS THERE PERSISTENCY FROM AN OUTLIER MANAGER? While there is persistency of better absolute returns in a top manager portfolio versus their peers, we seek to answer the question of whether there is persistency of better performance at an individual manager level. The top portfolio looks at the top-performing managers across the entire universe each individual year. This can lead to significant turnover of managers an investor would be invested with on a year-to-year basis. Although investors don’t have that level of manager turnover, many investors change managers after an extreme year. This section seeks to analyse the future performance of managers who were outliers during recent extreme years. For this section, we study the top and bottom performers during the GFC drop of 2008, the large positive move in 2013 and in 2018, which was the first down year since 2008 driven by significant volatility and losses in Q4 of that year. Table 2 below shows us that allocating to a portfolio of top-performing managers from 2008 significantly underperformed the market the following two years with only a small outperformance three years later, while the bottom portfolio outperformed the market the following years before underperforming the market again in the third year.
 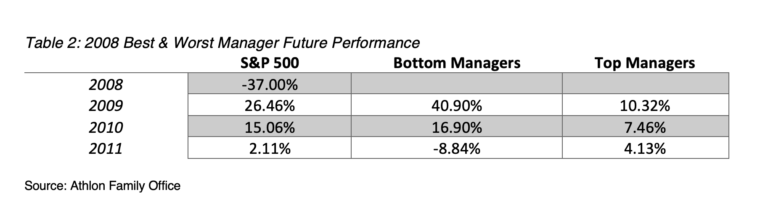 Table 3 below shows us that whether allocating to either the top or bottom manager portfolio following the 2013 bull run, you would be left with underperformance the following year, outperformance the second year and underperformance again in the third year.
 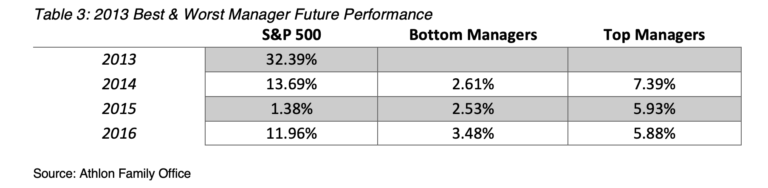 Table 4 below shows us that allocating to top portfolio from 2018 led to three successive underperforming years, while the bottom managers portfolio led to underperformance the following two years and outperformance during the third year.
 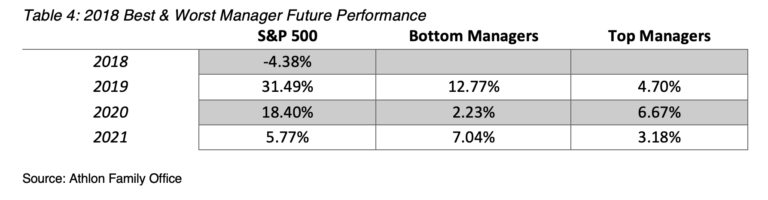 CONCLUSION & FURTHER THOUGHTS This research notes’ findings must be caveated that it only looked at the managers within the database and so is not fully exhaustive. The manager universe also included non-US-focused Equity LS managers while we used the US S&P 500 as their benchmark. There is also a degree of survivorship bias within the research as some funds stopped providing their returns as they ceased operations or stopped reporting their returns. When allocating to the best and/or worst-performing managers during extreme years, we see a consistent trend of consistency. In light of this, and given allocation reshuffles due to the events of 2020, we caution investors against putting money in with the recent top performers as a function of that statistic as it tends to lead to future underperformance relative to the market. This makes sense to us as certain strategies trade set ups, and managers do well under certain conditions and worse under different conditions. Given each year brings new challenges, volatility levels, and events, we should not expect a) the same manager to be in the top performance bracket within the different market conditions and b) the return to investors to be similar to absolute levels within different market conditions. This research can be furthered by analysing more asset classes and strategy types, using more focused regional benchmarking and adjusting for turnover levels and any transaction costs from redeeming and reallocating to multiple managers on a yearly basis. This research note was produced by Athlon Family Office in conjunction with our hedge fund database partner, Nilsson Hedge. ABOUT THE AUTHOR Karl Rogers is Managing Partner & Co-Founder of Athlon Family Office which invests in each of its three arms across Private Equity, Trade Finance & Hedge Funds. Karl founded ACE Capital Investments - an Ireland-based alternative investments consultant which specializes in identifying niche, capacity-constrained hedge funds that diversify Family Office portfolios from their traditional investments. Karl also runs a trading floor as the Head of Trading, US Power for RISQ Energy Ltd. where he is responsible for building out the proprietary US Power Trading Desk, strategy development, capital allocation and sits on the firm’s Risk Committee. Karl sits in the Adjunct Faculty for Trinity College Dublin’s M.Sc. In Finance Program where he is both a Guest Lecturer in their Alternative Investments module and supervises the student’s theses. He has published macroeconomic research with the International Advances in Economic Research journal and has produced research notes across a variety of strategies, asset classes, and topics which were published on various industry publications including CAIA, AlphaWeek, the ETF Stream, Family Capital Publishing & the FM Report. Karl has been referenced in industry platforms including The Wall Street Journal, Bloomberg & CAIA’s ‘Chronicles of an Allocator’ and speaks at investment conferences as an alternative investment expert across multiple continents.