
By Lalit Ponnala Director, Global Research & Design, S&P Dow Jones Indices.
In a previous blog, we highlighted the objective of the S&P Multi-Asset Dynamic Inflation Strategy Index and summarized its methodology. We justified our strategy choice for each inflation regime (high, medium, low) and illustrated how the index dynamically switches between these strategies based on a monthly inflation forecast. In this blog, we will take a closer look at the performance of the index in comparison to its underlying strategies and demonstrate some possible advantages of the dynamic switching approach.
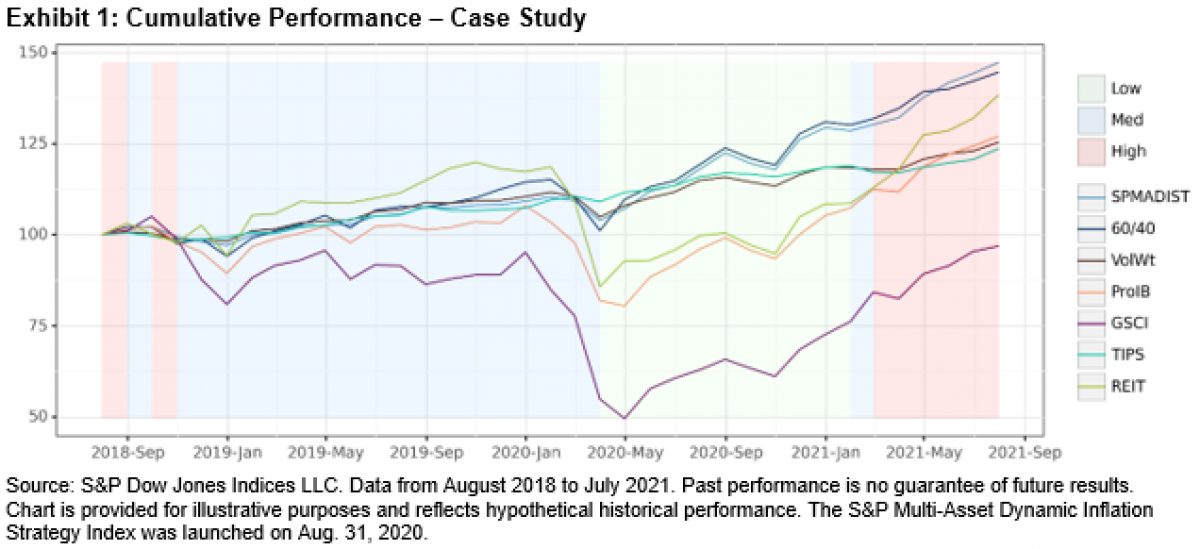
During a recent three-year period ending July 2021 (see Exhibit 1), we see that the S&P Multi-Asset Dynamic Inflation Strategy Index (SPMADIST) outperformed its component strategies as well as some of the popular “inflation hedge” asset classes, such as broad commodities (GSCI), real estate (REIT), and inflation-protected bonds (TIPS). To understand how the index achieved this, let us examine the inflation regimes in detail.
Based on our definitions, inflation stayed in the medium regime until February 2020, during which time the volatility-weighted (VolWt) strategy took effect. This led to gains from exposure to fixed income (Bonds, TIPS), which had relatively lower volatility. During the low inflation regime that followed, the index switched into the 60/40 strategy, outperforming REIT and GSCI, which were particularly hard hit during the early months of the COVID-19 pandemic. Starting March 2021, higher CPI (YoY) readings led the index to switch into the pro-inflation beta (ProIB) strategy, which yielded strong returns due to being overweight GSCI and Gold.
Cumulatively, over the course of the three-year period, the observed outperformance of the index is the result of these dynamic adjustments. This case study demonstrates how the switching mechanism could enhance the performance of the index as the inflation regime changes over time.
Performance Attribution
To assess how the dynamic index times its exposure to the underlying asset classes, we ran a performance attribution analysis over the same three-year period, treating each strategy as a separate benchmark. The results (see Exhibit 2) indicate that in comparison to 60/40, the index performance was adversely affected by its GSCI exposure, but this was more than compensated for by gains from its exposure to Bonds, Gold, and TIPS, leading to an outperformance of 1.46%. While this may not seem significant, it is important to note that this outperformance is achieved with lower volatility, leading to a higher risk-adjusted return.
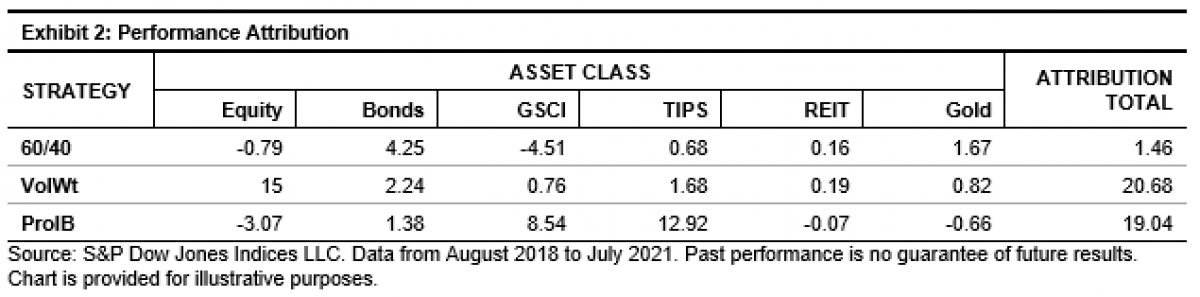
The index exhibited stronger outperformance in comparison to VolWt primarily due to its higher equity exposure, as well as better timing of its exposure to Bonds and TIPS. The ProIB strategy had a higher exposure to GSCI and lower exposure to TIPS, which explains the bulk of its underperformance relative to the index over the entire three-year period.
Correlation to Unexpected Inflation
During periods of rising inflation, we are likely to obtain inflation readings higher than expected for several months in a row. For our index to effectively hedge inflation during such periods, its performance must be positively correlated to unexpected inflation. If the forecast of CPI (YoY) is considered the “expected” inflation rate for a given month, then the unexpected portion would be the excess (i.e., above the “realized” inflation) for that month.
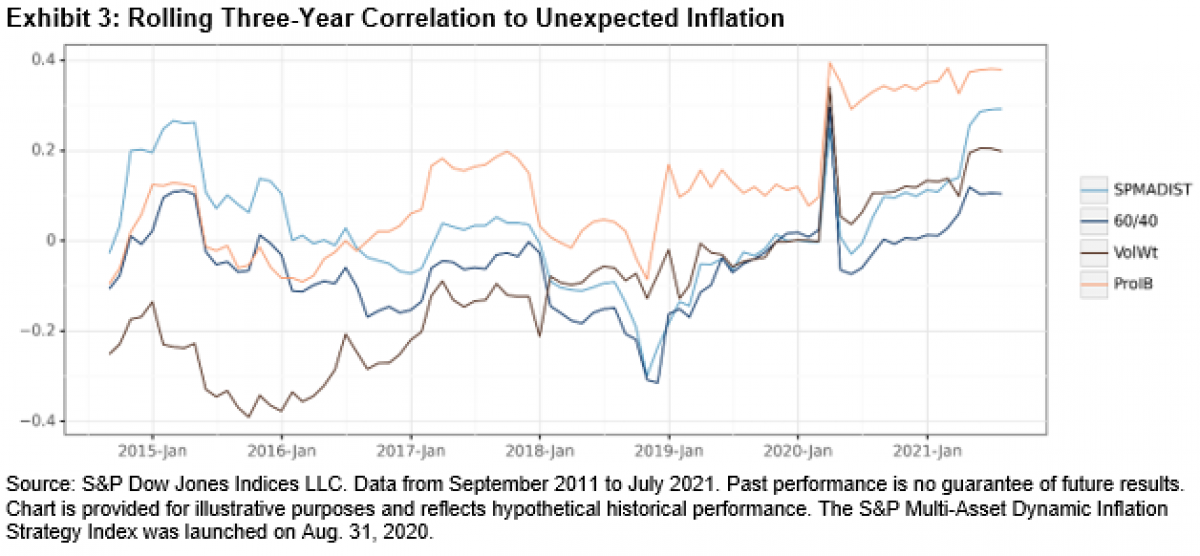
Exhibit 3 illustrates that the dynamic index had a relatively better correlation to unexpected inflation compared to some of its component strategies. While ProIB had a higher correlation overall, its performance was affected by significantly higher volatility and more severe drawdowns.
About the Author:
Lalit Ponnala is Director, Global Research & Design at S&P Dow Jones Indices (S&P DJI). In this role, he is responsible for the conceptualization, research, and design of factor-based indices and strategic solutions across multiple asset classes.
Prior to joining S&P DJI in 2019, Lalit was a data scientist at FINRA, where he developed machine learning models for detecting cross-asset manipulation. Before that, he was a risk analyst at KCG Holdings and a quantitative analyst for alternative investments at RBC Global Asset Management.
Before joining the finance industry, Lalit was a postdoctoral researcher in high-performance computing applications at Cornell University. He holds a Ph.D. in electrical engineering with a minor in statistics from North Carolina State University.