


By Alex Botte, CFA, CAIA, Head of Client and Portfolio Solutions at Runa Digital Assets, LLC, an investment firm specializing in digital asset portfolios.
Introduction
As Blockworks (a digital asset media company) stated in their Crypto State of the Union webinar in July, “risk management may not be sexy in bull cycles. But in periods of high volatility, guardrails look pretty attractive.”[1] In the past few months, there have been a few notable crypto blowups that were at least partly due to poor risk management. We believe that crypto needs more risk management at all levels, including asset management. One piece of this equation is modeling crypto’s high volatility and understanding key drivers of risk in digital asset portfolios.
A few months ago we wrote our first piece in a series that attempts to build the framework for a digital asset specific risk factor model. In that piece, we proposed a foundational risk factor in the model – “crypto beta” – which represents broad crypto market risk in portfolios. The next step in this journey is to see whether it makes sense to include risks in the model that impact traditional asset classes.
Historically, it was the case that digital assets had little relationship with the largest asset classes in investor portfolios, stocks and bonds. For example, this Two Sigma paper found that over the period January 2015 to March 2021 only 9% of Bitcoin’s risk was explained using a traditional risk factor model that included factors like equity, duration, and commodities. Of the 18 factors in the model, only three (one of which was equities) were statistically and economically significant. Academic papers have arrived at similar conclusions. For example, Liu and Tsyvinski (2018) and Hu, Parlour, and Rajan (2019) found that crypto returns cannot be explained by crypto’s relationships with other asset classes.
Over more recent periods though, that story may have changed. There have been plenty of charts like the one below demonstrating that Bitcoin’s correlation with the NASDAQ is at all time highs. Additionally, there has been a plethora of tweets, news articles, and podcasts commenting on how crypto markets are being driven by the same factors that impact traditional markets – higher interest rates to combat rising inflation at the risk of an economic recession.[2]
Bitcoin’s Correlation with the NASDAQ 100

Source: Bloomberg.
Given the importance of the macro environment and the increasing correlations between crypto and stocks, we think these relationships are critical to consider and monitor. The objective of this article is to determine whether it makes sense to add certain macro factors to a crypto-specific risk factor model alongside crypto beta (or the crypto market factor). We begin by providing an explanation of the data used in the analysis. We then analyze crypto’s relationships with traditional market risk factors and determine which of these factors (if any) makes sense to include in a crypto-specific risk factor model. Finally, we test the updated risk factor model by applying it to a sample portfolio made up of liquid digital assets.
Data Explanation
We’ll provide a brief explanation of the data used before diving into the analysis.
We will model digital assets using four different proxies: Bitcoin, Ethereum, the top 100 assets weighted by market capitalization, and the top 100 assets equally weighted. The source for the crypto data is Messari. We selected the top 100 assets and removed stablecoins, wrapped assets, and assets with poor data (either low quality data or missing data). The market cap and equal weighted indices are rebalanced daily.
We will analyze the relationship of those four digital assets relative to several traditional asset classes:
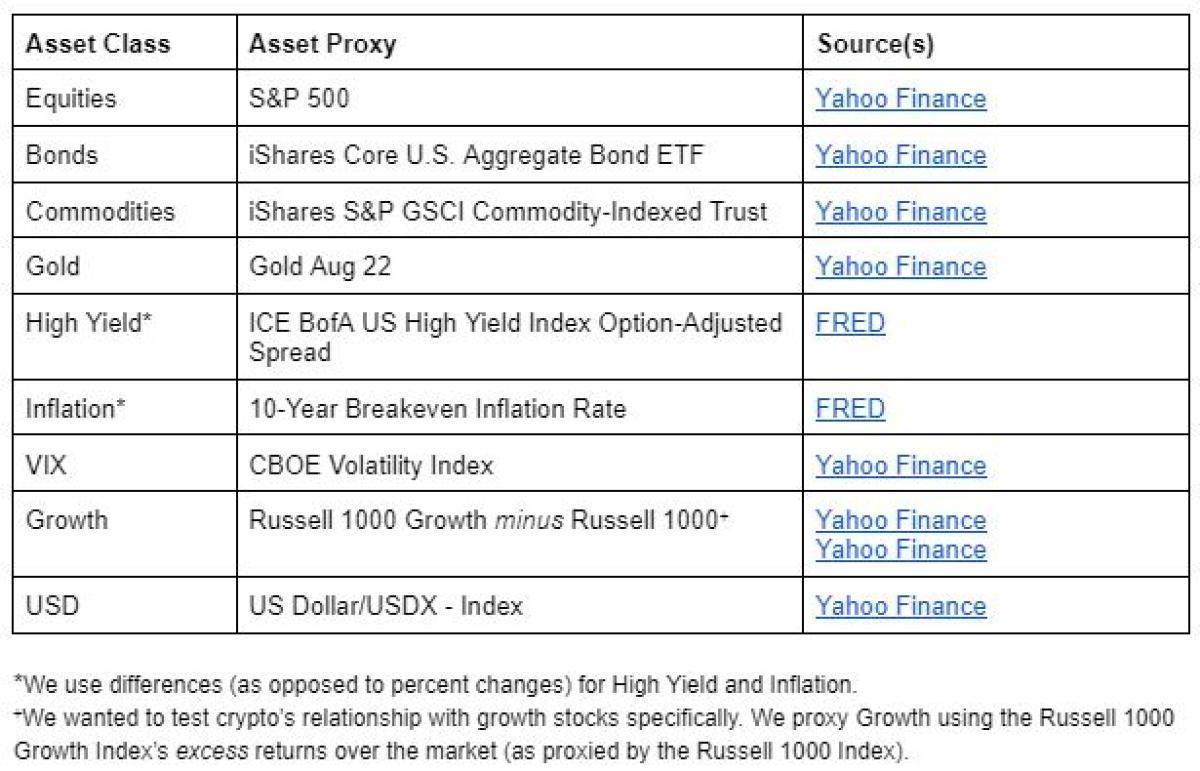
Crypto and traditional markets are not always open at the same time, as digital asset markets operate 24/7/365, unlike traditional markets. Therefore, we will use rolling five day summed returns to account for the asynchronicity.
Finally, our analysis period begins in June 2017 and ends in May 2022. While a five year period might not seem very long, this includes a large portion of crypto’s history (after all, Bitcoin started in 2009 and Ethereum in 2015). It also includes multiple crypto market cycles and downturns, such as the 2018 crypto “winter,” the March 2020 COVID-related crash, as well as the implosion of Terra (a crypto-specific event in May 2022). And from a macro perspective, we should note that this period was dominated by extraordinary amounts of monetary and fiscal stimulus globally, supply chain issues, and a strong investor preference for growth assets.
Analysis
The first analysis we’ll look at is the multi-year correlations of crypto with the various traditional asset classes.
For the most part, digital assets look like another risky asset. They exhibited the strongest relationships with Equities and the VIX, which themselves had a -72% correlation over this period. There was also a positive relationship with Commodities, a negative correlation with the USD (perhaps indicating that crypto struggled in “flight to safety” periods where there was high demand for USD), and negative correlation with High Yield (spreads widening or increasing, indicative of worsening credit conditions, was a poor environment for crypto).
Crypto’s positive relationship with Gold, which is often viewed as a safe haven asset, seems to buck that trend – perhaps in part supported by the narrative that Bitcoin is “digital gold.” There’s also a notable positive relationship with Inflation, and positive, but less strong, correlations with Bonds and Growth.
It’s important to note the y-axis of this exhibit, which is quite small in magnitude. We also don’t know if these relationships are statistically significant (we will get to that later). Before we do that though, let’s analyze how these relationships have changed over time.
Correlations Between Crypto and Traditional Asset Classes
Period: June 1, 2017 - May 31, 2022, using rolling five day data. Sources: Messari, Yahoo Finance, and FRED.

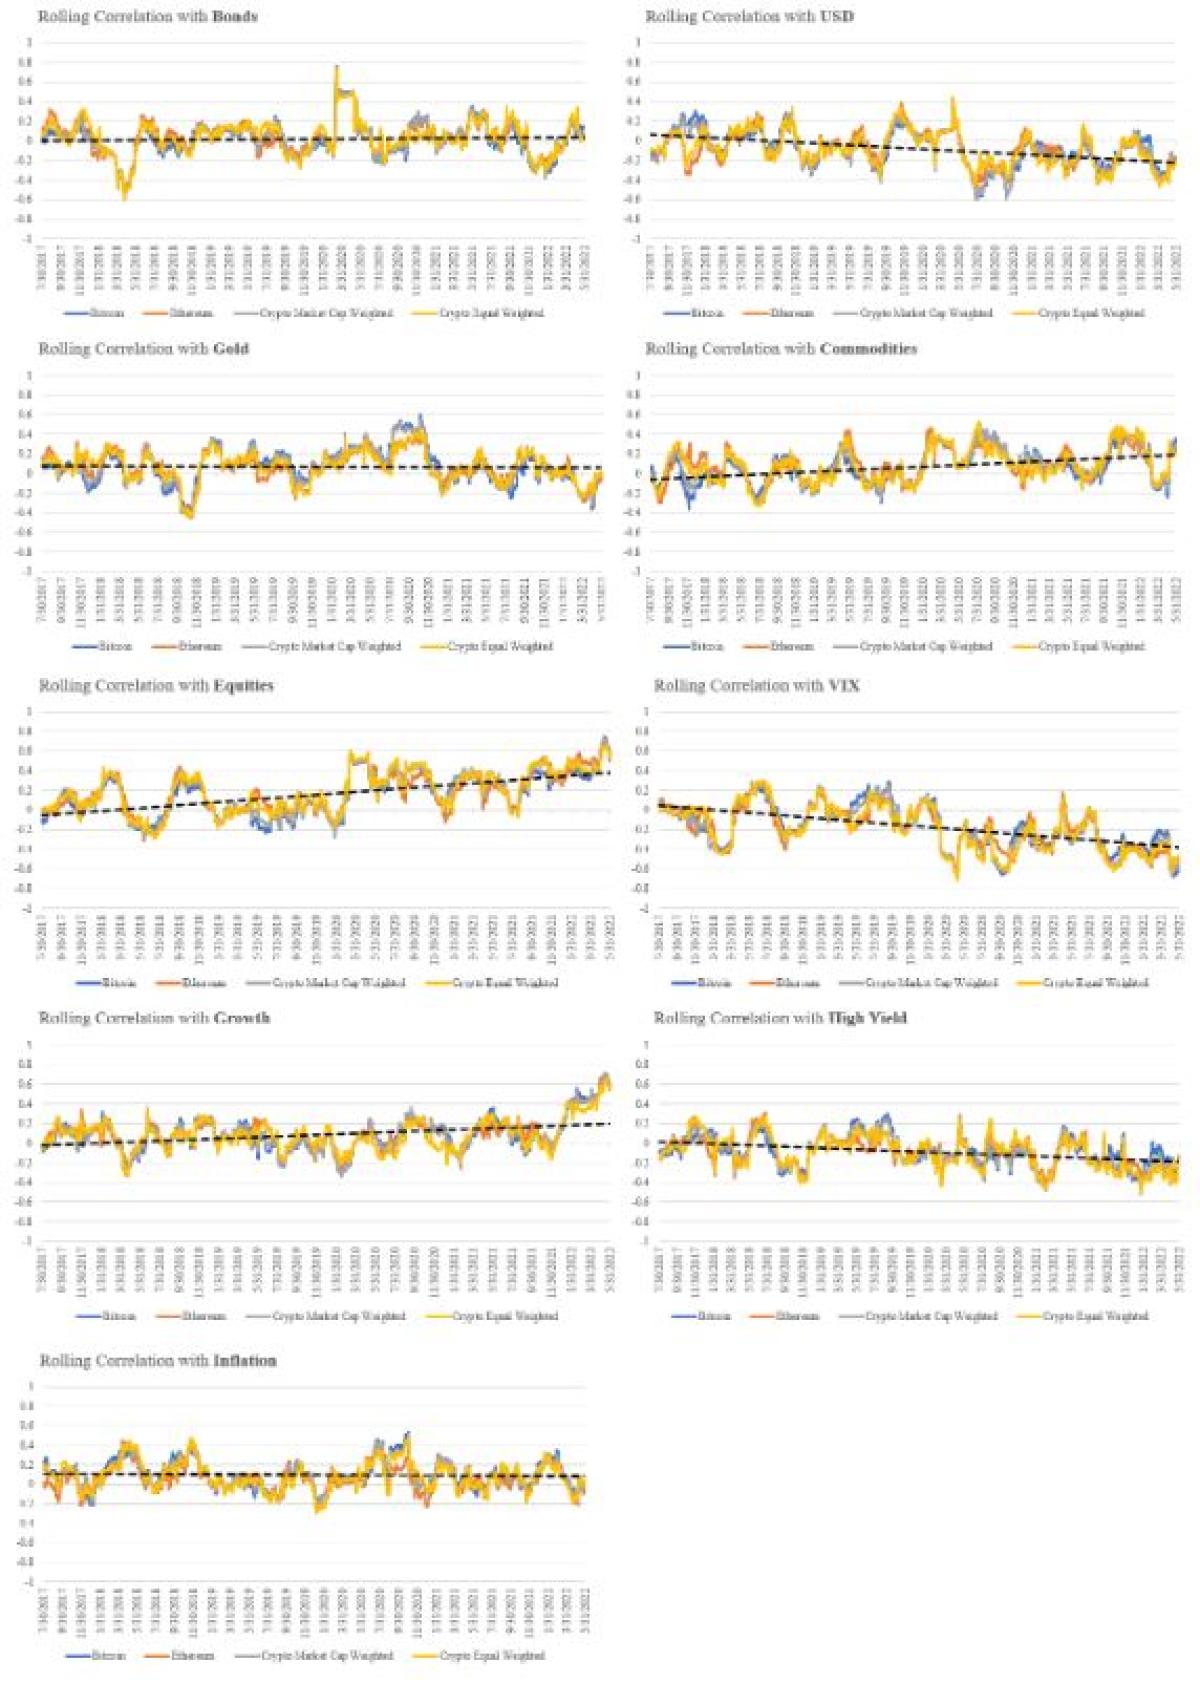
Similar to the findings in this academic paper[3], we did not find evidence that crypto has started to correlate more to several of these assets over time, including Bonds, Gold, and Inflation. The clearest trends exist for Equities and the VIX, which have been notably increasing and decreasing respectively. These two charts are effectively telling us the same story, which is that digital assets have become increasingly correlated with moves in the equity market (remember that when VIX spikes, equities are typically falling, and crypto falling too). The correlation has reached all time highs recently, as we showed in the Bloomberg exhibit in the Introduction.
Trends in Correlations Between Crypto and Traditional Asset Classes
Period: June 1, 2017 - May 31, 2022, using rolling 60 day data. Sources: Messari, Yahoo Finance, and FRED. The black dotted lines represent the trendline for the Bitcoin relationship, which can serve as a proxy for crypto (instead of having four individual trendlines for each crypto proxy).
Next, let’s analyze how these correlations vary depending on whether the traditional asset class is up versus down. Similar again to the findings in this academic paper[4], in times where traditional markets are up, crypto has limited correlation. Indeed, when Equities were positive, the average correlation between Equities and digital assets was just 6%. However, correlations rose dramatically in down markets, especially for the naturally riskier assets. In particular, we find that the correlation between digital assets and the VIX moves from -6% in times of falling VIX to -26% when the VIX was rising. This is an important consideration for investors with multi-asset class portfolios – while digital assets offered diversification benefits in rising and perhaps more tranquil markets, in drawdowns, this advantage eroded.
Correlations Between Crypto and Traditional Asset Classes in Up and Down Periods for Traditional Asset Classes
Period: June 1, 2017 - May 31, 2022, using rolling five day data. Sources: Messari, Yahoo Finance, and FRED.

The final section of the analysis will determine if the relationships between crypto and each traditional asset class were statistically significant. We do this by running univariate regressions with crypto as the dependent variable and the traditional asset class as the independent variable.[5]
The factors that exhibited statistically significant relationships (those with t-statistics above an absolute value of 2) were USD, Gold, Commodities, Equities, VIX, and Inflation. We will consider these factors for inclusion in the second layer of the factor risk model, alongside “crypto beta.”
Univariate Regression Results of Crypto on Traditional Asset Classes
Period: June 1, 2017 - May 31, 2022, using rolling five day data. Sources: Messari, Yahoo Finance, and FRED.
Every univariate regression has two numbers. The first number is the beta coefficient, which measures the sensitivity of the crypto variable to changes in the traditional market variable. For example, the 1.30 beta coefficient between Bitcoin and Bonds means that for every 1% that Bonds returned, Bitcoin returned 1.30% on average. The second number is the t-statistic, which assesses whether the beta coefficient is statistically different from zero. T-statistics greater than an absolute value of two are deemed to be statistically significant. Continuing with the Bitcoin/Bonds example, the 1.24 t-statistic means that we cannot conclude that the 1.30 beta coefficient is statistically different from zero - in other words, it is statistically insignificant. The t-statistics use standard errors that are heteroscedasticity and autocorrelation robust. Results in gray are not statistically significant.

Factor Selection
Now we come to the question of which of these traditional asset classes to add to our crypto risk factor model. We can discard Bonds, Growth, and High Yield, which did not consistently demonstrate statistically significant relationships with the four digital assets proxies. Should we then simply include the other six?
Correlations between these traditional markets can be quite high. As mentioned earlier, the VIX and Equities exhibited a -72% correlation over this multi-year period. Correlations can even be higher during shorter periods, especially in times of market stress. If we add all six factors to the model, this collinearity can cause issues with producing reliable beta coefficient estimates, since those beta coefficients will be estimated jointly, and the model will have a difficult time assigning risk to factors that are meaningfully correlated. We saw this in our research for the recent period where a beta coefficient estimate for the USD factor showed a directionally different sign in the multi-factor model than it did in a single factor model.
We also want to keep the factor set small and parsimonious since we will likely eventually expand the factor model to include crypto-specific risks (sectors and/or ecosystems) and perhaps long/short style factors (e.g., momentum, liquidity, and size). We need to be careful about adding too many factors especially given the short return history of many portfolios, which will be the dependent variable when applying this factor model.
So to reduce collinearity and an excessive number of factors in the model, we will simplify the traditional market explanatory factor set to two factors: Equities and Inflation.[6] Equities will serve as both a proxy for risk-on/risk-off dynamics in macro markets as well as for economic growth expectations (equities are driven largely by exposure to economic growth, plus a modest premium for inflation and interest rate exposure[7]). Inflation will be modeled by changing inflation expectations. As Ray Dalio, the founder of Bridgewater said, “I knew which shifts in the economic environment caused asset classes to move around, and I knew that those relationships had remained essentially the same for hundreds of years. There were only two big forces to worry about: growth and inflation.”
We’ll add these two factors alongside the crypto beta factor (that we identified in our first research piece here) so that we can identify how much risk in a portfolio is being driven by macro risks versus risks specific to crypto markets. We will call the crypto beta factor “Crypto Market.” As discussed in our previous article, there are many ways you can construct this factor. Examples include a market-cap weighted index of the top digital assets, BTC, ETH, or some combination of BTC and ETH.
For this analysis, we will use the “Crypto Market Cap Weighted” index that we used in the analysis above. As a reminder, it is constructed using the top 100 digital assets, excluding stablecoins, wrapped assets, and assets with poor data. It is weighted by market cap and rebalanced daily. We then residualize it to Equities and Inflation. This will effectively allocate any shared risk between crypto and macro to the two macro risk factors, leaving the Crypto Market factor representing risks that are unique to digital asset markets.
Applying the Model to a Digital Asset Portfolio
The purpose of building this risk factor model is for asset managers with liquid token portfolios to better understand and manage the risks in their portfolio. So let’s test this three-factor model on a liquid token portfolio. We’ll use one of the most widely used benchmarks in the liquid digital asset space, the Bloomberg Galaxy Crypto Index, to construct a pro-forma, daily rebalanced portfolio using the index’s weights as of March 2022.[8] This portfolio is allocated across Currencies, Protocols, DeFi, and Utilities.
Portfolio Allocations (Using the Recent Weights of the Bloomberg Galaxy Crypto Index)
Source: Bloomberg Galaxy Crypto Index March 2022 fact sheet.

We regressed the returns of the portfolio on the three factors for a multi-year period that began at Uniswap’s inception in September 2020. We found that the model explained 82% of the risk in the portfolio, and the portfolio exhibited statistically significant positive relationships with all three factors (t-statistics above an absolute value of ~2). The portfolio had about the same risk as the overall crypto market (the Crypto Market beta coefficient was close to 1). Its 1.96 beta coefficient to Equities indicates that the portfolio returned approximately double the magnitude of the equity market’s return on average (e.g., when equities markets were up 1%, the portfolio was up 1.96% on average). Finally, the portfolio exhibited a small (but significant) positive relationship with Inflation – when the breakeven inflation rate rose by 10 basis points, the portfolio was up 2 basis points on average.
Note that the coefficients alone do not tell us the extent to which each of these factors contributed to the risk of the portfolio. Instead, these coefficients give us insight into the correlations between the factors and the portfolio (all correlations were positive), as well as differences in volatilities between the factors and the portfolio (e.g., the portfolio exhibited higher volatility than the Equity factor, which is reflected in the relatively high beta coefficient). Further analysis showed that the portfolio’s relationship with the Crypto Market factor contributed about 77% to the portfolio’s risk, while the Equity and Inflation factors contributed 19% and 4% to the portfolio’s risk, respectively.
Multi-Factor Regression Results of Crypto Portfolio on the Three Factor Model
Period: September 27, 2020 - May 31, 2022, using rolling five day data. Sources: Messari, Yahoo Finance, and FRED. The t-statistics use standard errors that are heteroscedasticity and autocorrelation robust. Results in gray are not statistically significant.

We also ran rolling 60 day regressions to see how well the model performed on this portfolio over time. As mentioned earlier, the model explained 82% of the risk in the portfolio over the full period (measured by adjusted r-squared).[9] We plot the rolling adjusted r-squared below and find that the model’s explainability generally increased, and was in the 95% range for most of 2022.
Rolling Adjusted R-Squared
Period: September 27, 2020 - May 31, 2022, using rolling 60 day data. Sources: Messari, Yahoo Finance, and FRED.

We also show the rolling factor coefficients and t-statistics. The portfolio’s exposure to the Crypto Market factor has been the most consistent with a steady coefficient hovering around 1 that was always statistically significant. The portfolio’s exposures to the macro factors were more volatile. The Equities exposure was almost always statistically significant and positive, but fluctuated quite a bit in terms of magnitude, while Inflation exhibited more insignificant periods and even some that were negative. This is an important consideration for investors, as there are periods where the macro environment is increasingly important for crypto, and crypto may therefore be less diversifying to a multi-asset class portfolio.
Rolling Factor Coefficients
Period: September 27, 2020 - May 31, 2022, using rolling 60 day data. Sources: Messari, Yahoo Finance, and FRED.

Rolling Factor T-Statistics
Period: September 27, 2020 - May 31, 2022, using rolling 60 day data. Sources: Messari, Yahoo Finance, and FRED. The t-statistics use standard errors that are heteroscedasticity and autocorrelation robust. The black dotted horizontal lines represent the statistical significance thresholds.

Overall, this model appeared to do a good job of explaining risk in this digital asset portfolio. It offers us insight into which factors – macro versus crypto-specific – are responsible for portfolio risk. A portfolio manager could use a model like this to decompose the risk and returns of the total portfolio, each sector, and each token by their factor drivers in an effort to better understand and manage their exposures.
Conclusion
Given the inflationary shock, rising interest rates, recession fears, and all eyes on the Federal Reserve’s next move, it is no wonder that macro is an important driver of most assets right now, including digital assets. Crypto’s correlation to risk assets like equities has reached record highs recently.
We also know from prior research that crypto’s largest assets, like Bitcoin, cannot be well explained by traditional risk models alone, which is why, in the first piece of this series, we suggested starting with a crypto market factor (or crypto beta) as the foundational factor in a crypto-specific risk model. Then, in this piece, we aimed to expand on our single factor model by including a small, but relevant set of macro-related factors. After our analysis, we suggest adding two key drivers of macro markets to the model: Equities and Inflation.
We believe this multi-factor risk model framework that includes traditional market risks brings value to those managing digital asset portfolios, as they can understand the significance of macro versus crypto-specific risk drivers in their portfolio. We believe there is also an application for the multi-asset class investor that has (or is seeking to add) crypto exposure to their portfolio. In certain market regimes, like the one we are in now, where macro is an important driver of all risk assets, the diversification benefits of crypto may be less than they have been in the past.
Footnotes:
[1] https://papers.ssrn.com/sol3/papers.cfm?abstract_id=4124576
[2] https://papers.ssrn.com/sol3/papers.cfm?abstract_id=4124576
[3] Univariate regressions focus on determining the relationship between one independent variable (in our case, the traditional asset classes) and one dependent variable (in our case, crypto). We run separate regressions for each traditional asset class, as we want to estimate the relationship between crypto and each traditional asset class independently.
[4] Note that one can always run univariate regressions to see how their portfolio is impacted by one of the traditional asset classes that we ended up excluding from our factor set.
[5] https://www.blackrock.com/institutions/en-axj/insights/factor-perspectives/macroeconomic-factors
[6] https://assets.bbhub.io/professional/sites/10/BGCI-Factsheet-Mar-22.pdf
[7] R-squared is the percentage of variation in the dependent variable (in this case, the crypto portfolio) that can be explained by a factor model (in this case, a three-factor model consisting of Crypto Market, Equities, and Inflation factors). Adjusted r-squared is a modified version of r-squared that considers the impact of adding additional factors to the model. In this case, a high adjusted r-squared value indicates that the three-factor model did a good job explaining the risk of the crypto portfolio.
[8] https://blockworks.co/webinars/crypto-state-of-the-union-trading-risk-management/
[9] Examples:
https://twitter.com/RyanSAdams/status/1536423066980519937?s=20&t=m4PQAtxTk_ATTrRq8y_WMg
https://www.nytimes.com/2022/05/11/technology/bitcoin-price-crashing-stocks.html
https://www.barrons.com/articles/bitcoin-crypto-federal-reserve-51655280416?mod=bol-social-tw
About the Author:
Alex Botte, CAIA is the Head of Client and Portfolio Solutions at Runa Digital Assets, an investment firm specializing in digital asset portfolios. In this role, Alex is responsible for the investment risk framework, chairs the Risk Committee, and contributes to content, portfolio analytics, research, and client engagement. Alex was previously a Vice President at Two Sigma, where she produced investment management-related content and helped with the development of the firm's factor-based risk analytics platform, Venn. Prior to Two Sigma, she was at AQR Capital Management, where she most recently served as a Product Specialist for the firm’s Global Asset Allocation strategies. Prior to AQR, she worked in Prime Services at Barclays. Alex holds a Bachelor’s of Science in Applied Economics and Management from Cornell University.

A special thank you to Robert Gingrich, PhD, Farhan Mustafa, CFA, Ilya Kulyatin, Jennifer Murphy, CFA, and Max Williams for their helpful contributions and edits to this article.
This article (i) is only for informational and educational purposes, (ii) is not intended to provide, and should not be relied upon, for investment, accounting, legal or tax advice, and (iii) is not a recommendation as to any portfolio, allocation, strategy or investment. This article is not an offer to sell or the solicitation of an offer to buy any securities or other instruments.