


By Christopher Carrano, Vice President at Venn by Two Sigma.
Key Takeaways
- How the relationship between bitcoin and equities develops will likely have huge implications for the role crypto will come to serve in institutional portfolios.
- Early correlations between bitcoin and equities were often negative, prompting many to think of long bitcoin exposure as an alternative.
- Using Venn analysis, we find that over recent 6-month periods as much as 66.29% of bitcoin’s risk can be explained by our Equity Factor, prompting reconsideration of bitcoin’s role as an alternative.
As more institutional investors consider incorporating crypto sleeves into their portfolios, we have seen a meaningful change in bitcoin behavior and its relationship with equities. How this relationship develops, in our view, will likely have huge implications for the role of crypto in institutional portfolios.
Going back to 2010, bitcoin’s rolling 1-year correlation with broad equities has often been negative. This led many capital allocators to think of long bitcoin exposure as an alternative. However, recently the relationship has changed. The chart below shows how the correlation between bitcoin and equities is among all-time highs, sitting just south of 0.65!
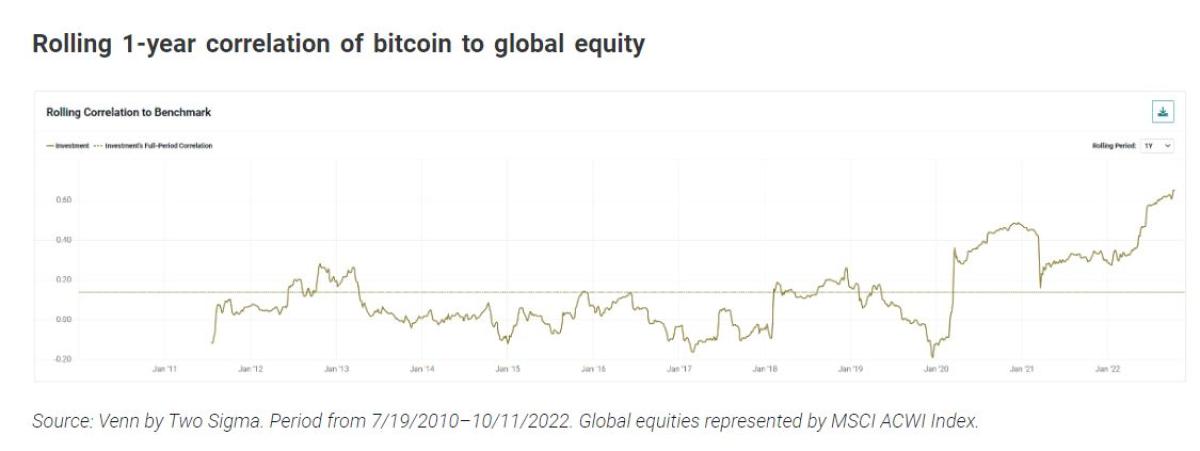
But is this just temporary? Will bitcoin once again return to being a strong equity diversifier? Perhaps this is just noise. After all, spurious correlations are nothing new.1
While we don’t know the future of bitcoin, we can provide some conviction that movements in our equity factor have been predictive for this cryptocurrency.
The mystery of what is driving bitcoin
Utilizing Venn’s Two Sigma Factor Lens and bitcoin reference rates, we can attempt to explain bitcoin’s risk going back to 2010. It turns out, 95.84% of bitcoin’s risk cannot be explained by our factor lens (residual). An uncommon result, to say the least.2
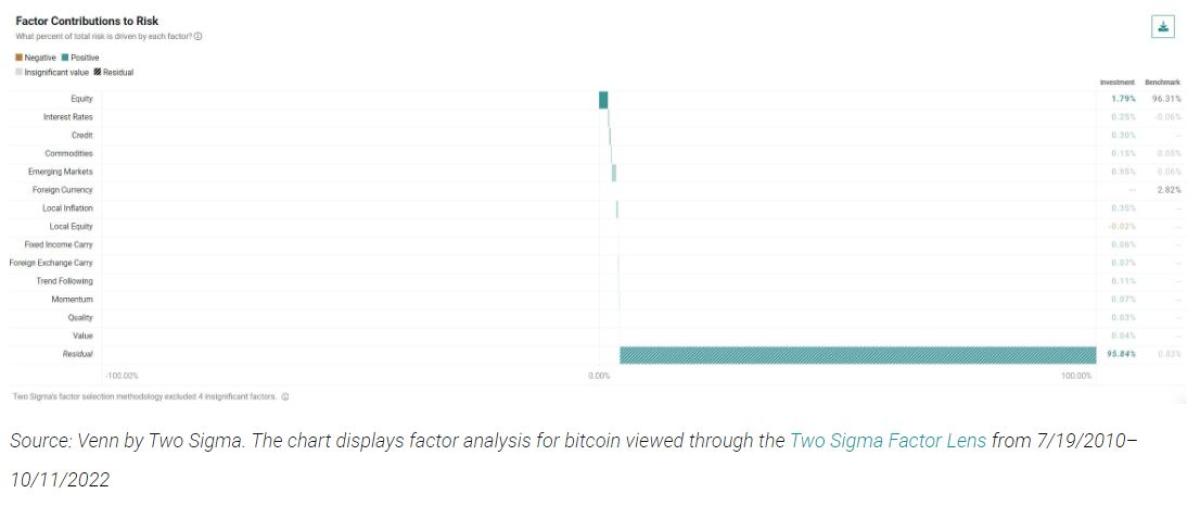
The fact that over this full period Venn identifies almost none of what was driving bitcoin’s risk highlights its uniqueness. This is one reason we are actively researching whether there exists a crypto market factor, and whether or not we should include it in our factor lens.
But didn’t we just say “movements in our equity factor have been predictive for bitcoin”?
Analyzing the crypto trend
One of Venn’s core competencies is helping provide transparency into what is driving risk and return over time. This very often uncovers important narratives that full-period analysis misses. In addition, we can adjust these time periods to be as short as 6 months, allowing us to analyze smaller windows of risk.
For example, in pink we show the percent of bitcoin’s risk that we can’t link back to movements in our factors (residual) over rolling 6-month periods. In green, we show what percent of bitcoin’s risk is being explained by Venn’s equity factor specifically.3
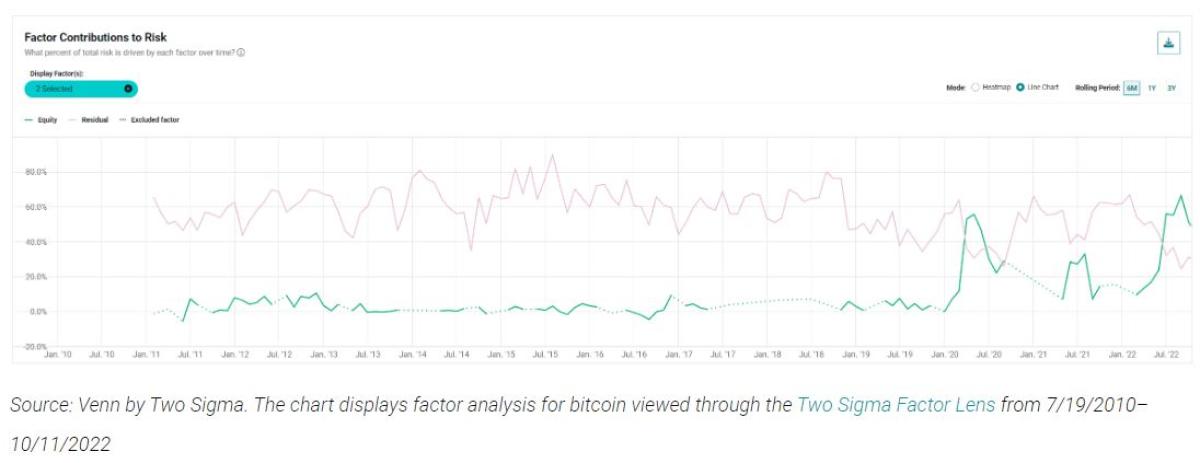
Towards the end of the chart, Venn suggests a steep decline in bitcoin’s unexplainable risk (pink), and a steep rise in the explainable risk due to movements in our Equity Factor (green). This reached as high as 66.29% as recently as August 2022, meaning that Venn is demonstrating that the majority of bitcoin’s risk was explainable by movements in equities over that 6-month period.
Why does this matter?
Up until the last few years, many investors believed bitcoin belonged in the alternative sleeve and was differentiated from equity exposure. While it is too early to completely disprove this theory, it's fair to begin asking questions. For example, what are realistic expectations for bitcoin in various market regimes? Is this rise in correlation with equities temporary due to rising interest rates? As crypto matures, will it continue to look, feel, and be explained by equity movements?
At Venn, no matter the path of bitcoin or crypto in general, we believe that monitoring and understanding crypto risk and return characteristics will be key to incorporating it in well-diversified portfolios.
REFERENCES
1http://www.tylervigen.com/spurious-correlations
2 For context, we recently wrote about the holistic nature of Venn, showing how Venn has interpreted over 90% of risk for representative institutional portfolios.
3 When the line is dotted the factor was excluded from analysis via lasso regression. Learn more about our factor selection methodology.
About the Author:
Christopher Carrano is a Vice President at Venn by Two Sigma.

Chris is responsible for thought leadership and research-based content generation. Prior to Two Sigma, Chris worked within the ETF and Index Investments group at BlackRock, and was a quantitative research analyst at WisdomTree before that. Chris has spent much of his career championing factor investing and enjoys bringing investment insights to a wider audience. He holds a B.A. in Economics from Columbia University.
Disclaimer:
This article is not an endorsement by Two Sigma Investor Solutions, LP or any of its affiliates (collectively, “Two Sigma”) of the topics discussed. The views expressed above reflect those of the authors and are not necessarily the views of Two Sigma. This article (i) is only for informational and educational purposes, (ii) is not intended to provide, and should not be relied upon, for investment, accounting, legal or tax advice, and (iii) is not a recommendation as to any portfolio, allocation, strategy or investment. This article is not an offer to sell or the solicitation of an offer to buy any securities or other instruments. This article is current as of the date of issuance (or any earlier date as referenced herein) and is subject to change without notice. The analytics or other services available on Venn change frequently and the content of this article should be expected to become outdated and less accurate over time. Any statements regarding planned or future development efforts for our existing or new products or services are not intended to be a promise or guarantee of future availability of products, services, or features. Such statements merely reflect our current plans. They are not intended to indicate when or how particular features will be offered or at what price. These planned or future development efforts may change without notice. Two Sigma has no obligation to update the article nor does Two Sigma make any express or implied warranties or representations as to its completeness or accuracy. This material uses some trademarks owned by entities other than Two Sigma purely for identification and comment as fair nominative use. That use does not imply any association with or endorsement of the other company by Two Sigma, or vice versa. See the end of the document for other important disclaimers and disclosures. Click here for other important disclaimers and disclosures.
This article may include discussion of investing in virtual currencies. You should be aware that virtual currencies can have unique characteristics from other securities, securities transactions and financial transactions. Virtual currencies prices may be volatile, they may be difficult to price and their liquidity may be dispersed. Virtual currencies may be subject to certain cybersecurity and technology risks. Various intermediaries in the virtual currency markets may be unregulated, and the general regulatory landscape for virtual currencies is uncertain. The identity of virtual currency market participants may be opaque, which may increase the risk of market manipulation and fraud. Fees involved in trading virtual currencies may vary.