


By Fernando Walter Lolo, CAIA
Chart patterns are powerful tools in technical analysis, helping traders identify potential trend reversals, continuations, and breakout opportunities. Recognizing these formations allows traders to make informed decisions based on historical price action and market psychology. This article continues the discussion from Part One and focuses on advanced formations and multi-timeframe strategies, including complex base structures, triangle variations, and specialized patterns frequently observed in cryptocurrency markets. It also explores how to integrate these patterns with other analytical methods to improve consistency and confidence in decision-making.
All analyses, calculations, and assessments presented here are based on my own charting using TradingView, leveraging the most accurate data available at the time of writing. This content is intended for educational and illustrative purposes only and does not constitute financial or investment advice. Readers should always conduct their own research and remain aware that market conditions can change rapidly.
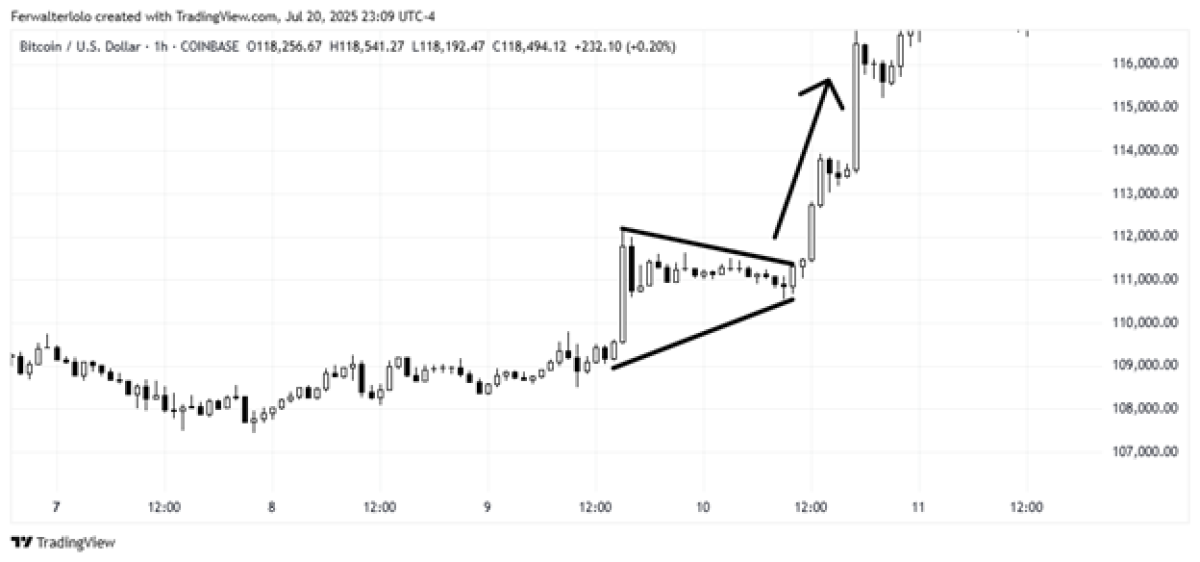
11. Bullish Pennant (Continuation)
The bullish pennant is a short-term continuation pattern that breaks upward about 70% of the time, with a 61.8% Fibonacci retracement that often marks an optimal entry point. It forms immediately after a sharp price advance, creating a small symmetrical triangle attached to the prior vertical move (the “pole”). Unlike flags, pennants have no significant slope and show tighter, symmetrical compression.
Key Characteristics:
- Sharp, near-vertical advance of 15-35% within 3-8 trading periods
- Forms over 3-10 periods (shorter than flags)
- Pole forms on massive volume (around 300-500% above average)
- Consolidation occurs on collapsing volume (60-80% below average)
- Breakout on expanding volume (200-300% above average)
- Compression typically 50-70% from the widest point
Market Context:
- Common after major positive announcements or protocol upgrades
- Often precedes short-covering liquidations
- Frequently coincides with social media trends and sentiments
- More prevalent in altcoins during risk-on environments
Cons:
- False breakouts in low-liquidity altcoins
- Overly tight compression (>80%) increases fakeout risk
- Lack of volume on breakout raises failure probability by ~50%
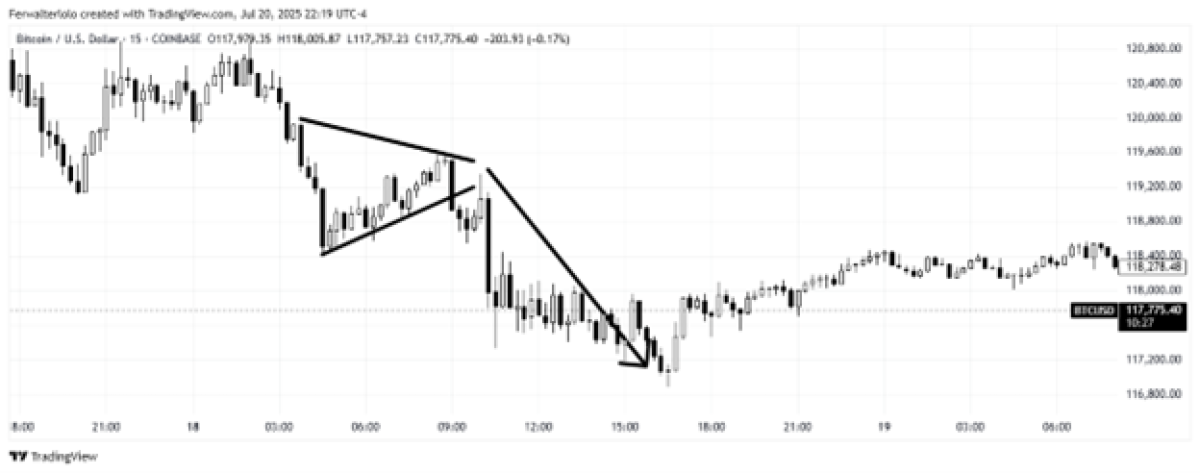
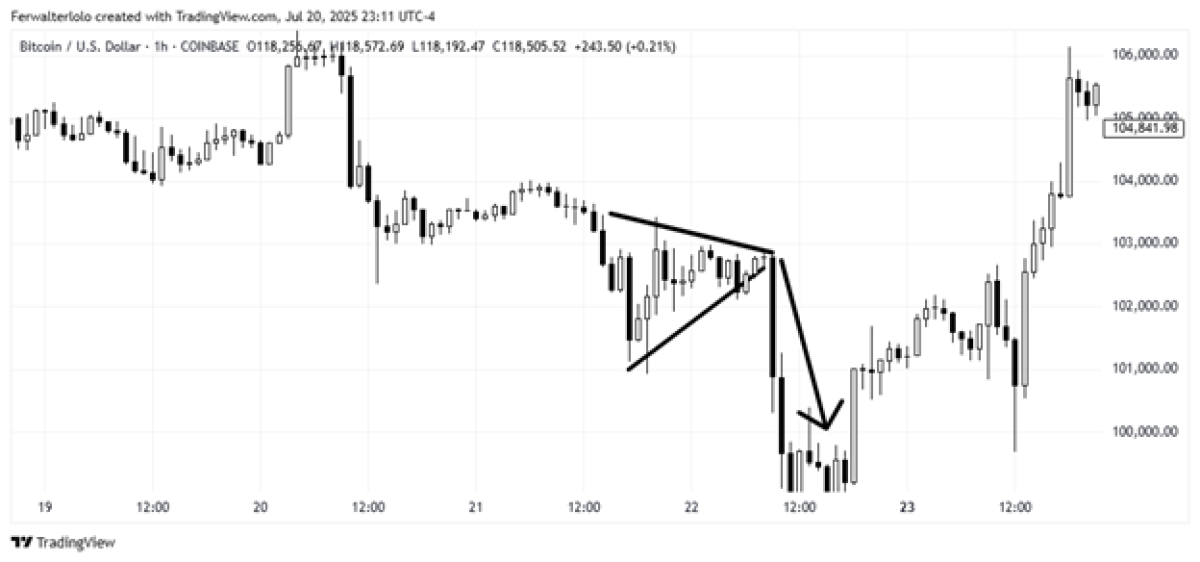
12. Bearish Pennant (Continuation)
The bearish pennant is the counterpart to the bullish pennant, signaling short-term continuation of a downtrend. It breaks downward about 70% of the time, with the 50% Fibonacci retracement often confirming resistance before continuation. This pattern forms immediately after a sharp decline, creating a small symmetrical triangle that reflects temporary consolidation before sellers regain control.
Key Characteristics:
- Sharp, vertical decline of 20-35% within 3-7 trading periods
- Forms over 4-12 periods
- Pole forms on massive volume (around 400-600% above average)
- Consolidation occurs on collapsing volume (70-85% below average)
- Breakdown on expanding volume (250-350% above average)
- Compression typically 55-75% from the widest point
Market Context:
- Common after liquidation cascades or exchange failures
- Often follows negative regulatory or macro announcements
- Frequently coincides with high leverage ratios in derivatives markets
- More reliable when Bitcoin leads markets lower
- Often correlates with stablecoin outflows
Cons:
- Bull traps during sudden market reversals
- Over-compression increases false breakdown risk
- Lack of volume on breakdown raises failure probability by ~45%
13. Ascending Triangle (Bullish Continuation)
The ascending triangle is a bullish continuation pattern with about 75% reliability. It forms when price establishes a horizontal resistance while creating higher lows, signaling increasing buying pressure. A breakout typically occurs on above-average volume, with targets based on the triangle’s height projected upward. The 38.2% Fibonacci retracement often acts as post-breakout support, while the 161.8% extension serves as a secondary target.
Market Context:
- Common before major news events (e.g., ETF approvals, protocol upgrades)
- Indicates aggressive buyers versus static sellers
Pros:
- High-probability breakout setup
- Clear resistance and support levels
- Often leads to strong continuation moves
Cons:
- May fail during “sell the news” events
- Requires patience during formation
- Requires significant volume confirmation
Crypto-Specific Tips:
- Volume should increase by 30%+ on breakout
- Look for decreasing open interest during formation
- More reliable when combined with positive fundamentals
Execution Strategy:
- Enter on breakout with 2× average volume
- Target 1.5× pattern height initially
- Place stop-loss below the most recent higher low
- Take partial profits at psychological resistance levels
- Avoid trading during high-volatility events
14. Descending Triangle (Bearish Continuation)
The descending triangle is a bearish continuation pattern with about 70% reliability. It forms when price establishes a horizontal support level while making lower highs, signaling increasing selling pressure. Breakdowns typically occur between 60-75% of the pattern’s completion, with the price target equal to the triangle’s height projected downward. The 50% Fibonacci retracement often acts as resistance during pullbacks.
Market Context:
- Common before major liquidations or during prolonged bear markets
- Indicates sellers becoming more aggressive while buyers defend a floor
Pros:
- Good risk/reward ratios
- Clear breakdown points
- Often leads to sharp declines
Cons:
- May break upward during unexpected rallies
- Requires strong volume confirmation
- False breakdowns are common
Crypto-Specific Tips:
- Trade when volume increases by 25%+ on breakdown
- Look for negative funding rates and bearish fundamentals
Execution Strategy:
- Short on confirmed breakdown
- Place stop-loss above the most recent lower high
- Target 1× pattern height initially
- Take partial profits at key support levels
- Combine with rising open interest for added conviction
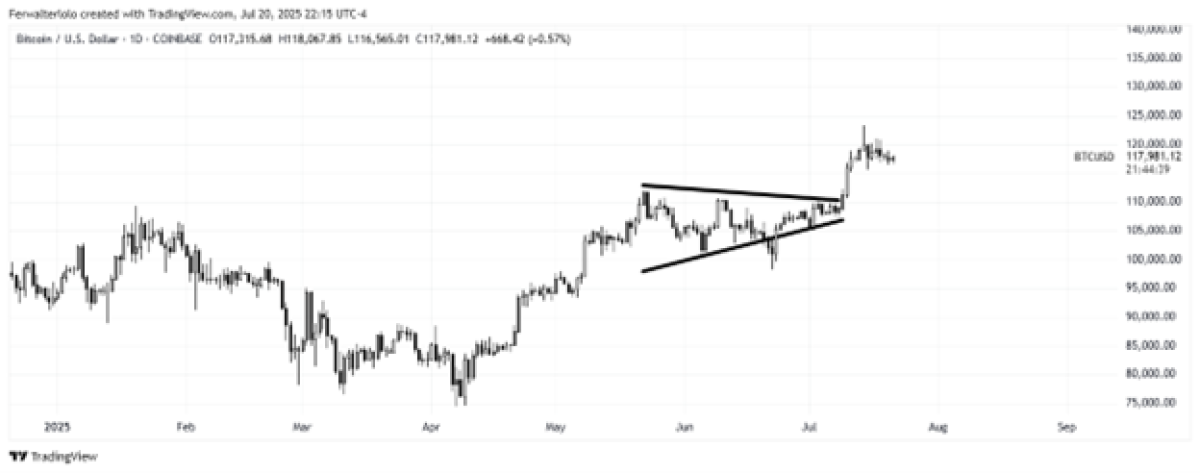
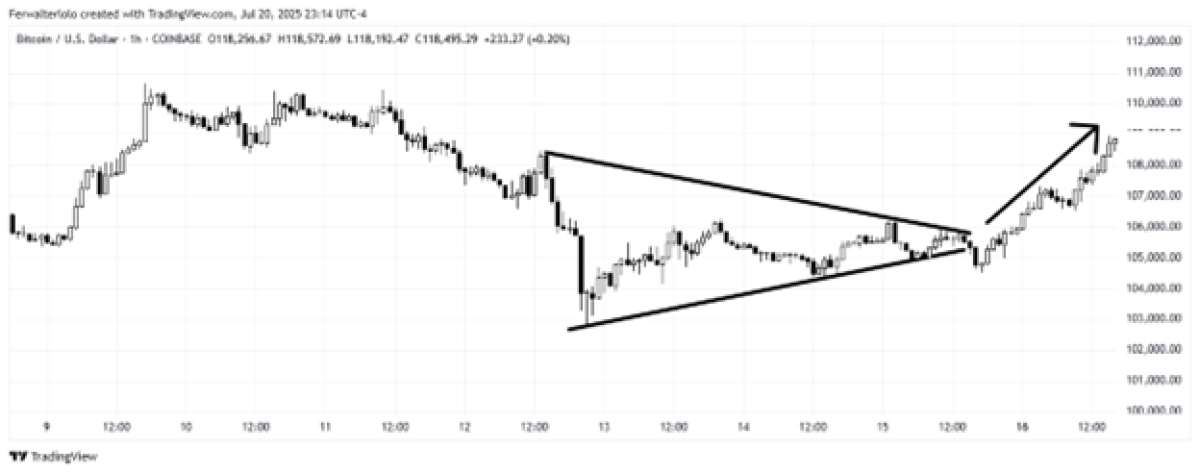
15. Symmetrical Triangle (Continuation/Reversal)
The symmetrical triangle is a neutral pattern with about 65% reliability. It forms when price creates converging trendlines (lower highs and higher lows), indicating equilibrium between buyers and sellers. Breakouts typically occur between 50-75% of the pattern’s completion, with minimum targets equal to the widest part of the triangle projected in the breakout direction. The 61.8% Fibonacci retracement often acts as support/resistance post-breakout.
Market Context:
Common during periods of uncertainty or before major volatility events
Suggests temporary balance before directional move
Break direction typically follows the prevailing trend
Pros:
Works in both bullish and bearish scenarios
Clear breakout points
Good risk/reward setups
Cons:
Requires patience during formation
Fake breakouts are common
Needs strong volume confirmation
Crypto-Specific Tips:
Volume should spike in the breakout direction
Look for alignment with funding rates
More reliable on higher timeframes
Execution Strategy:
Wait for confirmed breakout direction
Trade in line with prevailing trend
Target 1× pattern height initially
Place stop-loss beyond opposite trendline
Take partial profits at key Fibonacci levels
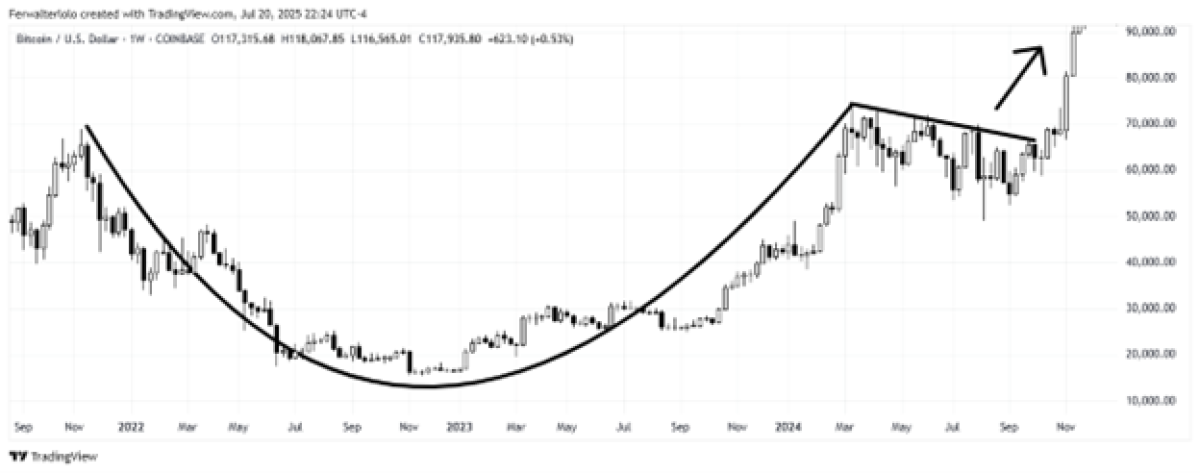
16. Cup and Handle (Bullish Continuation)
The cup and handle is one of the most reliable institutional accumulation patterns in cryptocurrency markets, with an 85% success rate. It typically forms over several months and signals strong bullish continuation. The breakout from the handle often targets the 161.8% Fibonacci extension, with extended moves reaching 261.8%.
Key Characteristics:
Rounded “cup” bottom forms over 3-6 months; depth is ideally 30-50%
“Handle” forms in the upper one third of the cup and lasts 1-4 weeks, representing final shakeout
Right side of the cup shows 20-30% higher volume than left
Breakout volume exceeds 20-day average by 40%+
Market Context:
Common after 12-18 month bear markets
Often precedes major adoption cycles or protocol upgrades
More reliable in Bitcoin than altcoins
Often coincides with accumulation phases
Execution Strategy:
Enter on handle breakout above resistance
Stop-loss: 3-5% below handle low (wider for volatility)
Use smaller position size (~50% of normal) due to longer timeframe
17. High Handle (Bullish Continuation)
The high handle is a stronger variant of the cup and handle pattern, with an 85% success rate. It signals exceptionally strong demand, as the handle forms in the upper portion of the cup, preventing deeper retracements and often leading to explosive breakouts.
Key Characteristics:
Handle forms in the top 25% of the cup
Volume during handle decreases only 15-20%
Breakout occurs with a 50%+ volume spike
Minimal retests of breakout levels
Market Context:
Common during institutional adoption phases
Often appears in low-volatility environments
Correlates with ETF approval processes and decreasing stablecoin liquidity
More frequent in Bitcoin than altcoins
Often precedes supply shocks
Execution Strategy:
Enter on breakout above handle high
Initial target: 200% of cup depth
Place stop-loss orders at 2-3% below the handle low
Add to position on 23.6% Fibonacci retracement
Watch for continuation gaps after the breakout
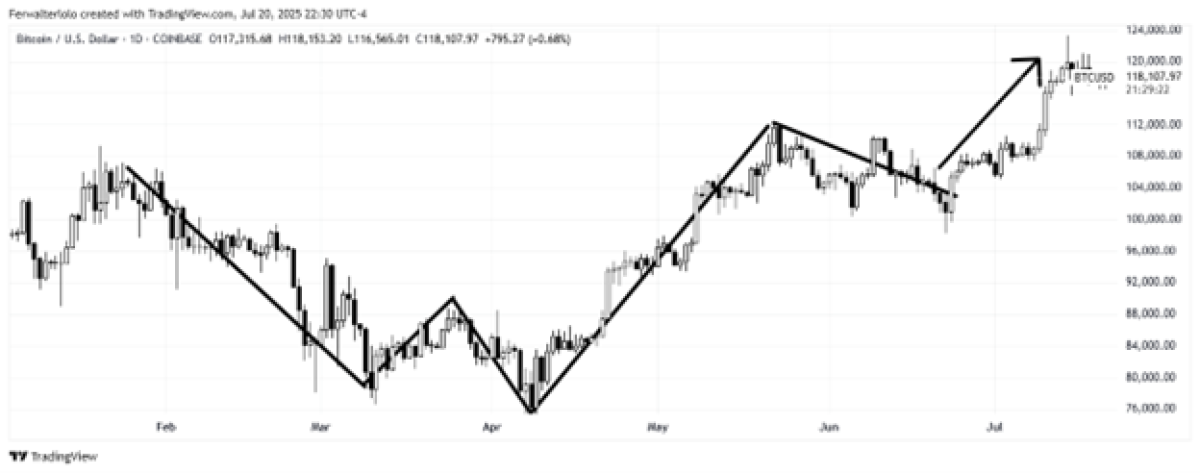
18. W-Shape (Double Bottom Variant)
The W-bottom is a bullish reversal pattern with about 75% reliability, confirming when price breaks above the central peak. The breakout often targets the 161.8% Fibonacci extension. W-bottoms frequently mark the end of bear markets or a major corrections, showing two distinct accumulation phases separated by a relief rally.
Key Characteristics:
Two symmetrical troughs separated by a central peak
Troughs should form within ~5% of each other
Central peak retraces 50-61.8% of initial decline
Volume higher on right trough than left
Breakout volume exceeds average by 30%+
Market Context:
Common after 70%+ drawdowns or major corrections
Often coincides with capitulation phases
Frequently precedes Bitcoin halving events
More reliable with positive funding rates and RSI divergence
Execution Strategy:
Enter long on breakout above central peak
Initial target: 161.8% of pattern height
Place stop-loss orders at 2% below the lowest trough
Watch for throwback to the breakout level
Combine with accumulation metrics for added confidence
19. Flat Base (Consolidation)
The flat base is a bullish continuation pattern with about 80% breakout reliability. It demonstrates institutional accumulation at consistent price levels, creating a “launching pad” for the next move higher. The tight price action indicates some traders are maintaining positions without significant distribution. Breakouts often target the 261.8% Fibonacci extension.
Key Characteristics:
Sideways price action within 10-15% for 6-12 weeks after an advance
Maximum depth: ≤15% from high to low
At least two tests of support and resistance
Volume decreases 30-40% during formation
Breakout volume spikes 50%+ above average
Market Context:
Common after 50%+ rallies from lows
Often precedes major news events or halving cycles
Correlates with decreasing exchange supply
More reliable on weekly timeframes
Execution Strategy:
Enter on breakout above resistance
Initial target: 261.8% of base height
Take partial profits at 161.8% extension
Place stop-loss orders at 3% below the base low
Watch for continuation gaps
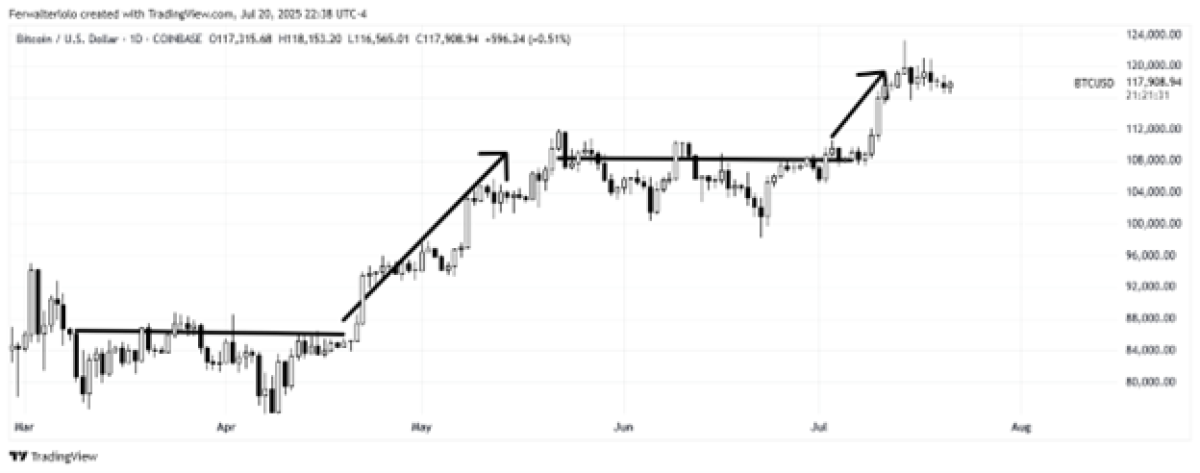
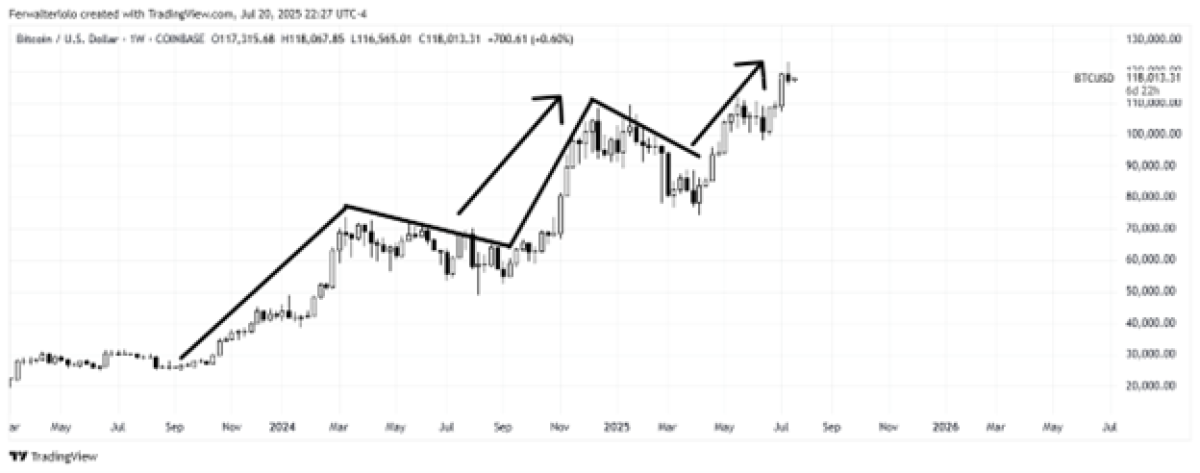
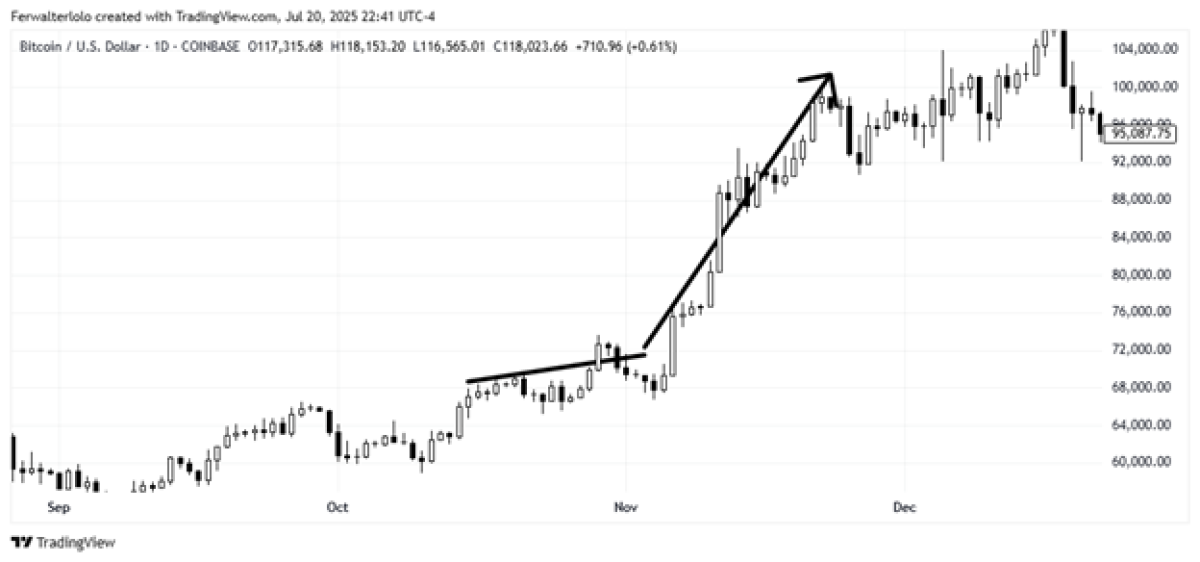
20. Ascending Base (Bullish)
The ascending base is a bullish continuation pattern with about 80% breakout reliability, signaling steady accumulation with buyers willing to pay incrementally higher prices and sellers fixed at a specific level. It forms when price creates a series of higher lows over 6-12 weeks while encountering consistent resistance. Breakouts often target the 127.2% Fibonacci extension, with secondary targets at 161.8%.
Key Characteristics:
Minimum three higher lows required
Resistance tested at least twice
Each low shows 10-15% less volume than the previous
Breakout volume exceeds 20-day average by 40%+
Market Context:
Common during early bull market phases
Common in altcoins during Bitcoin consolidation
Often precedes protocol upgrades
Correlates with increasing development activity
More reliable with positive funding rates
Frequently appears after market capitulation
Execution Strategy:
Enter on breakout above resistance
Place stop-loss orders at 3% below most recent higher low
Add to position on 38.2% retracement
As highlighted in Part One, chart patterns form the foundation of technical analysis, offering traders a structured approach to interpreting market psychology and anticipating price movements. These patterns provide valuable insights into market trends and help identify high-probability setups. The cryptocurrency market is highly dynamic, where trading theses can be validated or invalidated rapidly. Success in this environment requires thorough analysis, disciplined risk management, and adaptability to evolving conditions.
This two-part series delivers a comprehensive toolkit for analyzing crypto markets across various scenarios. Applying these strategies effectively demands consistent practice, back-testing, and ongoing refinement of technical skills. While no pattern guarantees success, combining multiple signals and maintaining realistic expectations enhances decision-making and long-term performance.
About the Contributor
Fernando Walter Lolo, CAIA specializes in alternative investment, cryptocurrencies, volatility, and global-macro trading and investment strategies. Fernando has a strong track record to strategize, articulate, and execute investment strategies, financial operations, and trading in developed and emerging markets.
Learn more about CAIA Association and how to become part of a professional network that is shaping the future of investing, by visiting https://caia.org/