 A new Study of Investments for Private Foundations, sponsored jointly by the Council on Foundations and Commonfund, reports that investment returns rose an average of 15.6% in 2013. This makes 2013 the second consecutive year that the average return came into the double digits.
In a joint statement the heads of the two sponsoring organizations characterized the report as “good news for the country” because such “institutions have regained solid financial footing positioning them well for community investment.” These leaders, Vikki Spruill, president and CEO of the Council on Foundations, and John S. Griswold, Executive Director of Commonfund Institute, also observed that an average 56% of participating foundations said that their mission-related spending has increased.
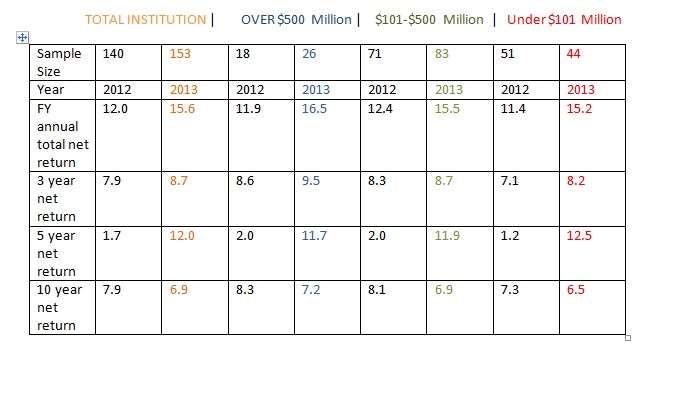
The table below gives the breakdown by single year and multi-year returns, and by the scale of the institutions reporting.

Adapted from C of F – Commonfund report
As you can see, the highest return in 2013 came to the largest institutions: 16.5% to those with more than $500 million under management. That was not the case last year, when the medium sized foundations outperformed the largest, 12.4% to 11.9%.
The overall number of respondents has grown from 2012 to 2013, from 140 respondents to 153. The number of the smaller foundations reporting has dropped by seven.
Not only is the average return of the total population in double digits for each of the last two years, but the average return of each of the three size classes is double digit likewise.
One dramatic looking fact on this table with a simple explanation: the 5 year returns are dramatically better for 2013 than they had been for 2012, for the total population and for each of the size classes. Why? The dead weight of the 2008 results is no longer part of the five-year results as of 2013.
Looking at asset classes and strategies: foundations did well from investing in domestic equities: an average gain of 31.8%. They lost money, on average, from fixed income investments, in the ongoing environment of historically low interest rates.
From their exposure to alternative strategies as a whole, foundations gained 7.3%. Such strategies represent 42% of the portfolio of participating institutions. See the table below for a further breakdown of the asset allocations.

As you can see, the proportion of a foundation’s portfolio given over to alternative strategies rises as the scale of the foundation increases. In 2013 this meant an allocation of 46% for the largest foundations, 31% for those of intermediate size, 21% for the smaller. In 2012 the same pattern held, though the corresponding numbers for that year were 47%, 30%, and 23% respectively.
The report also speaks to issues of foundation resources, management, and governance. The number of full-time professionals employed by private foundations in order to devote their time to investment averaged 1.3 in 2013, a decline from 1.4 in 2012 and 1.5 in 2011.
A quarter of the participants in the study reported that they have a chief investment officer. Among the largest foundations, the number with a CIO is 58%.
Fewer participants this year said that they outsourced their investing function (that was 38% last year, and is only 30% this year.)


