

 By Brad Case, Ph.D., CFA, CAIA
More than 46 basis points per year on average. That’s a pretty hefty drag, nearly 7% of the average net total return on equity.
Here’s how to estimate the drag from cash reserves:
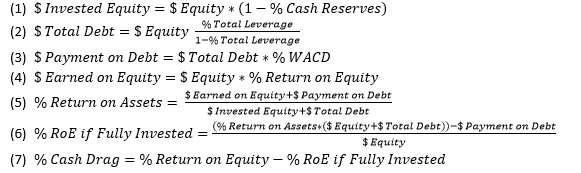
Since 2000Q1 the National Council of Real Estate Investment Fiduciaries (NCREIF, as part of its ODCE data base) has published quarterly data on three of the four items necessary to estimate the effect of leverage on gross total returns of an open-end core private real estate fund:
Cash Reserves (%)
Total Leverage (%)
Return on Equity (%)
The fourth necessary data item is the weighted average cost of debt. While NCREIF does not publish WACD data, I estimated it in each quarter by averaging the three lowest WACD figures reported for the same quarter by listed property companies (mostly equity REITs).
As an example, assume you had invested $10 million in the average core fund during 2010Q3. The average cash reserve in that quarter was 6.21% (slightly higher than normal), so invested equity was $9,378,813. (I’m rounding in my explanation, but not in the underlying data.) Average leverage was 29.60%, so total debt was $4,204,092. The three listed property companies reporting the lowest WACD during that quarter (Franklin Street Properties, UDR, and Government Properties Income Trust) had an average WACD of 3.76% on an annualized basis, so your payment on debt during 2010Q3 would be estimated at $4,204,092 * 3.76% / 4 = $39,557. Meanwhile, ODCE reported an average gross return on equity of 5.45%, so dollars earned on equity were $545,057. Those figures imply that the return on assets was ($545,057 + $39,557) / ($9,378,813 + $4,204,092) = 4.30%. The return on equity if the fund had been fully invested can be estimated as ((4.30% * ($10,000,000 + $4,204,092)) - $39,557) / $10,000,000 = 5.72%. Finally, the cash drag then was 5.45% - 5.72% = -0.27%, or $26,736 based on your invested equity.
That’s an extreme example: the worst quarter shown in the ODCE database, because return on equity was spectacularly high at 5.45%. When returns are negative, however, the cash reserve actually protects investors from suffering as badly as they would if they were fully invested. During 2009Q1 average cash reserve was just 2.70% (too bad!), so invested equity was $9,729,526. Leverage averaged 29.55%, so total debt was $4,194,986. Imputed WACD was 3.57% (based on the figures reported by Ashford Hospitality Trust, Franklin Street Properties, and Kilroy Realty), so debt payments would be estimated at $37,471. Average gross return on equity was -13.69% or -$1,368,642. Implied return on assets was (-$1,368,642 + $37,471) / ($9,729,526 + $4,194,986) = -9.56%. The fully-invested RoE can be estimated as ((-9.56% * $14,194,986) - $37,471) / $10,000,000 = -13.94%. That’s even worse than the actual RoE: the cash reserve in this case actually helped the return by -13.69% - (-13.94%) = 0.26% or $25,857 based on your invested equity.
Cash reserves seem to have had a positive effect on returns during six quarters in which core private equity real estate funds posted negative gross total returns on average, 2008Q3-2009Q4, with the effect averaging 17 basis points per quarter. During the other 53 quarters of positive gross total returns the cash drag averaged 15 basis points per quarter (60 bps/yr). Given that positive-return quarters have outnumbered negative return quarters 131 to 16 during the entire history of the ODCE index, the average cash drag is almost certainly greater than the average of 46 bps/yr computed over the available history since 2000Q1.
Unfortunately, open-end fund managers appear to have done a poor job of managing their cash reserves. The correlation between cash reserves and gross return on equity has been +0.26, meaning that managers have tended to increase the cash reserve (be least fully invested) just when returns were highest, and have tended to minimize the cash reserve (be most fully invested) just when returns were worst. That “buy high, sell low” behavior—much more than the cash drag itself—probably explains why open-end core fund returns have been so poor over the 36+ years since data collection began.
Brad Case is senior vice president, research & industry information for the National Association of Real Estate Investment Trusts (NAREIT). Dr. Case has researched residential and commercial real estate markets, domestically and globally, for more than 25 years. His research encompasses investment return characteristics including returns, volatilities, and correlations with other assets; measuring appreciation in property values; inflation protection; use of DCC-GARCH and Markov regime switching models to measure and predict investment characteristics; the length of the real estate market cycle; and the role of the investment horizon. He holds patents as the co-inventor of the FTSE NAREIT PureProperty(r) index methodology and the backward-forward trading contract. Dr. Case earned his Ph.D. in Economics at Yale University, where he worked with Robert Shiller and William Goetzmann, and holds the Certified Alternative Investment Analyst (CAIA) designation.