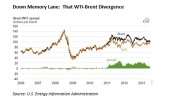
 Two and a half years ago, back when $90 a barrel was the bottom of the trading range for crude oil, John W. Bagby, a professor at Pennsylvania State, wrote a fascinating paper on “energy informatics,” that is, on the overlap of the energy industry and Big Data. His interest was inspired in part by the then-odd phenomenon of a discount of WTI vis-à-vis Brent.
Bagby’s starting point was simply that energy production generates a lot of data, often haphazardly correlated. Anyone wanting to think about the subject in a systematic way (or even to allow their AI machines to do so) must include in the discussions, or in the algorithms, data about the geophysical properties of various sites where petroleum or other energy-rich deposits may be found; inventories of resources, networks, facilities globally; environmental data; exploration data; capacities for production and distribution; fuel chemistry [viscosity and sulfur content); commodities prices and trends; leasing and royalty charges; the supply and demand both for petroleum and for substitutes; and so forth.
Tricky Data Sets and Silos
Some of these data sets are created and systematically maintained as part of for-profit businesses. There are two very different contexts in which that happens. The data in one of those categories can be developed precisely so that it can be sold, or used for consulting, etc., or the data can be developed as a side effect of an entity’s first-order activity in the energy supply chain. In any case, however well maintained the data set may be, it may also be an isolated silo.
Further, some of these sets are “inadequately incentivized to satisfy either intrinsic value propositions or … essential control needs” as Bagby put it. That is, they don’t get systematically compiled for either of the above reasons. The data on such subjects exists, but in a helter-skelter sort of way, and often in analog form because nobody has seen a profit opportunity in digitizing it. This under-incentivized information constitutes the project for the field of energy-informatics.
A case study
The end of the WTI premium and growth of the discount was, to Bagby, a fascinating case study.
Until 2010, prices of West Texas Intermediate have long existed in a predictable relationship with the prices of Brent crude. The physical difference was well known: WTI has less sulfur (it is “sweet” in industry parlance). That caused it to trade at a predictable premium for a long time.
But, in late 2010 and into 2011 a serious bottleneck developed, specific to WTI. Brent became more valuable, and the newly-positive spread between them rapidly increased, doubling within a three week period in late January and early February of that year. The spread reached an unheard-of $26 that August. What was going on?
The short answer is that a lot of oil was simply getting stuck in Cushing, Oklahoma, the delivery point for the Nymex contract for light sweet crude. By the spring of 2012 there were more than 44 million barrels of the stuff sloshing about there. That May, in reaction, the movement of oil along the Seaway pipeline reversed. The pipeline had been built in the 1970s to carry oil from the Gulf Coast to Oklahoma. That had to be reversed and the horsepower at the pump stations had to be increased, so the coastal refineries could make use of it. Still, the disparity existed for at least another year. It had fallen to roughly $4.50 by the end of July 2013.
Meanwhile, too, the bottleneck had increased delivery time making Brent crude (which was free of these problems) more reliable.
Bagby and Since
For Bagby, this is an example of how commodity prices encode information that allows for “reliable inference into strategic supply chain conditions.” It was also an instance of the critical need for infrastructure protection.
By way of an update, the spread showed a good deal of volatility after Bagby’s article appeared. It was back up to $15 before the end of 2013. Since then, though, it has slowly receded again, and calmed, down to just $2.14 in the first week of 2015, with less-than-shocking zig-zags. The day when the spread is again and reliably in the negative numbers, that is, when WTI is once more at a premium, may not be far away.
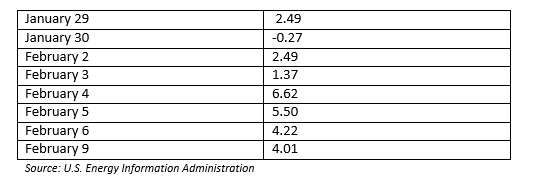
Or, maybe it is. In the period from January 29th of this year through February 9th, the spread was negative only once, on January 30th.

You can also see that the spread got as high as $6.62 only three trading days later. One theory now in circulation about these numbers is that the market is now reflecting information about the prospects for the Keystone Pipeline. Such a pipeline would make it a lot easier to move WTI to market than it has been of late, using 1970s-era pipelines, and this could make WTI once again the premium crude. So … whatever is good news for Keystone is good news for WTI and bad news for Brent, and vice versa.
Though I haven’t crunched all the numbers in all the possible data sets, this seems a reasonable first hypothesis.


