

 In a new report, five scholars affiliated with EDHEC Risk Institute, find that for many equities, the ‘official’ nationality doesn’t match the underlying geographic reality. Taking too seriously the place of listing, or the assignment of nationality in market indexes, may create a distorted view of the real risks of a portfolio, and of the contributors to performance. One consequence of this in turn may be that booms are wilder and busts are more devastating than would have been the case with a more care-taking allocation of risk by geography.
The authors, led by Noël Amenc, director of the Institute and CEO of ERI Scientific Beta, find in particular that the indexes “that are labelled as representing developed market equity have significant and increasing exposure to emerging markets.”
Using the Segmented Sales Data
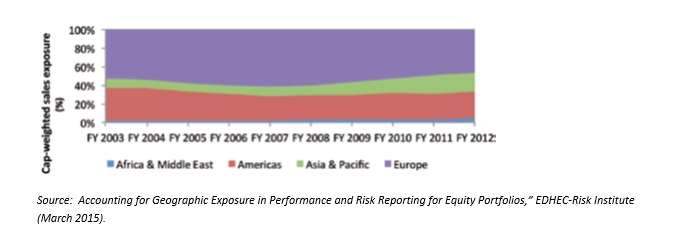
Fortunately, the new international accounting rules have introduced geographical segmentation sales data. This data let us know, for example, that the cap-weighted non-U.S. exposure of the S&P 500 between June 2004 and June 2013 increased from 30% to 39%. Meanwhile, the non-European exposure of the STOXX Europe 600 increased from 41% to 53%, making a much-used ‘European’ index now predominately non-European.
As the below graph indicates, the STOXX Europe change has come about largely through the growth of Asia-Pacific exposure for the equities involved.
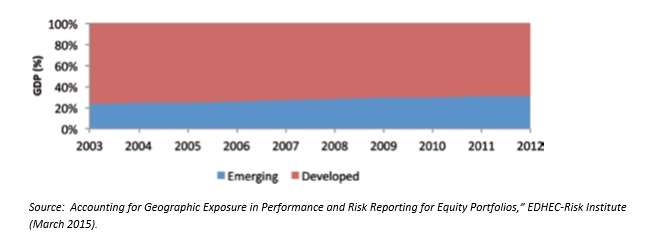
Meanwhile, the share of developed markets in world GDP has declined. It was about 77% in 2003 and was down to 69% in 2012.
So it is unsurprising that the sales exposure to the emerging world of companies headquartered or listed in the developed world has increased during this period. In cap-weighted terms, the sales exposure of S&P firms to EMs was only 9% in FY 2003, but had risen to 19% in FY 2012.
Bulls and Bears
For the STOXX Europe 600 the corresponding figures are 11% and 25%. The upward trend of the EM share of such statistics is general a smooth one, the slow-but-sure type of trend, not a wild zig zag.
For FTSE Developed Asia Pacific companies the exposure to emerging market more than doubled during the same period, from 8% to 21% in cap-weighted terms. For what it’s worth, this trend is less smooth than the others.
Suh numbers “underline the need to report the exposure of equity portfolios in terms of geographic sources of revenue and [to] go beyond the simplistic measures such as place of listing of stocks or a company’s headquarters and place of incorporation.”
Suppose for these reasons the manager of a portfolio, who hasn’t done sales-based research into the equities in his portfolio, ends up with more EM exposure than he had expected. What are the consequences?
According the EDHEC, they are procyclical. Taking the S&P as your portfolio, and considering first bull markets, “when the return of emerging market equity is higher than that of developed market equity, stocks with high exposure to emerging markets contributed more (4.58%) than stocks with low exposure to emerging markets (3.42%). Similarly, during bear markets, when the return on emerging markets was lower than developed markets, stocks with low emerging market exposure contributed more (0.80%) to the performance of the S&P than stocks with high exposure to emerging markets (-1.25%).”
The same is true of the other indexes considered, though the specific numbers of course differ.
Further, the degree of such disparities suggests a trading strategy. The EDHEC report alludes to recent research by Ningzhong Li et al., indicating that “securities prices are slow in incorporating information about geographic segmentation data.” So, it is presumably possible for a well-informed trader to get ahead of the price moves in this respect. That paper is available here.