


By Hossein Kazemi, Ph.D., CFA, Senior Advisor, CAIA Program
Introduction
The performance of hedge funds since the Global Financial Crisis (GFC) has been hotly debated in both industry and academic studies. There is strong evidence that the GFC had a profound impact on the structure and the relative performance of the hedge fund industry. Exhibit 1 compares the net of fees growth of $100 invested in the S&P 500 index and the CISDM Equally Weighted Index of all funds since 1991.
First, it must be mentioned that the S&P 500 is not a proper benchmark for hedge funds, especially when the hedge fund index contains many strategies that do not invest in equities. Also, it is important to note that the CISDM index does not suffer from survivorship or backfill bias. However, similar to other indices of private investments (e.g., hedge funds, private equity, private real estate, etc.), it does suffer from selection bias because these funds volunteer to report their performance to public databases.
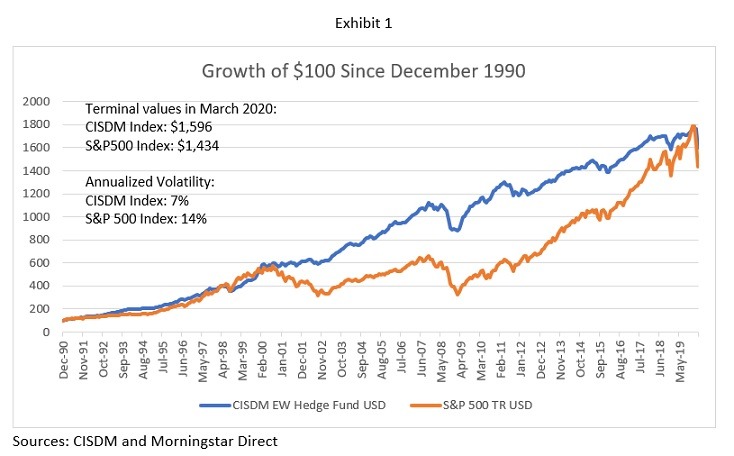
Many will be surprised to learn that since the 1990s, hedge funds have outperformed S&P 500 in total return (including reinvested dividends), and this outperformance has come with a volatility that is 50% lower than that of the S&P 500. While the performance gap between the CISDM index and the S&P 500 increased through 2008, that gap has shrunk to almost zero since then. This gap has been closed because (a) hedge funds have not performed as well as they did before the GFC and (b) because the S&P 500 index has performed slightly better compared to its performance in 1991-2007. There are several reasons for this decline in relative performance (In a forthcoming paper in the Journal of Alternative Investments, Sullivan (2020) examines some of them).
Dispersion of Performance During Crises
As mentioned above, all public databases of private funds suffer from selection bias. Therefore, the performance of funds that report to public databases could be substantially different from those who choose not to report. In a recent paper published through the US Treasury Department’s Office of Financial Research, the authors use non-public reports to examine the performance of hedge funds for the 2013-2016 period. The paper reports that funds who chose not to report to public databases outperformed the funds that reported to those databases by about 4% per year during the 2013-2016 period. This means while hedge funds did underperform the S&P 500 index in absolute terms, they outperform the index by a substantial amount on a risk-adjusted basis during this period. In fact, while funds that reported to public databases had a small negative average alpha during this period, the funds that chose not to report displayed significant positive average alpha.
Using data provided to the CISDM hedge fund database (containing close to 5,000 live and dead funds), we examined the performance of hedge fund managers from 10 different strategies from September to October 2008 and from February to March 2020. The results appear in Exhibit 2.
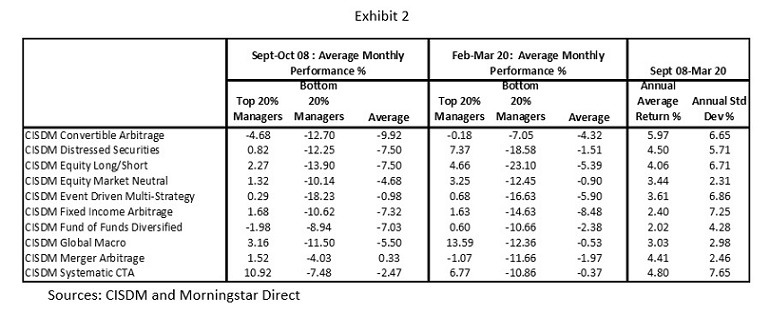
First, we see substantial dispersion among managers and depending on the strategy, this dispersion increases by up to 50% during periods of the financial crisis. This is when the time and money spent to perform thorough due diligence prior to allocations to these managers pays off. While even most of the top 20% of managers lost money during the two periods of financial crises, the returns were substantially better than those generated by most traditional asset classes.
While the GFC and the current crisis are different in terms of the sources and the speed of global economic impact, the performance of hedge funds is remarkably similar. The one exception to this performance similarity is that of global macro strategies. The top 20% of these managers earned 3.16% per month during Sept-Oct 2008. However, they performed significantly better during the most recent crisis, earning 13.59% per month during Feb-Mar 2020. Another strategy worth noting is that of distressed securities. As expected, this strategy performed poorly during the GFC, but the performance has been strong in Feb-March 2020 when the top 20% of managers were able to earn 7.37% per month.
Exhibit 3 compares the performance of the CISDM broad index to a few traditional asset classes.
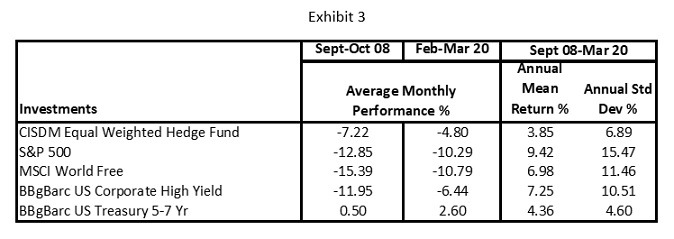
We can see that hedge fund indices outperformed risky asset classes during both crises. Given the recent outperformance by hedge funds, the performance gap that existed between hedge funds and other risk assets has narrowed somewhat.
Trend-Following Strategies During the Crises
One strategy that has displayed different exposures during that last 12 years has been the systematic trend following. Exhibits 4 and 5 display its rolling betas with respect to the return on the S&P 500 index and changes in VIX.
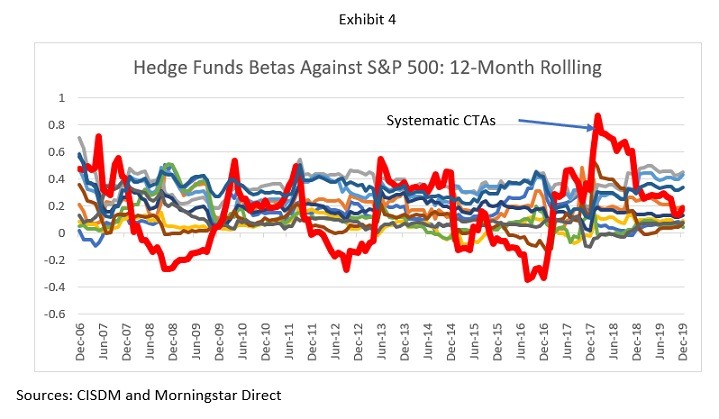
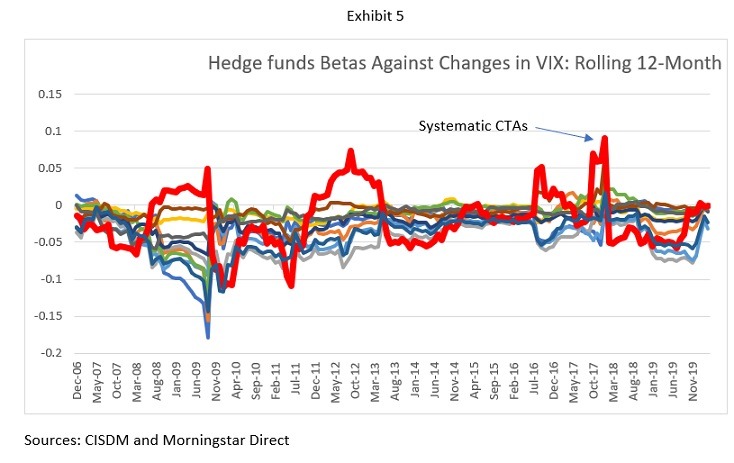
We can see that trend following CTAs appear to behave differently than other strategies. Both their equity and VIX betas fluctuate significantly as market conditions change. For example, as we approached both crises, the CTAs reduced their equity betas and increased their VIX betas. While CTAs lost money during both crises, the losses were lower than other strategies, and the top 20% managers performed rather well.
Unlike other strategies, systematic CTAs follow somewhat well-defined strategies using futures markets. Using a simple trend-following strategy based on three moving averages, which are normalized by their volatilities, we implemented five trend-following strategies using ETFs covering these asset classes: S&P 500 index, S&P GSCI Commodity Index, US Oil, US Treasury 5-7 Year Maturity, and the US dollar index. Using the signals generated by our algorithm, we created an equally weighted portfolio of long or short positions in these five assets. Exhibit 6 displays the performance of this naïve trend-following strategy.
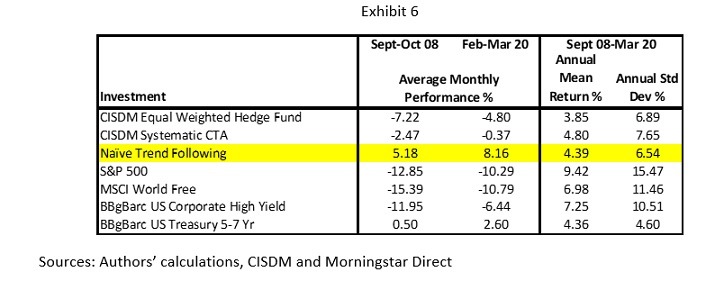
It is important to note that this naïve strategy was not optimized at all. The same parameter values were used for the entire period. Also, the naïve strategy does not include fees, market impact, slippage, and other factors. Back-tested performance figures should be reduced by 30%-50% to reflect these factors. Still, we can see that this strategy can provide reasonable returns during periods of financial crises. Using simple and exponential moving averages that are normalized to reflect the most recent volatility of the underlying assets, trend following strategies are capable of detecting strong trends in asset returns. However, they tend to suffer if trends are short-lived and, therefore, the market displays mean-reversion.
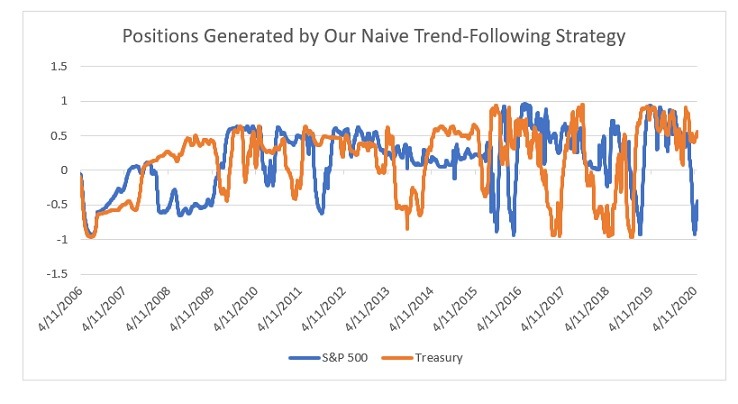
Exhibit 7 below displays the signals that were generated by our naïve model for equity and Treasury markets. The model generated a short position signal for equities on March 10, 2020, and the long position in Treasuries became stronger on January 1, 2020. While our naïve strategy would have performed well during both crises, the overall performance between September 2008 and March 2020 would have been disappointing (note that slippage and fees would reduce the overall performance).
Conclusion
Over the last 30 years, the average hedge fund has provided raw, as well as risk-adjusted returns that exceed those provided by most of the risky asset classes. However, this added value of hedge funds has not been evenly distributed through time, nor cross-sectionally. While the average hedge fund provided significant alpha through the GFC, that alpha has mostly disappeared since then. However, almost all of our understanding of hedge funds and their performances comes from studying public databases. While practitioners and academics are aware of the potential biases that exist in public databases, in the absence of access to the entire universe of hedge funds, it is impossible to quantify these biases. Private performance figures available to the US Treasury Department have allowed researchers to gain insights into the differences between hedge funds that choose to report to public databases and those who do not. Preliminary results based on data covering only four years show that hedge funds that choose not to report perform much better than the other group. This has an important implication for the industry and asset allocators. The most important implication is that hedge funds still have a place in any well-diversified institutional portfolio.
As discussed above, the benefits of hedge funds have not been evenly distributed cross-sectionally. We see that, for many strategies, the performance differential between the top and bottom 20% of managers can exceed 10% per month during periods of extreme market dislocation. The difference between the two groups is almost 1% per month during normal periods. The implication is that just allocating to an average hedge fund will deliver neither the return enhancements nor the diversification benefits that allocators expect from hedge funds. The critical implications are that:
- Allocators should diversify among various strategies as different strategies perform differently during periods of market dislocation. Of course, this is not an option for small or even medium-size institutional portfolios.
- Allocators should let the outcome of the due diligence process be the key driver of the size of the allocation to hedge funds. This means invest only in funds of the highest quality, and if the allocation falls short of the pre-determined size, so be it.
The performance of hedge funds during periods of severe market dislocation should be scrutinized. There is evidence that hedges that perform well during periods of market turmoil tend to perform better during normal times as well – risk management adds value during normal and abnormal periods.
References
- Sun, Zheng, Ashley W. Wang , and Lu Zheng, “Only Winners in Tough Times Repeat: Hedge Fund Performance Persistence Over Different Market Conditions,” 2016.
- Barth, Daniel Barth, Juha Joenvaara, Mikko Kauppila, and Russ Wermers, “The Hedge Fund Industry is Bigger (and has Performed Better) Than You Think,” 2020, Office of Financial Research.
- Sullivan, Rodney N., “Hedge Fund Alpha: Cycle or Sunset?,” 2020, Forthcoming, Journal of Alternative Investments.