


By Hossein Kazemi, The CAIA Association & The Isenberg School of Management In recent weeks, hundreds of research reports and many more blogs and commentaries have discussed the current valuation of the US stock market. With the economy in a recession and corporate profits and GDP down by double digits, it is tough to argue that the stock market is not grossly overvalued. I have used the following simple model in my first-year MBA class when I wrap up the stock market section of the course to discuss the overall valuation of the US stock market. The title of the lecture is the title of this note, and all I do each year is to update the figures. I have done this for the past 15 years. I start with this chart to show the importance of dividends and buybacks. 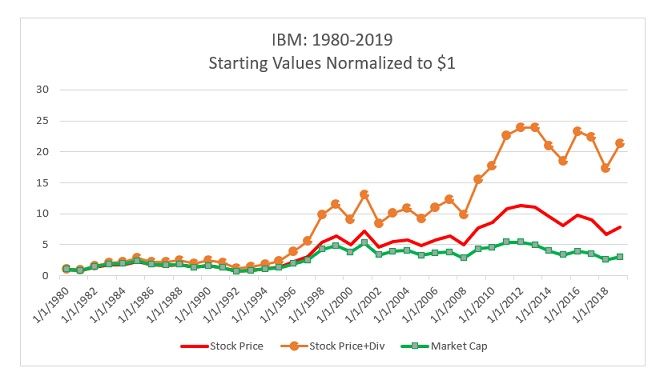 We can see that while the market cap of IBM has roughly tripled since 1980, the stock price (excluding dividends) has increased by a factor of 8, and stock price with dividends reinvested has increased by a factor of 21. Notwithstanding the political outrage regarding buybacks, they are simply combinations of special dividends plus reverse splits. The discrepancy between the stock price (not including the regular dividends) and the market cap is related to both of them. The reverse split part is purely cosmetic, while the special dividends part represents real economic value indirectly earned by shareholders. In a sense, when a company does buybacks, it pays a special dividend, and those investors who keep their shares are in effect reinvesting that special dividend back into the stock.
  Now, I bring in the historical estimates of the above parameters, and this is where using the 10-year rate helps.
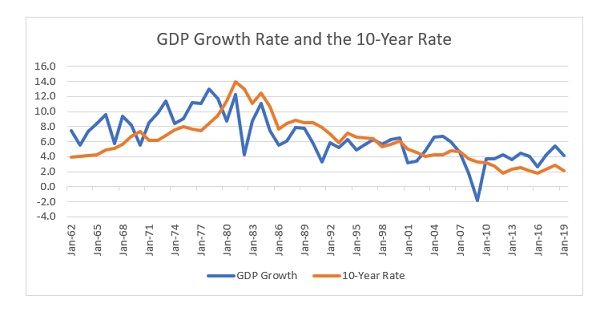
- The growth in nominal GDP has more or less matched the 10-year rate since 1960, as shown in the following graph (both have averaged around 6% per year):
- The growth in corporate earnings has exceeded the GDP growth rate and the 10-year rate by about 1% per year since 1960. That is, historically, we have g =1 %
- The current ratio of forward earnings per share to price is about 4.35%, which translates into a forward PE ratio of 23. Given the uncertainty regarding forward earnings, this ratio could be as low as 3.8% (a forward PE of 26).
- In recent years, the S&P 500 firms have been distributing about 100% of their earnings to shareholders in form dividends and buyback, which means k = 100%.
- Historically, the average equity risk premium above the 10-year rate has been 5%. That is, r = 5% .
Putting all of this together, I calculate the current estimate of the risk premium to be: ![]() Given these estimates, markets are providing a risk premium that is close to the historical average. By the way, this premium translates into about a 7% expected return from stocks. Stocks appear to be reasonably valued. The above figures may represent a more optimistic case. First, going forward, the total payout ratio is likely to be less than 100%. Second, 4.35% (or PE of 23) might be too high. Assuming that the total payout will decline to 80%, and the ratio of forward earnings to price is 3.8% (a PE ratio of 26), the result would be:
Given these estimates, markets are providing a risk premium that is close to the historical average. By the way, this premium translates into about a 7% expected return from stocks. Stocks appear to be reasonably valued. The above figures may represent a more optimistic case. First, going forward, the total payout ratio is likely to be less than 100%. Second, 4.35% (or PE of 23) might be too high. Assuming that the total payout will decline to 80%, and the ratio of forward earnings to price is 3.8% (a PE ratio of 26), the result would be: ![]() This figure indicates that stocks are about 20% overvalued. If we accept that the ratio of forward earnings to price is 4.35%, and only reduce the payout ratio to 80%, stocks will be about 10% overvalued. I have done this example for the past 15 years, and it is remarkable how often the result is that the market is reasonably valued. That is, the estimated risk premium turns out to be very close to 5%. So, there is good news that the market is close to fair valuation, or a little overvalued. However, there are two pieces of bad news. First, the expected total return of 7% from equities under the optimistic scenario is probably lower than what most institutional investors use in their asset allocation models. Second, given the current low yields on corporate and government bonds, the current expected total rate of return on the traditional 60/40 portfolio is about 5.5%, and this is the optimistic case. Interested in contributing to Portfolio for the Future? Drop us a line at content@caia.org
This figure indicates that stocks are about 20% overvalued. If we accept that the ratio of forward earnings to price is 4.35%, and only reduce the payout ratio to 80%, stocks will be about 10% overvalued. I have done this example for the past 15 years, and it is remarkable how often the result is that the market is reasonably valued. That is, the estimated risk premium turns out to be very close to 5%. So, there is good news that the market is close to fair valuation, or a little overvalued. However, there are two pieces of bad news. First, the expected total return of 7% from equities under the optimistic scenario is probably lower than what most institutional investors use in their asset allocation models. Second, given the current low yields on corporate and government bonds, the current expected total rate of return on the traditional 60/40 portfolio is about 5.5%, and this is the optimistic case. Interested in contributing to Portfolio for the Future? Drop us a line at content@caia.org