

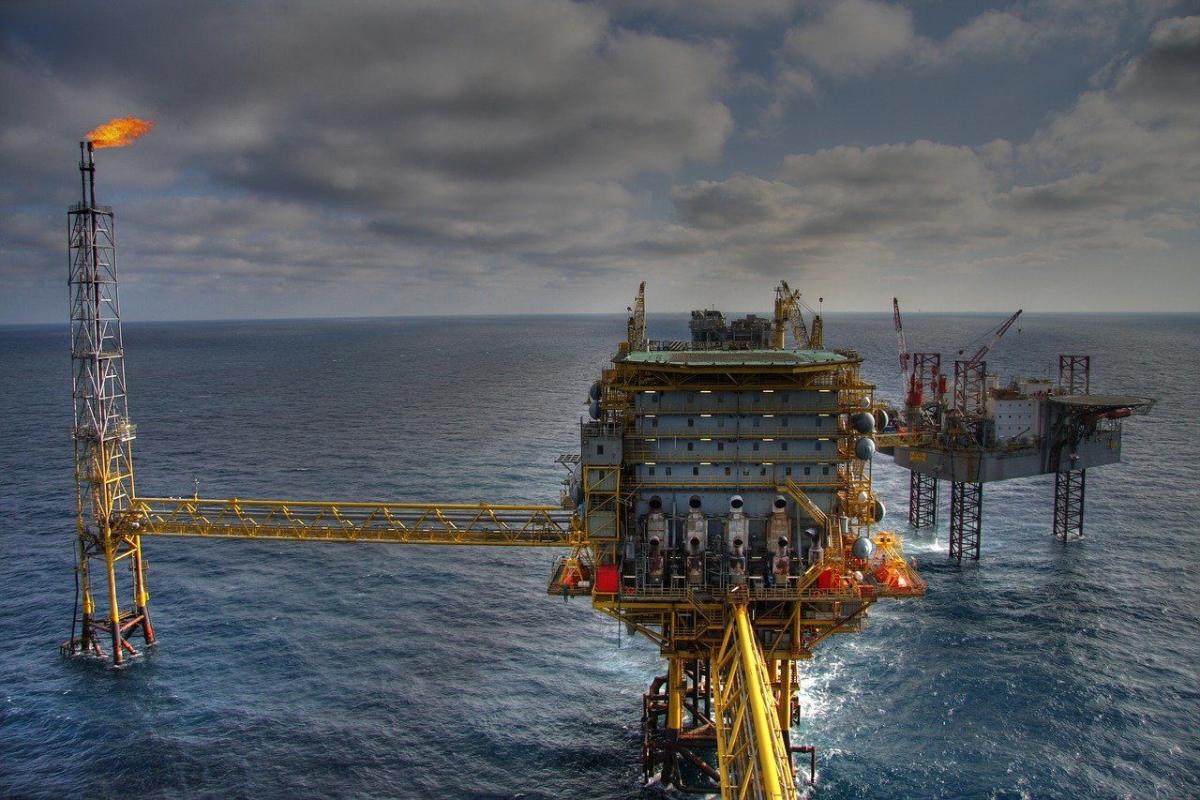
Excerpted of Goehring & Rozencwajg, Natural Resource Investors We are on the cusp of a global energy crisis. Like most crises, the fundamental causes for this crisis been brewing for several years but have lacked a catalyst to bring them to the attention of the public or to the average investor. The looming energy crisis is rooted in the underlying depletion of the US shales along with the chronic disappointments in non-OPEC supply in the rest of the world. The catalyst is the coronavirus. When we wrote last quarter’s letter global oil prices had fallen to negative levels for the first time in history. Global efforts to contain the coronavirus resulted in widespread quarantines and travel restrictions. Crude stockpiles rose sharply and seemed likely to reach maximum capacity within a matter of weeks. In April, OPEC+ announced the largest emergency production cuts ever, totaling 8 mm b/d. Collapsing prices forced production in the non-OPEC+ world to be shut-in and helped moderate the inventory builds. In that letter, we argued that once inventories approached full levels, the oil market would be forced into balance more quickly than anyone believed possible. In retrospect, this is exactly what happened. Traders realized the physical market had balanced and prices rose quickly. Less than two months after WTI reached -$38 per barrel, it had normalized to $40. The oil market is currently enjoying a momentary period of calm. The initial phase of the crisis that took prices negative is behind us and the next phase which, should take prices much higher, has yet to commence. Our models tell us the current calm will be short lived. Global energy markets in general, and oil markets in particular, are slipping into a structural deficit as we speak. We believe energy will be the most important investment theme of the next several years and the biggest unintended consequence of the coronavirus. Given the complexity of today’s oil markets, we will first summarize where demand and supply currently stand before going into each driver in greater detail. In retrospect, demand was not impacted nearly as much as originally feared. Most energy analysts warned global oil demand would fall by 30% (or 30 mm b/d) in April and May. We felt these estimates were far too severe and wrote that demand would likely fall by 23 mm b/d. Our models (which are very different than consensus and will be discussed in a moment) now suggest that demand fell by 8 mm b/d in April and May and less than 10 mm b/d for the second quarter as a whole. While this still represents the largest demand slump in history, it is nearly 70% less than originally feared by most analysts. 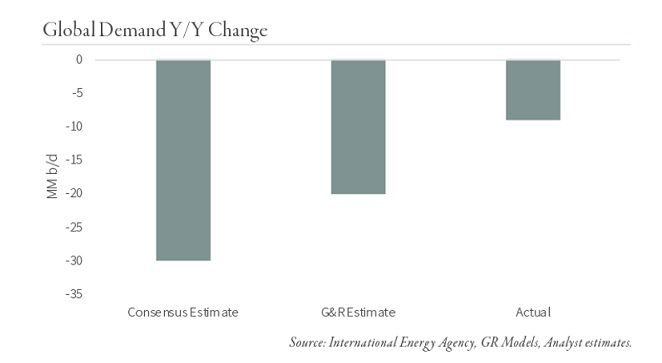 Not only was the decline much less than expected, but the recovery has been much faster as well. Core petroleum demand in the US has now regained 70% of its total peak-to-trough decline in less than five months. Preliminary Chinese customs data suggests that second quarter petroleum demand was up 10% year-on-year—the strongest reading ever. Despite air travel being the slowest to recover, it is beginning to normalize as well. Cornerstone Analytics reports global daily air traffic is only 10% lower than the start of the year compared with 65% lower in April. On the other hand, supply contracted materially in response to the coronavirus. OPEC+ announced an 8 mm b/d production cut that took effect in May and so far compliance has been extremely high. Non-OPEC+ production fell dramatically as concerns surrounding full storage and record low prices led producers to actively shut-in wells. The International Energy Agency (IEA) reports non-OPEC+ production fell by nearly 5 mm b/d between April and June led mostly by the US and Canada—very much in line with our predictions from the last letter. The sharp decrease in supply along with better than expected demand kept inventories from hitting maximum capacity in May. As investors and traders realized the acute phase of the dislocation had passed, WTI rose steadily from a low of -$37 per barrel on April 20 to $40 by June 30. Investors’ focus has now shifted to how quickly supply can be brought back to meet recovering demand. While most investors believe the lost production will be easily brought back online, our models tell us something vastly different. While OPEC+ production will likely rebound, non-OPEC+ supply will be extremely challenged. Instead of recovering, our models tell us that non-OPEC+ production is about to decline dramatically from today’s already low levels. Thus far, the slowdown in non-OPEC+ production has come entirely from proactively shutting in existing production. These wells were mostly old and only marginally economic before prices collapsed. Going forward, production will be impacted by a different and longer-lasting force. Low prices led producers to curtail nearly all new drilling activity. As recently as March 13th, there were 680 rigs drilling for oil in the United States. In less than four months, the US oil directed rig count fell by 75% to 180—the lowest level on record. There is at least a two-month lag between drilling a well and first production, suggesting hardly any of the drilling slowdown impact has shown up in production data yet. That is about to change. Shale wells enjoy strong initial production rates but suffer from sharp subsequent declines. Basin production falls quickly unless new wells are constantly drilled and completed to offset the base declines. Considering US shale production was already falling sequentially back in November when the rig count was above 700, today’s 180 rigs all but guarantee production will collapse going forward. Nevertheless, the IEA predicts US production will grow by 500,000 b/d from the June lows to the end of the year, presumably driven by shut-in production being brought back online. Our models tell us this simply cannot happen. Instead of growing, US production will fall materially from here. As we go to print, the EIA just released its monthly report with data through May showing production fell by another 2 m b/d sequentially. This is the largest monthly production drop on record and nearly twice as much as originally expected by most analysts. Our models tell us more surprises like this are forthcoming. Low prices have led to a sharp drilling slowdown in the rest of the world as well. Between February and June, the non-US rig count fell by 40% to 800 – also the lowest on record. We have often written about the depletion problem facing the non-OPEC+ world outside of the US shales. Over the last decade, this group has seen production decline slowly and steadily as a dearth of new large projects has not been enough to offset legacy field depletion. By laying down half their rigs, this group has also ensured that future production will be materially impacted. Analysts continue to focus their attention on what has already happened (shut-in of existing production) instead of looking at what is yet to come. The unprecedented drilling slowdown over the last three months is only now starting to impact production. Going forward, supply will plummet leaving the market in an extreme deficit starting now. Investors are complacent because inventory levels remain high and are expected to buffer any future imbalance. This is no different than the peak of the last cycle in July 2016—an especially important fact no energy analysts have commented on. In 2016, OECD inventories were 450 mm bbl above long-term seasonal averages and wisdom dictated it would take years (if ever) to work off the overhang. On July 31, 2016, with oil at $40 per barrel, analysts expected prices to remain lower for longer. In fact, it only took 18 months to work off the overhang. By the summer of 2018, inventories were back to near long-term averages and prices had rallied to $87 per barrel. Despite the unprecedented disruptions caused by the coronavirus, June OECD inventories stood only 400 mm bbl above long-term average levels – less than the 2016 high point. Collapsing supply this cycle will draw inventories down much faster than in 2016-2018, a period that enjoyed robust shale growth. Instead of working off the inventory overhang in 18 months, our models suggest this could happen as soon as the end of the year or the first half of 2021. This has been an excerpt of Goehring & Rozencwajg, Natural Resource Investors, Q2 2020 commentary: On The Verge Of An Energy Crisis. Read the full-length document here. Goehring & Rozencwajg Associates, LLC. The information provided on this website is intended to provide the investor with an introduction to Goehring & Rozencwajg Associates, LLC. Nothing on this website should be construed as a solicitation offer, or recommendation to buy or sell any security or as an offer to provide advisory services. Information on this website is intended only for United States citizens and residents. Nothing contained on this website constitutes investment, legal, tax, or other advice nor should be relied upon in making an investment or other decision. Investors should always obtain and read an up-to-date investment services description or prospectus before deciding whether to appoint an investment advisor or to invest in a fund.
Interested in contributing to Portfolio for the Future? Drop us a line at content@caia.org