


By Hossein Kazemi, PhD, CFA, CAIA Association, FDP Institute, and Isenberg School of Management Introduction While Keynes vs. Markowitz is not as thrilling as Ali vs. Frazier, it has important implications for investors when selecting funds and investment managers when constructing portfolios. In this "fight," we have in one corner the father of macroeconomics and one of the most influential economists of all time, John Maynard Keynes. He advocated a strategy of holding a concentrated portfolio. In the 1920s, Keynes seemingly followed a global macro strategy. When reflecting on his investment record, Keynes wrote that: "We have not proved able to take much advantage of a general systematic movement out of and into ordinary shares as a whole at different phases of the trade cycle." Disappointed with his performance, he switched to a stock-picking strategy in the 1930s, opting for a concentrated portfolio. He wrote: "As time goes on, I get more and more convinced that the right method in investment is to put fairly large sums into enterprises which one thinks one knows something about and in the management of which one thoroughly believes." His performance improved during this period outperforming the benchmark of about 6% per year with about 5% higher annual volatility. In the other corner, we have the father of modern finance, Harry Markowitz, who has always believed in diversification. In his seminal paper, he rejected the prevailing approach of focusing on maximizing expected return and wrote: "If we ignore market imperfections, the foregoing rule never implies that there is a diversified portfolio which is preferable to all non-diversified portfolios. Diversification is both observed and sensible; a rule of behavior which does not imply the superiority of diversification must be rejected both as a hypothesis and as a maxim." In this short note, we examine the risks and benefits of holding concentrated portfolios. Both theory and available empirical evidence inform our exposition. First, we begin our discussion with a simple example that can help us understand available empirical evidence's implications for the long-term performance of U.S. and global stocks. Suppose there is a lottery game that pays more than it collects. It issues 1000 tickets where each ticket costs $1, and the winning ticket pays $1,100. Once the drawing is completed, we will have 999 losers (with -100% return) and one winner (with +109900% return). The mean return on a portfolio of all tickets will be +10%, while the median return is -100%. That is, more than 50% (actually 99.9%) of the tickets will earn -100% return. The reason for such a significant difference between mean and median is that the lottery's return is extremely skewed to the right. It turns out that the U.S. and non-U.S. stocks' historical performances have some similarities to our simple lottery game. Second, we present some important and jaw-dropping figures about the long-term performances of U.S. and non-U.S. stocks. We begin with some highlights from Bessembinder (2018) study, which covers the 1926-2016 period:
- Only 42.6% of U.S. stocks have had buy-and-hold returns that exceed the return on the one-month T-bill during this period.
- Less than half of S. stocks have had a positive return during this period, with the most frequent outcome being -100% return.
- A randomly selected concentrated portfolio of 1 stock underperforms the market 73% of the time.
In a more recent paper, Bessembinder et al. (2020) extend the above study to global markets. They report similarly astonishing results (data covers the 1990-2020 period):
- Buy-and-hold returns of 56% of U.S. stocks and 61.3% of non-U.S. stocks were less than the return on the one-month U.S. T-bill rate.
- The additional shareholder wealth created by U.S. and ex-U.S. stocks during this period was more than $56.2 trillion.
Finally, in a similar study, J.P. Morgan (2014) reports (with data covering the 1980-2013 period):
- More than 40% of all U.S. stocks that were part of Russell 3000 have experienced a maximum drawdown of 70% during this period. More importantly, many of these stocks never recovered those losses. In fact, most of these stocks experienced at least a 60% permanent drawdown over the entire period. These drawdown figures were even higher for some critical sectors such as biotech and information technology
- More than 66% of stocks belonging to Russell 3000 underperformed the index during this period.
- Only 7% of the stocks significantly outperformed the Russell 3000 index, while the median stock underperformed the index by -54% on a cumulative basis during this period.
How could an average stock lose money when during the 1990-2020 period, the global stock markets created more than $56 trillion in shareholder wealth? The answer goes back to our simple lottery example. In fact, with some changes, the lottery example can replicate many of these properties. The following graph highlights the highly skewed nature of U.S. equity returns over the last 40 years: 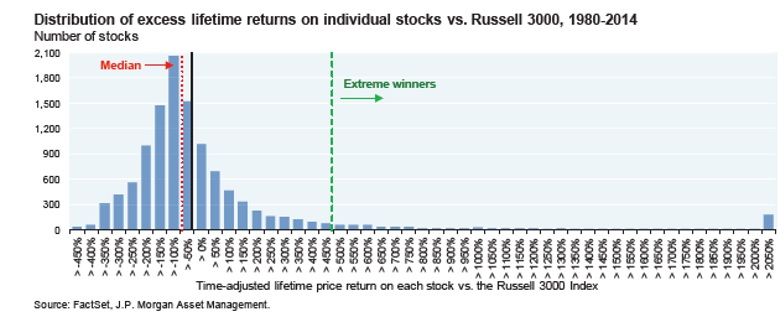 We can see that a relatively small number of stocks have provided extremely high returns during this period and are responsible for the bulk of the Russell 3000 performance since the 1980s. An active manager who failed to allocate to these extreme winners had little chance of matching, let alone outperforming, broad benchmarks. Since more than 50% of the stocks have significantly underperformed broad benchmarks during this period, avoiding the worst performers could represent a path for active managers to outperform these benchmarks. The empirical results summarized below show that some active managers can outperform their benchmarks by creating diversified portfolios with significantly different holdings than their benchmarks. The above statistics point to the challenge of outperforming broad indices using concentrated portfolios. Two additional pieces of evidence regarding important events further suggest that active managers must be even more skilled to outperform diversified buy-and-hold investment strategies:
- Savor and Wilson (2013) examine stock market return around important macroeconomic announcements. They show that the average announcement day excess return from 1958 to 2009 is 11.4 basis points versus 1.1 basis points for all the other days, suggesting that over 60% of the cumulative annual equity risk premium is earned on a few announcement days.
- Lucca and Moench (2016) document that since 1994, the S&P 500 index has on average increased 49 basis points in the 24 hours before scheduled FOMC announcements. As a result, about 80% of annual realized excess stock returns since 1994 are concentrated around FOMC announcements.
In short, if a manager misses the 25 strongest days in the market since 1990, that manager's performance would be no better than that of the U.S. Treasuries. Putting these two strands of research together, we come to the sobering conclusion that, for an active manager to outperform the market, the manager must be invested most of the time and have the skill identify the 7% of the listed stocks that are responsible for most of the stock market's gain. The theory or the math behind these results is relatively simple. Heaton, Polson, and Witte (2017) and Farago and Hjalmarsson (2019) show how the compounding of returns leads to highly skewed distributions over long-horizons. If the average return is positive, the cumulative return distribution will be positively skewed, making the median of the return distribution much smaller than its mean. In other words, while the average annual returns on an index of stocks over a long period might be 10% per year, most stocks will underperform the index (assuming that the stock returns are not highly correlated). The following table displays some numerical values regarding this result: 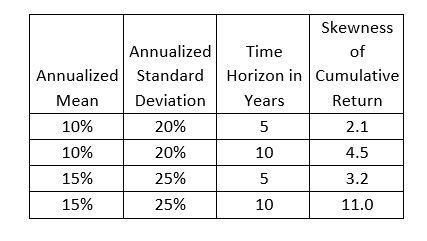 The above figures are obtained, assuming zero skewness of annual returns of individual stocks. If annual returns display positive skewness, the cumulative return's distribution becomes even more skewed. Equity prices display some skewness on an annual basis. Active Management: Active Shares, Concentrated Portfolios, and Market Timing The statistics described above illustrated why active managers who hold concentrated portfolios and/or try to time the market must be highly skilled to outperform broad indices, after fees. So, what is the empirical evidence regarding active equity managers? Before we go further, we must acknowledge that active investment strategies come in many flavors. For simplicity, we consider the following three categories.
- Active Share: An active manager may construct portfolios with a large active share, which is a measure of the percentage of stock holdings in a manager's portfolio that differs from the benchmark index. The first rigorous study of active share appeared in Cremers and Petajisto (2009), which demonstrated that high active share was a critical component of outperformance for active managers of the U.S. equity portfolios. Examining 2,650 funds from 1980 to 2003, they found that of the highest-ranking active funds, those with an active share of 80% or higher beat their benchmarks by an annualized 5% before fees and by 1.5% after fees. Of course, to outperform a benchmark, a manager's portfolio must differ from it. Therefore, it is obvious that managers that outperform the market must have high active shares. However, it is unclear why managers who create portfolios with high active shares should outperform their benchmark in subsequent periods. Unskilled managers are equally capable of creating portfolios with high active shares. One explanation is that unskilled active managers will become closet indexers to reduce the probability of underperforming the benchmark by a significant amount. By the way, in a follow-up study, Cremers and Pareek (2016) show that managers with high active shares and low turnover have even better out-of-sample performance.
- Concentrated Portfolios: Concentrated portfolios have, by definition, large active shares. However, it is possible to have high active share portfolios that are not concentrated. That is, one can construct well-diversified portfolios with high active shares. There is some evidence that active managers who hold concentrated portfolios tend to outperform their benchmarks. Yang and Kazemi (2020) examined the performance of the concentrated positions held by equity-oriented hedge funds. They show that funds with the most concentrated positions outperformed diversified funds by 39 to 61 basis points per month from 1994-2018. The results are stronger for concentrated portfolios of small-cap stocks. Again, it is easy for unskilled managers to hold concentrated portfolios. However, as stated above, the probability of significant underperformance is relatively large, and, therefore, unskilled managers are reluctant to risk losing capital and job.
The results regarding the outperformance of concentrated portfolios are less clear cut than those with high active shares. While Yang and Kazemi (2020) show that hedge funds with concentrated portfolios tend to outperform their diversified peers, a recent study (Bryan (2019)) shows that the above results do not extend to mutual funds. The paper reports some performance differences (before fees) between the most diversified and the least diversified mutual funds. However, the results were not statistically significant and did not repeat in every subperiod. Further, the paper shows a significant relationship between concentration and fees – funds with concentrated portfolios charging higher fees.
- Market Timing: Market timing is another form of active management that can be implemented using concentrated portfolios, high active share portfolios, or diversified portfolios. Many studies have examined the market timing skills of hedge funds and mutual funds. Surprisingly, no study has examined the market timing ability of high active share of funds. It suffices to say that some hedge funds (including CTAs) appear to have market timing skills. Studies show that around 20% of hedge funds display market timing skills, especially during volatile and bear markets, and can outperform less active funds by about 5% per year. The results regarding the market timing of mutual fund managers are less clear. Earlier studies (the 1980s-90s) found significant market timing ability among more than half of mutual fund managers. Recent studies have confirmed these results using daily data and mostly in the context of timing market volatility. Interestingly, these skills do not seem to translate into higher after-fee performance relative to benchmarks.
Conclusion Empirical studies show that most U.S. and non-U.S. stocks have lifetime buy-and-hold returns that are less than returns on U.S. one-month T-Bills. Also, many of these stocks (around 40%) fail to generate a positive return over their lifetimes. If these are not enough to make active selections of stocks challenging, there is empirical evidence that the bulk of returns on U.S. benchmarks accrue on a handful of days. This means that an active stock picker who also attempts to time the market must be highly skilled to match the return generated by a passive allocation to a diversified portfolio of stocks. Active managers are aware that underperforming benchmarks for extended periods would result in the loss of funds and employment. This may explain the rise of closet indexers who charge fees in line with actively managed funds but create portfolios with little tracking error to their benchmarks. Consequently, investors pay for active management and end up getting an almost indexed fund. If an unskilled manager randomly creates a concentrated portfolio, the chances are very high that the portfolio will underperform the benchmark. Given the risk of losing capital and their job, one could argue that those active managers willing to bear these risks must be confident in their skills. The empirical evidence provided by the active share literature shows that there is some truth to this hypothesis. Funds with the highest level of active shares tend to outperform their benchmarks in subsequent months. Portfolios with high active share could still be well diversified. On the other hand, concentrated portfolios have high active shares, by definition. The available results regarding concentrated funds are mixed. Equity oriented hedge funds with concentrated positions tend to outperform their peers and to generate alpha. Mutual funds with concentrated portfolios tend to underperform their peers and benchmarks net of fees. References Amenc, Noël, Frédéric Ducoulombier, Felix Goltz, Ashish Lodh and Sivagaminathan Sivasubramanian (2016), Diversified or Concentrated Factor Tilts? The Journal of Portfolio Management Winter 2016, 42 (2) 64-76. Bessembinder, Hendrik (Hank), Do Stocks Outperform Treasury Bills? (May 28, 2018). Journal of Financial Economics (JFE), Forthcoming, Available at SSRN: https://ssrn.com/abstract=2900447 or http://dx.doi.org/10.2139/ssrn.2900447 Bessembinder, Hendrik (Hank) and Chen, Te-Feng and Choi, Goeun and Wei, Kuo-Chiang (John), Do Global Stocks Outperform U.S. Treasury Bills? (July 5, 2019). Available at SSRN: https://ssrn.com/abstract=3415739 or http://dx.doi.org/10.2139/ssrn.3415739 Bryan, Alex (2019) Portfolio Concentration Doesn't Have Much Sway on Returns Cembalest, Michael (2014), The Agony and the Ecstasy: The Risks and Rewards of a Concentrated Stock Position, J.P. Morgan Asset Management. Cremers, K. J. Martijn and Pareek, Ankur, Patient Capital Outperformance: The Investment Skill of High Active Share Managers Who Trade Infrequently (December 1, 2015). Journal of Financial Economics (JFE), Forthcoming, Available at SSRN: https://ssrn.com/abstract=2498743 or http://dx.doi.org/10.2139/ssrn.2498743 Cremers, K. M., & Petajisto, A. (2009). How active is your fund manager? A new measure that predicts performance. Review of Financial Studies, 22(9), 3329-3365. Farago, Adam and Hjalmarsson, Erik, Compound Returns (June 3, 2019). Proceedings of Paris December 2019 Finance Meeting EUROFIDAI - ESSEC, Available at SSRN: https://ssrn.com/abstract=3398501 or http://dx.doi.org/10.2139/ssrn.3398501 Heaton, J.B. and Polson, Nick and Witte, Jan, Why Indexing Works (May 10, 2017). Applied Stochastic Models in Business and Industry 33 (6), 690-693., Available at SSRN: https://ssrn.com/abstract=2673262 or http://dx.doi.org/10.2139/ssrn.2673262 Savor, P., and Wilson, M. (2013). How Much Do Investors Care About Macroeconomic Risk? Evidence from Scheduled Economic Announcements. Journal of Financial and Quantitative Analysis, 48(2), 343-375. Lucca, David O. and Moench, Emanuel, The Pre-FOMC Announcement Drift (July 26, 2013). Journal of Finance, Forthcoming, FRB of New York Staff Report No. 512 , Available at SSRN: https://ssrn.com/abstract=1923197 or http://dx.doi.org/10.2139/ssrn.1923197 Yang, Xiaohui and Hossein B. Kazemi (2020), Holdings Concentration and Hedge Fund Investment Strategies. The Journal of Alternative Investments Spring 2020, 22 (4) 92-106.
Interested in contributing to Portfolio for the Future? Drop us a line at content@caia.org