


By Paul Kamenski and Robert Lam, Co-Heads of Credit at Man Numeric.
A comprehensive understanding of the application of factors is crucial for investors in quant credit.
1. Introduction
Traditionally, discretionary managers in credit have sought to identify mis-pricings through fundamental analysis. Credit tends to be dominated by large, buy-and-hold investors and the availability and speed of information dissemination has historically been slower than in equities. With the advent of electronic trading, significant availability of data and the subsequent rise of quant credit, all this is changing. The meeting of a slow-moving, inefficient market with quant strategies that exist to exploit such inefficiencies has led to a raft of opportunities for those with the platforms to exploit them.
Factors are the building blocks of many quantitative strategies and quant equity investment provides a useful model for talking about quant credit. At the same time, we should not blindly apply the lessons of the equity markets to credit, hoping that the results will be the same. The style factor types used in quant equity are also prevalent in the credit markets (although with some key differentiating elements). As with equities, academic research has shown that the majority of returns can be attributed to style factors in credit. This article will provide an overview of the most commonly employed factors in quant credit, focusing on historical performance and drawing out both differences and similarities between factors as they are used in equities, and their application in quant credit.
Style factors emerged from the investigation of market anomalies – strategies that appeared to generate consistently above-market returns. All factors seek to capture that anomaly. So, in the equity markets, Value looks for firms whose stocks are undervalued relative to some consistent financial metric – price-to-book (‘P/B’) or price-to-earnings (‘P/E’); Momentum looks for firms whose shares have been rising in value and seeks to ride that wave; Size attempts to exploit the fact that smaller firms have historically tended to outperform larger companies. When it comes to quant credit, style factors are somewhat different, as we shall see.
2. Overview of Key Factors
We now set out the most common style factors employed in quant credit and how they specifically address the nuances of the corporate bond market.
2.1. Value
One of the principal fundamentally driven style factors, Value looks for bonds that are undervalued relative to other bonds judged by a specific financial metric. At its simplest, Value selects cheaper (higher spread) bonds over more expensive (lower spread) for the same underlying credit rating. We could also calculate a theoretical fair spread level by estimating the probability of default and recovery rates and establishing whether the market is correctly rewarding us for the risk of loss.
In more sophisticated models, managers move beyond credit ratings, which tend to be backward-looking and lagging indicators of fundamental credit quality and seek to develop proprietary models that control for characteristics such as industry, quality, issuer fundamentals and duration. Only once these control mechanisms have been implemented can we develop a true picture of bonds whose option adjusted spreads (‘OAS’ – a measure of spread that adjusts for embedded optionality such as callability within a bond’s structure) are wider than is justified by their fundamental credit risk. There have been a number of attempts to define consistent measures of Value in credit investing, including both excess spread to peers (‘ESP’) and spread per unit of debt to earnings ratio (‘SPiDER’), both identified by Arik Ben Dor et al. in ‘Systematic Investing in Credit’.
We use a variant of the second of these approaches as an example in Figure 1, highlighting several of the biases inherent in many relative value approaches. There is a spectrum of signal refinement in quant approaches that can span from more raw factors with biases or tilts left embedded, to more highly refined factors which aim to largely remove risk exposures focusing on more idiosyncratic dislocations. Of course, with raw factors comes simplicity of construction and often ease of interpretability: you know exactly what you are getting. We find that with more highly refined approaches, removing unintended biases or risk exposures often improves consistency and reduces volatility of what can be often quite volatile raw factor returns.
Below we start by looking at OAS per unit of leverage, measured as net debt to EBITDA. A raw relative value score like that can produce excess return but can also come with several embedded biases. We find that looking at overall factor tilts as well as group biases can help refine the signal, improving efficacy.
Figure 1: Signal Transformation Schematic
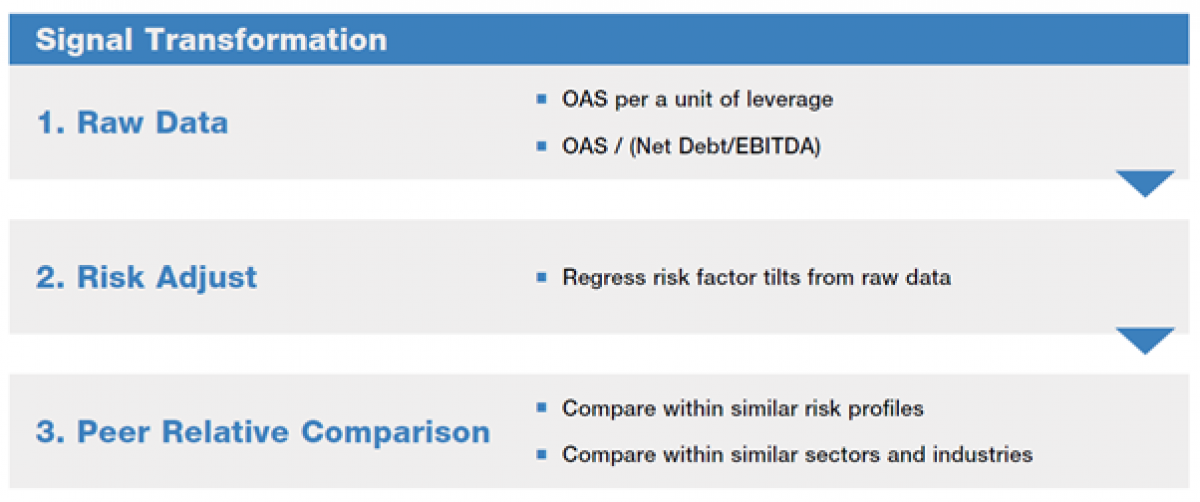
Source: Man Group. For illustrative purposes only.
It has been noted by several studies that Value has performed better as an investment strategy in credit markets than it has in equities. This appears particularly to be the case over the past decade. While the concept of buying cheap can be applied across asset classes, we find Value as a factor requires entirely new model specifications compared with equities. Cheap equity does not imply cheap bond and vice versa. It’s worth noting also that Value stands out as being particularly bond-specific, that is to say that within the same capital structure, even after accounting for liquidity, subordination, duration, etc., mispricing can remain.
2.2. Momentum
Again, when we come to Momentum, there is a basic definition that cleaves closely to the version employed by quant equity. This seeks to follow price trends for bonds, looking at price movements over various horizons and investing in those securities that have outperformed over the specified time horizon. It is worth highlighting that we find greater overlap between equity and credit Momentum than in other factors. We generally find trends to be consistent across a capital structure and indeed across broader groups/ecosystems as well; these trends therefore tend to be less issue-specific and more at an issuer-level.
As noted above, however, the bond markets are significantly more price-inefficient than equities due to the buy-and-hold approach of many of the largest players. This means that looking at bond prices alone is deemed insufficiently robust as far as signal construction goes, particularly when it comes to investment grade credit. Research by Khang and King (2004) and Gebhardt, Hvidkjaer and Swaminathan (2005) indicated that bonds had a tendency to revert to mean pricing levels over time, while further analysis by Jostova et al. (2013) indicated minimal effects from following Momentum strategies in investment grade, but a more meaningful impact in the high yield market. This superior performance of Momentum strategies in high yield is confirmed in research by Pospisil and Zhang (2010).
We believe, however, that to develop a more powerful Momentum signal, one should look at price information from across a firm’s capital structure, given that stock prices tend to move swiftly and meaningfully as a result of new information and equity performance often has a spillover into bond pricing. Ben Dor et al. (2021) define equity Momentum in credit (‘EMC’) as a measure that seeks to use past equity returns to identify debt issuers likely to out- or under-perform their peers.
Momentum strategies also take into account the historical speed that fundamental information disseminates within a firm’s broader ecosystem, seeking to invest in the bonds of firms whose securities have historically underreacted to strong fundamental performance.
There is a vast amount of information quant approaches can use to not only look at historical security returns, but to identify and go long issuers with favourable business trends and to avoid or go short issuers experiencing contraction. Momentum, broadly speaking, is a pillar into which one effectively incorporate a vast array of different types of signals and alternative data sets. If the credit markets have historically been focused largely on relative value approaches and credit quality, then Momentum signals picking up on strong underlying business trends and changes in key performance indicators (‘KPIs’) may in fact be one of the biggest opportunities for systematic approaches to leverage the breadth of data and data science.
2.3. Other Factors: Size, Carry, Quality, Low-Risk and Informed Investor
There are a number of other style factors employed in quant credit that are worth mentioning here. It should be noted that many of these intersect with Value and/or Momentum, or with each other, such that factors can be thought of as overlapping Venn diagrams rather than conceptually discrete. As the quant credit investment world grows and matures, we expect these style factors to become more clearly defined and to have a greater degree of statistical corroboration.
Size privileges smaller companies based on the market value of their outstanding bonds. There is little academic analysis of Size as a factor, with only Houweling and Van Zundert (2017) suggesting that there is a positive Size premium in corporate bonds, while Alquist, Israel and Moskowitz (2018) argued that the Size effect was either immaterial or marginally negative for bonds. We have seen little evidence to suggest that Size is a meaningful factor in quant credit, especially after transaction costs; we certainly do recognise that it can be a driver of volatility (i.e. it is a clear risk factor). There can be fairly meaningful market-relative returns both positive and negative to a Size factor.
Like Value, Carry is a factor that will be familiar to discretionary market participants. Koijen et al. (2018) analysed Carry in a variety of asset classes, including corporate bonds. They define Carry as the “return of an asset assuming that prices stay the same”. Notwithstanding the higher risk implied by higher yields, Koijen et al. find that the Carry factor has, on average, positive returns, with Sharpe Ratios between 0.4 and 0.5. Over the long run, Carry appears to offer a significant premium, but with incredibly high volatility of returns. This lack of consistency means that Carry as a signal can have both fantastic and very poor years in terms of benchmark relative performance.
Quality in credit is similar in spirit to the Quality factor in equities, save that the metrics specified are often more related to leverage or interest coverage. It’s worth noting that although ‘quality’ and ‘credit rating’ are often used interchangeably, Quality as a systematic factor need not simply tilt a portfolio towards higher credit ratings. More refined versions of Quality are often constructed to be credit rating neutral and more peer relative. It’s interesting that credit quality analysis forms such a significant element of most discretionary managers’ approach and yet, as shown in research by Henke, Kaufmann, Messow and Fang-Klingler (2014), Quality bears very little relation to performance, at least in a more raw form in investment grade credit. Bender and Samata suggest that there is some evidence that applying a Quality factor can reduce risk and improve risk-adjusted returns in a 60/40 equity/bond portfolio.
Low-Risk strategies (which are often expressed as a sub-set of the Quality factor) exploit the observation that bonds that exhibit lower volatility tend to perform better on a risk-adjusted basis over time. This reflects the fact that – unlike equities – bonds tend to experience more volatility on the downside than on the upside: the tightening of a bond on the upside towards risk free rates is typically asymmetrically smaller than the jump to recovery in situations of distress. Low-Risk factor signals generically target shorter-dated, higher-rated bonds.
The Informed Investor style factor looks to exploit information about investor activity to drive investment decisions, working along a ‘wisdom of crowds’ thesis. This harnesses data points such as short interest and call/put positioning to build a picture of investor activity across markets. While this factor is hampered by the slow-moving nature of the traditional bond-buying investor base, there is some evidence (Illmanen, 2011) to show that it delivers superior returns, particularly when employed in combination with other style factors.
This later point segues nicely into the conclusion of this paper on style factors. In quant equity, it has become clear that no single style factor is sufficient to address the different faces of the markets. As such, investors are increasingly using multi-factor models that seek to achieve two distinct goals: to deliver strong returns in a variety of different market conditions and to deliver excess returns in a manner that is uncorrelated with both the corporate bond market indices and with equities. Figure 2, taken from Henke et al. (2020) shows pairwise correlations across various style factors. The low or negative nature of these correlations means that a multi-factor portfolio substantially increases the risk-adjusted return while reducing volatility.
Figure 2: Pairwise Correlations Across Style Factors

Source: ‘Factor Investing in Credit’ Henke et al; as of 2020.
The most sophisticated investors will create their own proprietary models that adapt traditional factor models and deploy them in varying combinations based on the market environment.
3. Conclusion
We will conclude this paper with a few thoughts about complexity. We recently participated in a survey of quant credit managers by a Dutch pension fund. They broke managers in the quant credit space down into those who were more sophisticated in terms of both model construction and data usage, and those whose engagement is more simplistic. It’s a striking observation. On the one hand, simple models tend to experience faster alpha decay (as we have seen in the equity markets). On the other hand, more sophisticated models may expose themselves to overfitting and a loss in transparency.
Our belief is that the quant credit space will necessarily follow quant equity by increasing in complexity and sophistication and that simplistic models will find that they are overtaken by those firms with the modelling skills and data analysis expertise that allow them to execute with greater precision and speed. Overfitting is always a risk in quant strategies but can be mitigated by best practice in research and analysis of model inputs and outputs.
A comprehensive understanding of the application of factors is crucial for investors in quant credit. These factors, and their interaction, are what drive a portfolio optimisation process to pick one issuer, one bond over another. Of course, risk management, transaction cost modelling, liquidity management and portfolio construction generally are also critical pieces to any systematic process, but the ability or opportunity to generate excess return lies most closely with these factors. Whether systematic or discretionary, credit strategies of all types are trying to use more data and more quantitative techniques, not less. The direction is clear. Those that can successfully leverage, combine and build on these insights will not only be able engage the breadth of data that continues to grow, but to also come to some real depth.
Summary: Whether systematic or discretionary, credit strategies of all types are trying to use more data and more quantitative techniques. To do this well, it is crucial that investors have a comprehensive understanding of the application of factors: it is factors, above all, which drive portfolio returns.
About the Authors:
Robert Lam is co-head of credit at Man Numeric. He is responsible for the development and day-to-day portfolio management of all Credit Strategies.
Prior to joining Man Numeric in 2018, Robert was a principal at Apollo Global Management, where he led quantitative research and data science for the liquid credit opportunistic business. Previously, he was a portfolio manager at Incapture. Prior to that, Robert worked in structured credit at Deutsche Bank Securities.
Robert received a bachelor of applied science degree in systems design engineering from the University of Waterloo.
Paul Kamenski is co-head of credit at Man Numeric. He is responsible for the development and day-to-day portfolio management of all credit strategies.
Paul began his tenure at Man Numeric in 2012 as a portfolio analyst. In 2014, he became a member of the strategic alpha research team where he took the lead in Man Numeric’s research efforts into the fixed income corporate bond strategy space. Before joining Man Numeric, Paul was a corporate analyst at MF Global. Prior to that, he worked at Oak Ridge National Laboratory.
Paul received a bachelor’s degree in materials engineering from the University of Wisconsin, and a master’s degree in materials modeling from the University of Oxford. He is a CFA charterholder.
Disclaimer: Hypothetical Results are calculated in hindsight, invariably show positive rates of return, and are subject to various modeling assumptions, statistical variances and interpretational differences. No representation is made as to the reasonableness or accuracy of the calculations or assumptions made or that all assumptions used in achieving the results have been utilized equally or appropriately, or that other assumptions should not have been used or would have been more accurate or representative. Changes in the assumptions would have a material impact on the Hypothetical Results and other statistical information based on the Hypothetical Results. The Hypothetical Results have other inherent limitations, some of which are described below. They do not involve financial risk or reflect actual trading by an Investment Product, and therefore do not reflect the impact that economic and market factors, including concentration, lack of liquidity or market disruptions, regulatory (including tax) and other conditions then in existence may have on investment decisions for an Investment Product. In addition, the ability to withstand losses or to adhere to a particular trading program in spite of trading losses are material points which can also adversely affect actual trading results. Since trades have not actually been executed, Hypothetical Results may have under or over compensated for the impact, if any, of certain market factors. There are frequently sharp differences between the Hypothetical Results and the actual results of an Investment Product. No assurance can be given that market, economic or other factors may not cause the Investment Manager to make modifications to the strategies over time. There also may be a material difference between the amount of an Investment Product’s assets at any time and the amount of the assets assumed in the Hypothetical Results, which difference may have an impact on the management of an Investment Product. Hypothetical Results should not be relied on, and the results presented in no way reflect skill of the investment manager. A decision to invest in an Investment Product should not be based on the Hypothetical Results. No representation is made that an Investment Product’s performance would have been the same as the Hypothetical Results had an Investment Product been in existence during such time or that such investment strategy will be maintained substantially the same in the future; the Investment Manager may choose to implement changes to the strategies, make different investments or have an Investment Product invest in other investments not reflected in the Hypothetical Results or vice versa. To the extent there are any material differences between the Investment Manager’s management of an Investment Product and the investment strategy as reflected in the Hypothetical Results, the Hypothetical Results will no longer be as representative and their illustration value will decrease substantially. No representation is made that an Investment Product will or is likely to achieve its objectives or results comparable to those shown, including the Hypothetical Results, or will make any profit or will be able to avoid incurring substantial losses. Past performance is not indicative of future results and simulated results in no way reflect upon the manger’s skill or ability.
Important Information This information is communicated and/or distributed by the relevant Man entity identified below (collectively the ‘Company’) subject to the following conditions and restriction in their respective jurisdictions. Opinions expressed are those of the author and may not be shared by all personnel of Man Group plc (‘Man’). These opinions are subject to change without notice, are for information purposes only and do not constitute an offer or invitation to make an investment in any financial instrument or in any product to which the Company and/or its affiliates provides investment advisory or any other financial services. Any organisations, financial instrument or products described in this material are mentioned for reference purposes only which should not be considered a recommendation for their purchase or sale. Neither the Company nor the authors shall be liable to any person for any action taken on the basis of the information provided. Some statements contained in this material concerning goals, strategies, outlook or other non-historical matters may be forward-looking statements and are based on current indicators and expectations. These forward-looking statements speak only as of the date on which they are made, and the Company undertakes no obligation to update or revise any forward-looking statements. These forward-looking statements are subject to risks and uncertainties that may cause actual results to differ materially from those contained in the statements. The Company and/or its affiliates may or may not have a position in any financial instrument mentioned and may or may not be actively trading in any such securities. This material is proprietary information of the Company and its affiliates and may not be reproduced or otherwise disseminated in whole or in part without prior written consent from the Company. The Company believes the content to be accurate. However accuracy is not warranted or guaranteed. The Company does not assume any liability in the case of incorrectly reported or incomplete information. Unless stated otherwise all information is provided by the Company. Past performance is not indicative of future results.