


By Steve Nesbitt , Chief Executive Officer and Chief Investment Officer of Cliffwater.
In an updated fee survey1 for investment management services for middle market corporate lending covering 49 of the largest direct lending firms managing $541 billion in direct lending assets, we find:
- Fees for private partnerships average 3.14%2 of net assets, up from 3.00% last year.
- The larger year-over-year increase in fees comes from new higher fee partnership offerings.
- The 3.14% average rate for fees equals 26% of the 12.01% average gross- of-fee portfolio return assumption, including leverage, up from 24% one year ago.
- Fees as a percent of net assets vary considerably across managers, ranging from 2.22% (10th percentile) to 4.15% (90th percentile).
- Manager use of portfolio leverage and greater exposure to lower middle market or non-sponsor borrowers are associated with higher fees, while greater exposure to first lien loans is associated with lower fees.
- In a separate survey of direct lending partnership expenses, covering administrative, professional, and other expenses, Cliffwater found that expenses average 0.42% of net assets, bringing total direct lending fees and expenses to 3.56% (3.14% plus 0.42%)
Investors continue to inquire about fees and the value proposition offered by active management, particularly for the higher fees found in alternative investments. This paper updates fee data on investment services for middle market corporate direct lending; identifies unique features found in direct lending fees; presents an “apples-to-apples” fee measurement protocol to better compare managers who have different fee structures; and finally, gives statistical results that attempt to explain why some managers might reasonably have higher or lower fees compared to the average.
Data
We collect fee, expense, and portfolio information from 49 direct lending managers who collectively manage $541 billion in direct lending assets and offer limited partnership interests in private partnerships upon which our fee analysis is based. Portfolio information includes use of portfolio leverage, loan seniority, borrower size, and allocations to non-sponsor borrowers, all characteristics found to explain differences in loan yields3 and which may also explain fee differences as well. While the 49 funds examined are not identical, they are substantially similar in their focus on middle market lending as an investment strategy with the majority of capital provided by institutional investors.
Findings
Exhibit 1 provides results from our updated direct lending fee survey covering data collected during the fourth quarter of 2021. Forty-nine of the largest direct lending managers are included in the survey. Fees are broken down into management (column 1) and incentive (columns 4 and 5). Management and incentive fees are combined to report total fees (columns 6 and 8).
A single set of loan assumptions underly the results. Unlevered middle market loan yields, including OID and other prepayment fees4, are assumed to equal 7.75% with a 0.50% annual credit loss ratio. Our research suggests that these gross yield and loss rates are consistent with the study group whose portfolio of middle market loans are 89% senior, 78% sponsor-backed, with a $50 million EBITDA borrower size. Additionally, borrowing costs are assumed to equal 2.80% and administrative and other costs equal 0.42%, both consistent with the characteristics for the study group.
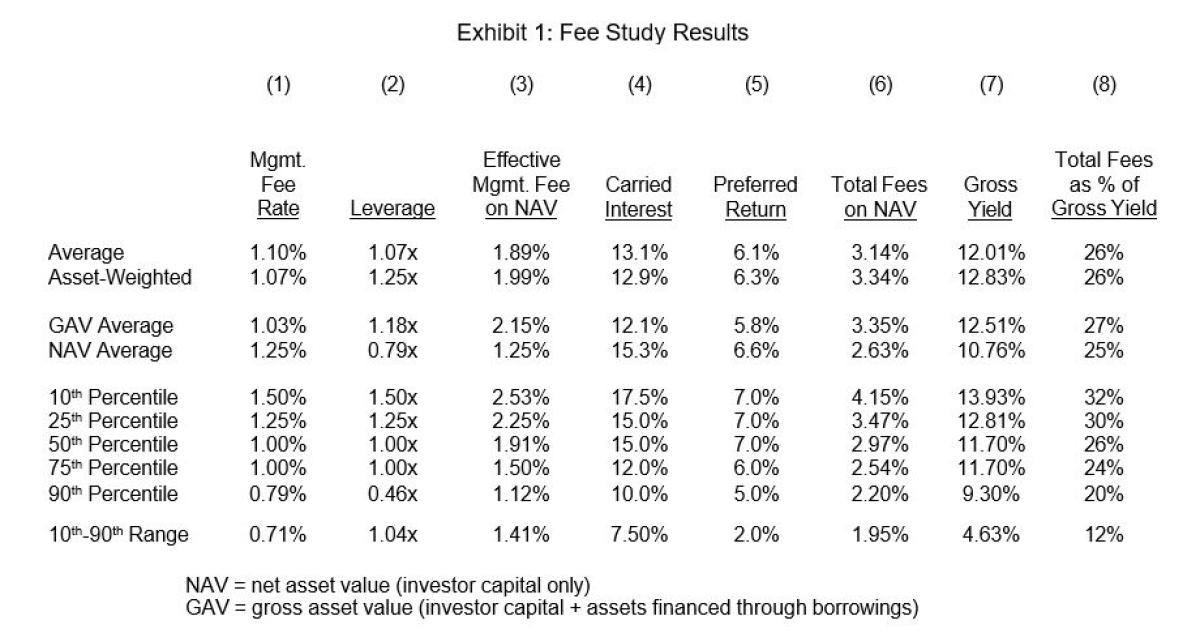
Management Fees. Column 1 reports survey results for management fees. Direct lending management fees are most often charged on invested, not committed assets, and all 49 direct lending managers in our survey charge on invested assets. Private equity managers almost universally charge fees on committed assets during a fund’s investment period. This difference is likely explained by legacy practices, more robust deal flow, shorter investment periods, and a shorter deal life compared to private equity. Fees on invested assets reduce both overall fees and mitigate or eliminate the J-curve phenomena.5
Thirty-five of the 49 direct lending managers (71%) charge fees on gross assets (GAV)6 while the remaining 14 managers base their management fees on net assets (NAV). Outside direct lending, other forms of structured finance (such as CLOs), and some real estate structures, we seldom find management fees charged on gross assets. The argument for charging fees on gross assets is that the resources required of a manager to deploy assets is the same regardless of whether those assets are invested or levered, and in fact, additional resources may be required to maintain the leverage. Weighted by assets, 75% charge management fees on GAV and 25% on NAV.
Column 1 shows considerable variability in management fees, only a fraction of which is explained by whether fees are charged on net or gross assets. The 10th-90th percentile fee range equals 0.71%, which is a very meaningful difference for any asset class.
Leverage. Column 2 reports leverage statistics for the survey group. Most managers use leverage in their private funds (only four do not) with an average equal to 1.07x.7 Not surprisingly, managers that charge management fees on gross assets use more leverage than those that do not. However, those same managers have a lower average management fee (column 1, rows 3 and 4).
Effective Management Fee. Column 3 adjusts the headline fee in column 1 and expresses fees as a percent of net assets (NAV). Average management fees increase from 1.10% to 1.89% of net assets due to some managers charging fees on levered assets (GAV). Of course, for them, the stated average 1.03% management fee on GAV becomes 2.15% as a percent of net assets.
Carried Interest. Column 4 reports carried interest statistics for private debt funds. The vast majority of managers in our survey charge an incentive fee. The average incentive fee equals 13.1%, which is well below the ubiquitous 20% incentive fee found in private equity, with 10% and 15% incentive fees being the two most commonly found. As might be expected, managers that charge management fees on gross assets tend to have lower incentive fees than those charging management fees on net assets, at 12.1% versus 15.3%, respectively.
Preferred Return. The average preferred return equals 6.1%. This is lower than the typical preferred return of 8% for private equity, likely reflecting lower return expectations for direct lending. In almost all cases direct lending funds require a 100% “catch-up” after the preferred return is achieved. Private equity funds generally apply a 50% catch-up which is more investor friendly.
Total Fees on NAV. Direct comparisons of fees can be difficult with the variety in structures and use of leverage. Therefore, we create a single fee measure in column 6 that represents the sum of asset fees and incentive fees, as a percent of net asset value. We calculate total fees on NAV by averaging combined management and incentive fees as a percent of NAV across managers.
We find that the average direct lending manager imposes a combined fee equal to 3.14% of net assets. The average gross of fee expected return equals 12.01%.
Total Fees as % of Gross Income. Column 7 looks at the proportion of gross return that is paid to managers either through management or incentive fees. The 26% average is not materially different from what is found in private equity.8
Factors Explaining Fee Variation. We find that a significant proportion of manager fee variation can be explained statistically by four factors. Leverage is the dominant factor explaining higher fees; explaining lower fees are size of borrower, allocation to senior loans, and allocation to sponsor-backed borrowers.9
In addition to these management fees, Cliffwater found that direct lending private partnerships charged an additional 0.42% of net asset value in non-management expenses, including administrative costs, custody, professional fees, and other costs. Together with management fees, Cliffwater estimates that total fees and expenses for direct lending private partnerships equals 3.56% of net asset value.
Conclusion
Our study finds that 2022 fee rates for direct lending private partnerships will average 3.56%, consisting of 3.14% for management fees and 0.42% for fund expenses. The 2022 rate is slightly higher than the 3.25% rate from the prior year, primarily from modest rate hikes by a few managers and higher expenses. The study also finds considerable fee variability across managers suggesting that investors should assess the unique contributions of managers, such as low loss rates, when considering higher fee private funds.
Study results also help inform investors on expected returns for direct lending private partnerships. The average private fund expected return, net of all fees and expenses, equals 8.45% (12.01% minus 3.56%)
Footnotes:
1 Conducted during the fourth quarter of 2021, updating similar Cliffwater studies in 2018 and 2020.
2 Includes management and incentive fees.
3 See Private Debt: Opportunities in Corporate Direct Lending by Stephen L. Nesbitt, (John Wiley & Sons, 2019), Chapter 9.
4 Original Issue Discount (OID) and fees paid to lenders from early prepayment of principal.
5 See “Corporate Direct Lending and J-Curve Mitigation”, Cliffwater Research, January 2017.
6 Gross assets (GAV) include both investor capital (NAV) plus assets from leverage (borrowings).
7 Leverage is expressed as a multiple of net assets (NAV). A value equal to 1.07x means that the private fund uses borrowings equal to 1.07 multiplied by its net assets, for a gross asset value equal to 2.07 multiplied by net assets.
8 See “The Better Deal: Hedge Funds or Private Equity”, Cliffwater Research, November 2011.
9 Regression statistics are available upon request.
About the Author:
Steve Nesbitt is Chief Executive Officer and Chief Investment Officer of Cliffwater, and is primarily responsible for the day-to-day management of Cliffwater Corporate Lending Fund (CCLFX) and the Cliffwater Enhanced Lending Fund (CELFX), an SEC-registered credit interval fund focused on the US corporate middle market.

Steve is recognized for a broad range of investment research. His papers have appeared in the Financial Analysts Journal, The Journal of Portfolio Management, The Journal of Applied Corporate Finance, and The Journal of Alternative Investments. His private debt research led to the creation of the Cliffwater BDC Index, measuring historical BDC performance, and the Cliffwater Direct Lending Index, measuring historical performance for direct middle market loans. Steve authored the book, Private Debt: Opportunities in Corporate Direct Lending, Wiley Finance (2019) which provides the analytical and empirical underpinnings of the private debt market.
Stephen L. Nesbitt snesbitt@cliffwater.com