


By Kailash Concepts Research. Kailash is a close-knit team that hails from academia and some of the world’s largest and most-respected investment firms.
The Quest for Causation in an Era with Only One Prior Precedent
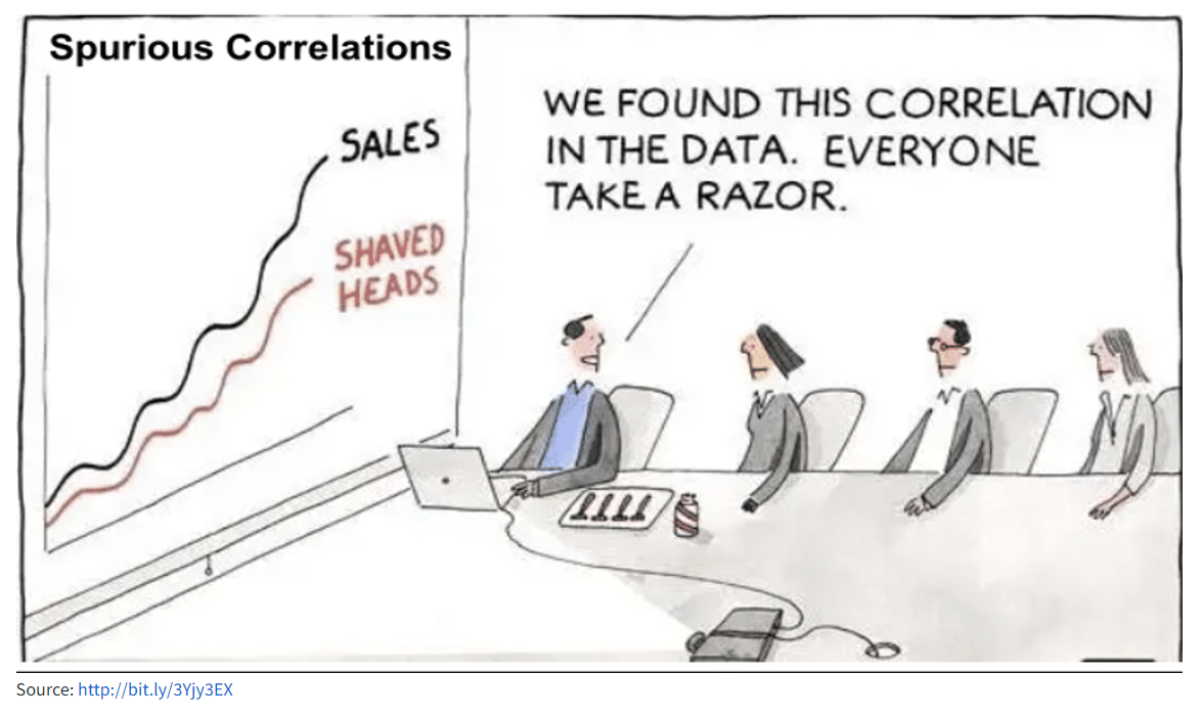
Spurious vs. Specious: The Merriam-Webster dictionary tells us that despite both terms featuring deceptive or deceitful in their respective definitions, there is a surprising difference between “specious” and “spurious.”
Spurious, of “spurious correlation” fame, is explained as outwardly similar or corresponding to something without having genuine qualities.[1] Specious adds an element of appeal or allure.[2] More specifically:
“Specious indicates a superficial or deceptive attractiveness [while] spurious is [merely]… illegitimate. While we might use either word to modify argument, a spurious argument would be based on an illegitimate set of reasons, and a specious argument would be one that has an attractive appearance but is less plausible than it initially appears.”[3] -Merriam-Webster
Let’s simplify the spurious vs. specious definition as follows: spurious arguments point to statistics that suggest strong relationships that don’t exist, while specious ones merely point to pretty pictures.
We bring this up to poke fun at one of our recent posts and the state of “analytical” affairs in the business of equity research. Our work has documented that the bubble, which crested at the end of 2021, featured some of the highest valuations, margins, and debt in nearly a century of American history.
Lacking precedent, this has left many grasping at straws. KCR’s research team has been at this longer than we want to admit. We are used to seeing lots of spurious correlations, but the breaking of this bubble has given birth to an industry of specious research. Too often, there’s not even the pretense of causality.
KCR’s recent missive ARKK vs. QQQ in the Dot.Com Bust represented an unusual post for our team. In an act of ruthless data mining and overfitting, we mapped ARKK’s decline today onto the decline of QQQs during the dot.com bust. This is most emphatically out of step with KCR’s evidence-based research process.
We were clear with our readers that the work was not a “trading call,” much less investment research of any kind. We have reproduced the chart as of publication below. What don’t you see us doing?
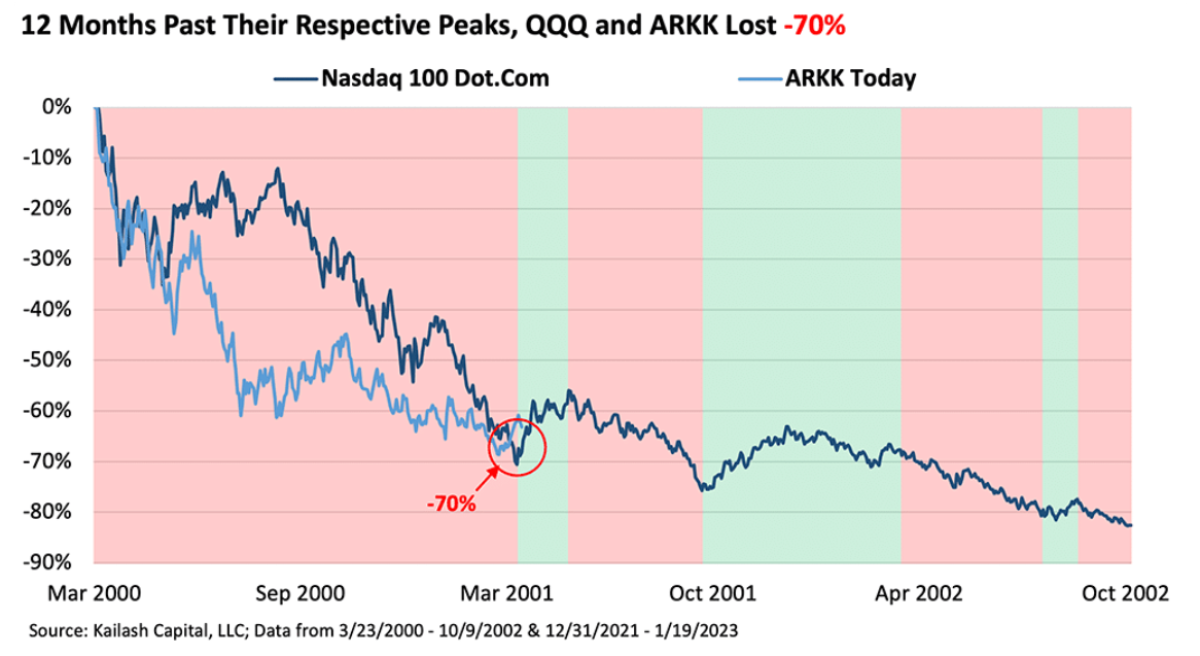
There’s no correlation coefficient on the chart. We avoided adding the correlation because the fit was awful, and even if the fit was high, we knew it would be a spurious correlation. The chart then was little more than specious in nature: it was an attractive picture that created the appearance of a relationship.
In our defense, we made the three following statements before suggesting people focus on fundamentals:
- Please do not misconstrue this as a trading call or investment advice of any kind.
- We have no idea if the post-dot.com precedent will repeat perfectly. History is a rhyming machine, not a repeating machine.
- The broader point we are making is that investors should not be surprised to see a package of low-quality novelty stocks gap higher.
Our point was that while history showed low-quality stocks may bounce around after bubble peaks, investors should focus on fundamentals as they “win” over the long run. And then it happened. 12 months after the S&P 500’s peak, ARKK went on a ripping rally. Up nearly 50% in barely a month. This was just like the QQQs a year after the S&P 500’s peak in the dot.com era.
So, a completely specious chart suddenly appeared to be predictive.
This bizarre coincidence underpins the purpose of the remainder of this paper: to hammer home the need to avoid specious (much less spurious) equity research.
New to the Twitterverse, KCR has seen specious charts drive crowds to frenzied conclusions of dubious merit. This is not a criticism – as we explained above, we’ve indulged as well. We just don’t want to make it a habit.
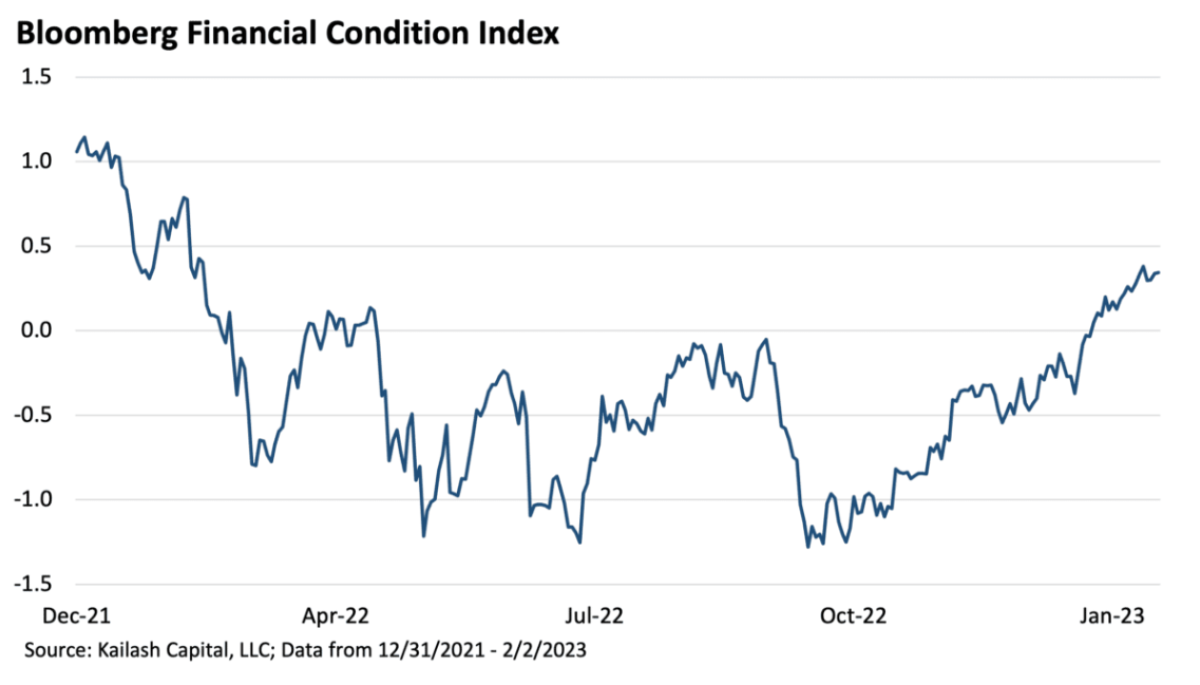
The below chart is the Bloomberg Financial Conditions Index (BFCI). The chart became a common feature in our Twitter thread. The idea is that this metric’s rise off its lows in September 2022 meant “buy.”
The chart below compares the BFCI to the implosion of the QQQs in the dot.com collapse. Looks good right? Wrong. At 0.3, the correlation here is weak, but our human minds can create a lot of false attribution.
When we do that, it is based on a pattern that a) doesn’t exist and b) is coincidental at best.
Using coincidental data to inform your investment decisions is akin to standing in the rain and believing that being wet today can somehow help you predict that rain is coming a week later.
In other words, nonsense.
We have written repeatedly about how the speculative urge does not die easily after big bubbles. This one is proving no different. Back in 2019, we wrote up our short-sellers’ Low Quality Signal (LQS). The piece detailed how our research team came to build a bimodal signal that works to help flag short sellers of low-quality stocks when to press or cut short exposure.
We explained as follows:
The short seller’s Low Quality Signal (LQS) attempts to discern when securities whose valuations KCR believes to be more speculative in nature are likely to experience atypically strong performance. KCR’s predisposition to shop for short candidates among firms we believe suffer from aggressive accounting, suboptimal capital allocation, and valuations predicated on narratives rather than cash flows or some combination thereof means our shorts will typically be susceptible to painful price appreciation when low-quality stocks get a boost. The signal is consistent in its data sources, was built near firm inception in 2010, does not allow any manual intervention by Kailash, and is purely quantitative in construction.
This short seller’s Low Quality Signal (LQS) is actually not something we have used in our asset management practice simply due to its conceptual proximity to market timing. This has proven to be an unfortunate decision as the signal’s backtested results (pre 2010) have only improved in the real world.
Unlike specious and spurious indicators, the LQS actually has a remarkably good track record of flagging investors when speculative shares are going to run higher. There is predictive value to the signal. The below chart shows the following:
- Blue Line: QQQs from the peak of the dot.com bubble to the trough
- Gray Shaded Areas: when the LQS flagged investors to press shorts in low-quality stocks
- White Areas: when the LQS warned short sellers to get out of the way
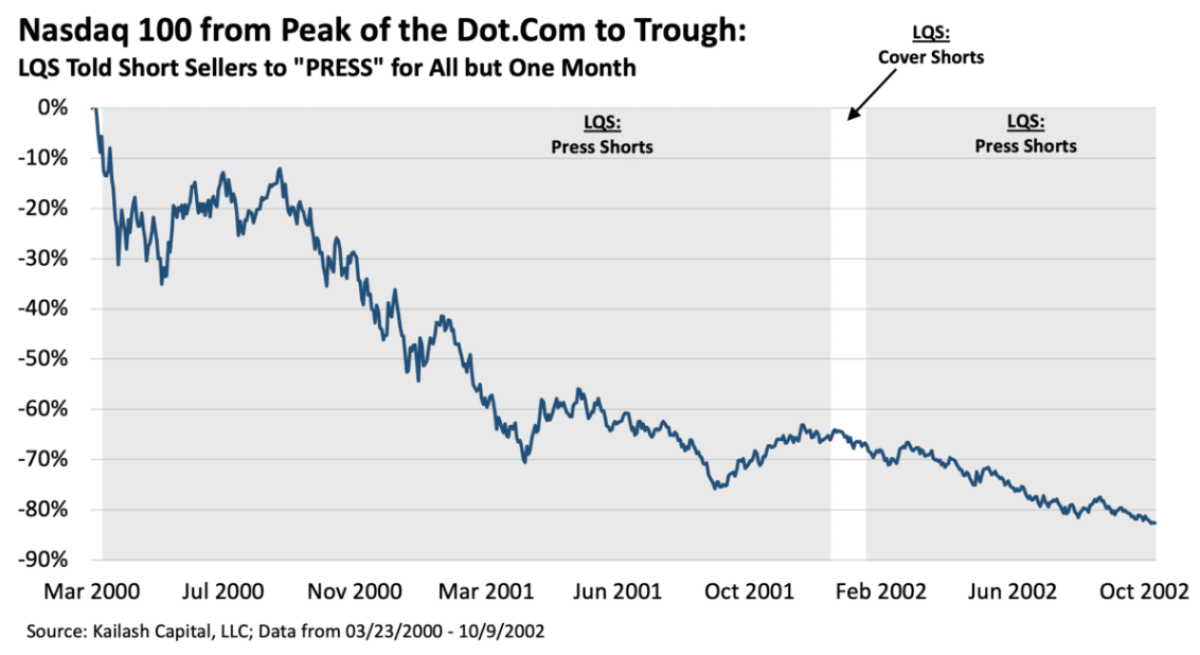
What do you see? The LQS was telling short sellers to “press” their low-quality shorts for all but one month of the dot.com correction. And importantly, when it wanted you to get out of the way for one brief month, it was wrong. More on that in a minute.
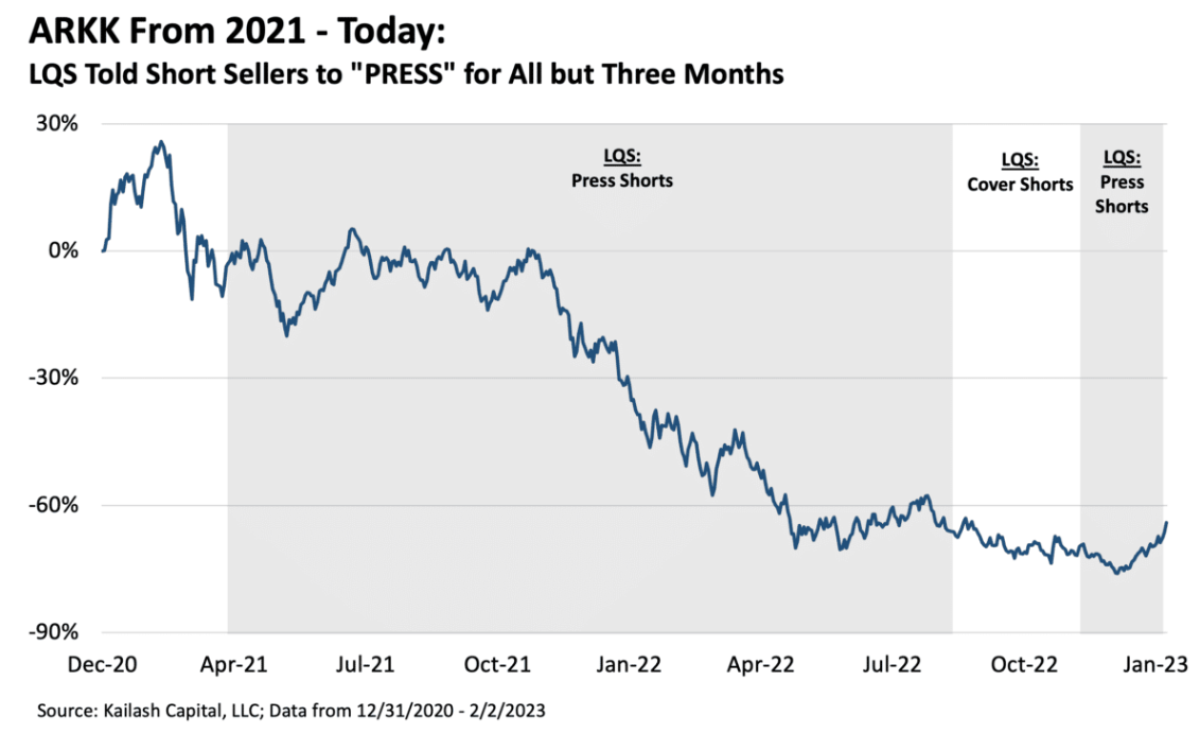
The chart below shows the exact same thing. Except we are now looking at ARKK from its peak through today. Once again:
In white areas with no shading, the model is telling short sellers to be careful and reduce exposure to low quality. Once again, the areas in gray are when the model is suggesting short sellers press.
And once again, we see that when the flag tripped to “cover” or reduce short exposure to low-quality stocks in August of 2022….it was wrong. We are writing this paper on February 7th, and the signal is now, again, suggesting short sellers reduce risk to low-quality speculative stocks.
KCR has never seen anything as effective as this model in terms of risk timing, but it is far from perfect. Yet its proximity to “market timing” – a profanity to us – made it a “model non-grata” here at KCR. It took a decade of watching it in the real world to even write it up. To read about its efficacy, please click here.
We readily admit that, post our write-up of the model in 2019, we now use it as a “soft” input when deciding our nets and factor exposure on our shorts. With that said, the model’s long-term back-tested and 12-year out-of-sample real-world success does not mean we follow it blindly. More importantly, we do not let it corrupt our larger discipline, instead using it only for “tuning” purposes. Here’s why:
US markets are currently dealing with the earliest phases of the fall-out from the most grotesque speculative orgy in American history. Over the last three years, we have explained the myriad headwinds faced by loss-making speculative shares trading at unforgiving valuations ad nauseam.
Financial history suggests this misallocation of capital will be forced to end. Speculative novelty stocks that once gorged on cheap capital will go begging. In contrast, makers of critical goods that were starved of funds will generate abnormal returns, in our view.
Like everything in finance, there is nothing new in that concept. Bull markets and their consequences have been documented back to 14th century Venice.
The exhibit below shows the fundamentals of:
- First Row: Nasdaq 100 at the peak of the dot.com mania
- Second Row: Nasdaq 100 at the dead trough of the crash in 2002
- Third Row: the fundamentals of ARKK’s holdings today
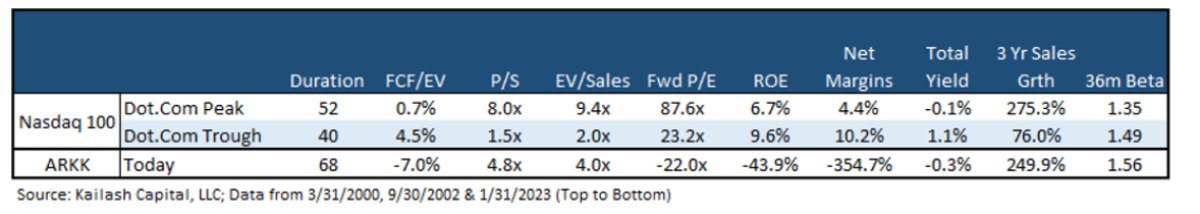
What is striking to us is how NOT like the trough of the dot.com ARKK’s holdings are. By October 2002, the Nasdaq 100 sported a 4.5% FCF yield, traded at 1.5x sales and 23x forward earnings on 10% net profit margins. Look at ARKK today. Folks brighter than us may be able to make money trading in and out of such things, but we will put those holdings in the “far too difficult” bucket.
In 2020 KCR produced over 90 pieces of research documenting the egregious speculation urged on by shills of all stripes. Our team is acutely aware that while these speculative periods are difficult for prudent-minded folks like us, these manias are inevitable and unavoidable. The good news is that such periods of capital misallocation create incredible opportunities for evidence-based investors.
Context & Conclusions:
Investors today are trying to predict the Fed’s every next move and studying the “macro-maps.” Often little more than specious “lines that look similar with no proven predictive value,” – we wish users of these tea leaves well. Some will be lucky and lauded as the next great investors, and others will be quietly washed out. In our view, betting on these short-term moves is simply speculation.
For context, we offer you the following data point that seems, to us, nothing short of remarkable:
In 2013, our Large Cap and Small & Mid Cap ranking models were throwing up a lot of companies growing earnings at high rates. They were cheap with powerful fundamentals. Our readers were so bearish in 2013 that they wanted NOTHING to do with our models’ top picks.
Crowding into low-beta and other novel “safety” strategies, we were asked to create simple defensive models. We remind you that in 2013, the US stock market was 40% cheaper than it is now, and total debt of non-financial companies was significantly lower than today.[1]
We obliged with our 2013 piece, The Defense Dilemma. That piece did the following three things:
- Explained the anxieties that had caused investors to abandon some of the cheapest shares seen since the mid-1990s
- Expanded on our prior piece shelling low volatility strategies as an overpriced bubble
- Explained a collection of factors that, when put together, built portfolios of reliably defensive stocks
KCR believes it is worth pausing and thinking about that. There can be tremendous information value in crowds.
In 2013 when stocks carried much lower leverage and were far cheaper than they are today, people complained about our Small Cap Core and Large Cap Core Model Portfolios. Featuring stocks trading at high single and low double digit P/E ratios with robust balance sheets and rapidly growing earnings, the complaint was that they were “too risky.”
Despite the howling headwinds to loss-making, high growth, and other high-priced mega-cap stocks today, we have had precisely zero queries for defensive products. Valuations have fallen to levels just slightly below the peak of the dot.com bubble, and everyone is trying to time the next entry to speculative shares. We are not market-timers here, but we are natural contrarians.
For other like-minded individuals, maybe it is time to revisit defensive stocks just in case the crowd of pivot-prophet Fed chasers is wrong.
Below we provide the fundamentals of our Small & Mid Cap defensive portfolio compared to the Russell 2500.
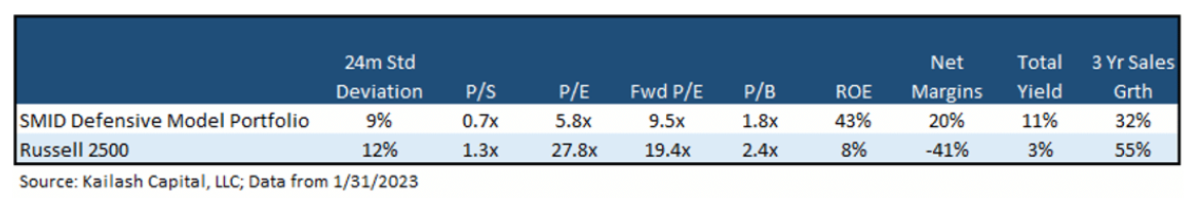
What you see in the table above is that our defensive SMID portfolio trades at an incredible discount to the index despite vastly better fundamentals.
Please see the exhibit below for KCR’s Defensive Model portfolio weights.
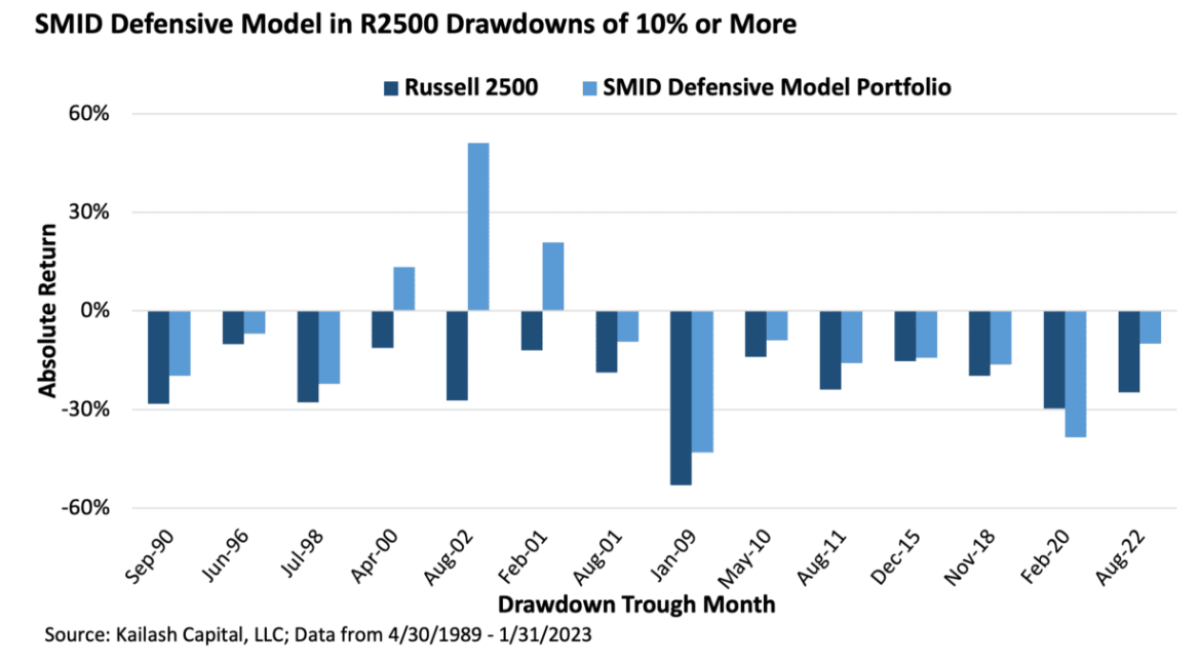
Appendix Note: We can hear some of you looking at these names and saying, “that is not defensive.” We show in the Appendix below that in 8 out of 9 periods where the market corrects by 10% or more, this model portfolio has offered robust downside protection.
Considering that our recent work has been pounding the table for high-quality small cap investing strategies, we have only included our SMID defensive portfolio. For those interested in our Large Cap model portfolio, please email info@kailashconcepts.com directly.
Appendix:
About the Authors:
Dr. Sanjeev Bhojraj
Co-founder of Kailash Capital
Sanjeev is a co-founder of Kailash Capital. He is also a portfolio manager and co-founder of L2 Asset Management. Dr. Bhojraj is widely published in the top journals in finance and accounting and specializes in behavioral finance. Dr. Bhojraj is also a Chaired Professor in Asset Management and the co-Director of the Parker Center for Investment Research at Cornell University’s Business School. Dr. Bhojraj has a Ph.D, ACA, ACMA and B.Com.
John Durkin
Operations Officer
John is former head of Operations for Equity Research at Baird Kailash and Knight Capital Group. John is a graduate of Stonehill College and has passed his CFA Level I.
Matt Malgari
Co-founder of Kailash Capital
Matt is a co-founder of Kailash Capital. He is also a portfolio manager, Managing Member, and co-founder of L2 Asset Management. Matt spent 14 years at Fidelity working as an Assistant Portfolio Manager on the Diversified International Fund, sector analyst, diversified analyst and trader. In 2010 Matt became the Managing Director of Equity Research for Knight Capital Group. Matt received his MBA from Cornell University and BA from Middlebury College and has used a quantamental approach to stock selection since the 1990s.
Nathan Przybylo
Quantitative Programming
A former associate at Beghou Consulting, Nathan received his MBA from Cornell University. He received a BS in Applied Mathematics from Northwestern University.
Kailash Concepts, LLC is the exclusive distributor of data analytics and research developed by Kailash Capital LLC, an unaffiliated registered investment advisor in Massachusetts.
Disclaimer
The information, data, analyses, and opinions presented herein (a) do not constitute investment advice, (b) are provided solely for informational purposes and therefore are not, individually or collectively, an offer to buy or sell a security, (c) are not warranted to be correct, complete or accurate, and (d) are subject to change without notice. Kailash Capital, LLC and its affiliates (collectively, “Kailash Capital”) shall not be responsible for any trading decisions, damages or other losses resulting from, or related to, the information, data, analyses or opinions or their use. The information herein may not be reproduced or retransmitted in any manner without the prior written consent of Kailash Capital. In preparing the information, data, analyses, and opinions presented herein, Kailash Capital has obtained data, statistics, and information from sources it believes to be reliable. Kailash Capital, however, does not perform an audit or seeks independent verification of any of the data, statistics, and information it receives. Kailash Capital and its affiliates do not provide tax, legal, or accounting advice. This material has been prepared for informational purposes only and is not intended to provide, and should not be relied on for tax, legal, or accounting advice. You should consult your tax, legal, and accounting advisors before engaging in any transaction. © 2021 Kailash Capital, LLC – All rights reserved.
Nothing herein shall limit or restrict the right of affiliates of Kailash Capital, LLC to perform investment management or advisory services for any other persons or entities. Furthermore, nothing herein shall limit or restrict affiliates of Kailash Capital, LLC from buying, selling or trading securities or other investments for their own accounts or for the accounts of their clients. Affiliates of Kailash Capital, LLC may at any time have, acquire, increase, decrease or dispose of the securities or other investments referenced in this publication. Kailash Capital, LLC shall have no obligation to recommend securities or investments in this publication as result of its affiliates’ investment activities for their own accounts or for the accounts of their clients.