


By Alex Botte, CFA, CAIA, Head of Client and Portfolio Solutions at Runa Digital Assets, an investment firm specializing in digital asset portfolios.
Summary and Key Findings
- Using Runa’s proprietary sector framework, we explore the idea of adding sector factors to a digital asset-specific risk model
- All of the sectors exhibited higher excess of market correlations than the average correlation across our universe of digital assets
- Some smart contract platforms in the Protocols sector exhibited stronger relationships with the sectors of the decentralized applications built on top of them. An example is Flow, a gaming and NFT-focused blockchain, which had more sensitivity to the Gaming/Metaverse sector than the Protocols sector.
- This phenomenon highlights the importance of a returns-based risk model, which is able to identify cross-sector relationships that a holdings-based model might miss if it simply assigned a sector to each asset
2022 was a tumultuous year for digital assets. Bitcoin and Ethereum ended the year -65% and -68%, respectively, after reaching all-time highs in November 2021. These are the largest digital assets by market cap, the most mature, and among the least volatile. More risky digital assets declined by over 90%. And this just covers liquid tokens - several decentralized blockchain projects, as well as centralized crypto lenders, exchanges, and asset managers, failed in 2022. This highlights the unsexy, yet critical need for a better understanding of risks in this nascent asset class.
Last year we posted two articles outlining a framework for building a digital asset-specific risk factor model. The first made the case for crypto market beta forming the core of the risk model. The second analyzed the relationships between digital assets and traditional assets. In this piece, we seek to expand on this framework by analyzing sector factors.
According to CoinMarketCap, there are 9,128 liquid tokens as of late 2022. That’s a very large universe. In equity markets, MSCI and S&P Dow Jones Indices developed the Global Industry Classification Standard (GICS), which seeks to offer an efficient investment tool to capture the breadth, depth, and evolution of sectors in equity markets.[i] When we started Runa in 2021, there were no agreed-upon sectors in digital asset markets - there was no GICS equivalent.
This has started to change with players like CoinDesk, Wilshire, and Coin Metrics developing what may become industry standard sector classification systems for digital assets. In the meantime, we developed our own proprietary sector framework. These are equivalent to equity sectors like Energy, Utilities, Consumer Discretionary, etc.
It is a common misconception that every liquid token is a “cryptocurrency” - a competitor of Bitcoin. While that might have once been the case, the space has since expanded to include much more than digital forms of money like Bitcoin. We have identified five sectors that we invest across. Here’s a brief description of each:
- Currencies: Assets where the main purpose is to create a digital form of money to transact peer-to-peer without a trusted third party.
- Protocols: Assets that are native to “smart contract” enabled blockchains.
- Decentralized Finance (DeFi): Assets of various applications built on smart contract platforms to perform peer-to-peer financial transactions without a trusted centralized party.
- Utilities: Assets used in the service and infrastructure networks that are building the middleware layer of blockchain economies.
- Gaming/Metaverse: Assets of various applications built on smart contract platforms that are disrupting the entertainment sector, including gaming, metaverse, social networking, and fan-related applications.
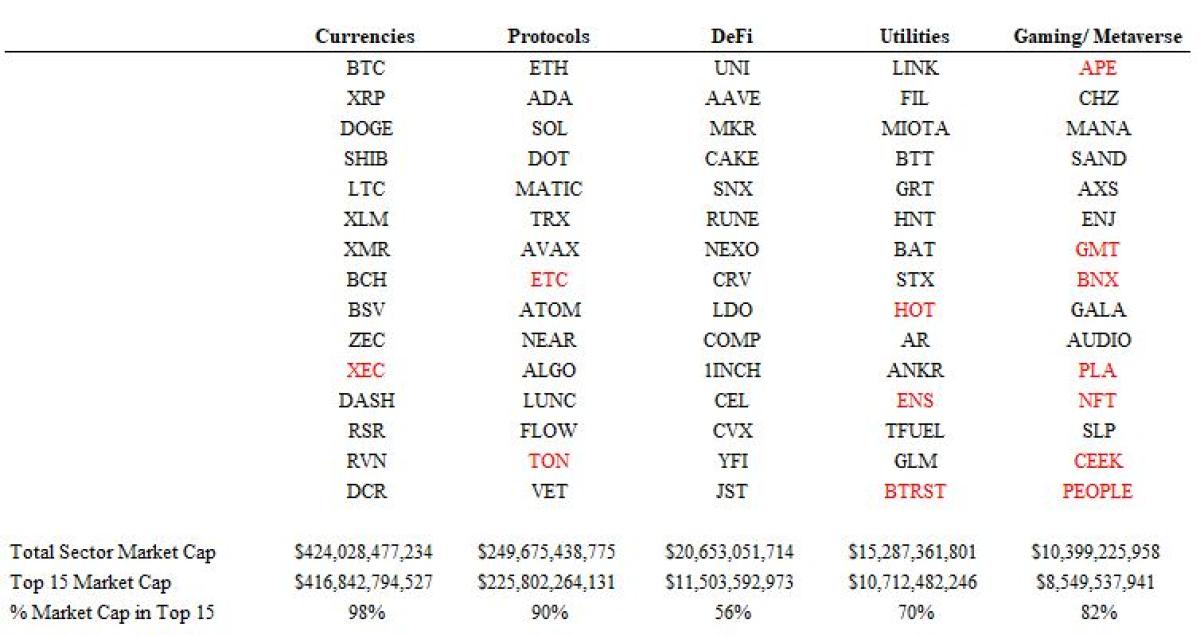
Using Runa’s proprietary sector framework, we categorize the top 250 assets by market cap into each of the five sectors. We chose the top 15 assets in each sector and made sure that those top 15 represented at least 50% of the sector’s overall market cap in the original top 250 universe. Some assets like XEC, HOT, and PLA were excluded from the analysis that follows because the assets were missing or had inconsistent price data from our pricing data source. We also decided to exclude assets like GMT, BNX, NFT, and APE because of their limited data history (we wanted at least one year).
Sector Total Return Correlations
The first analysis we’ll look at is the total return correlations of all the assets in our universe. We organize the assets by sector to understand if sector correlations are higher than the average correlation across the entire set of assets.
Total Return Correlations
Source: Messari. Period: June 1, 2021 - October 31, 2022 (limited by CVX). We chose the top 15 assets in each sector and excluded those with missing, inconsistent, or limited data. For more information on the methodology for selecting the assets included in this analysis, reference the “Sector Definitions” section. Dark red indicates higher correlations. Dark green indicates lower correlations.
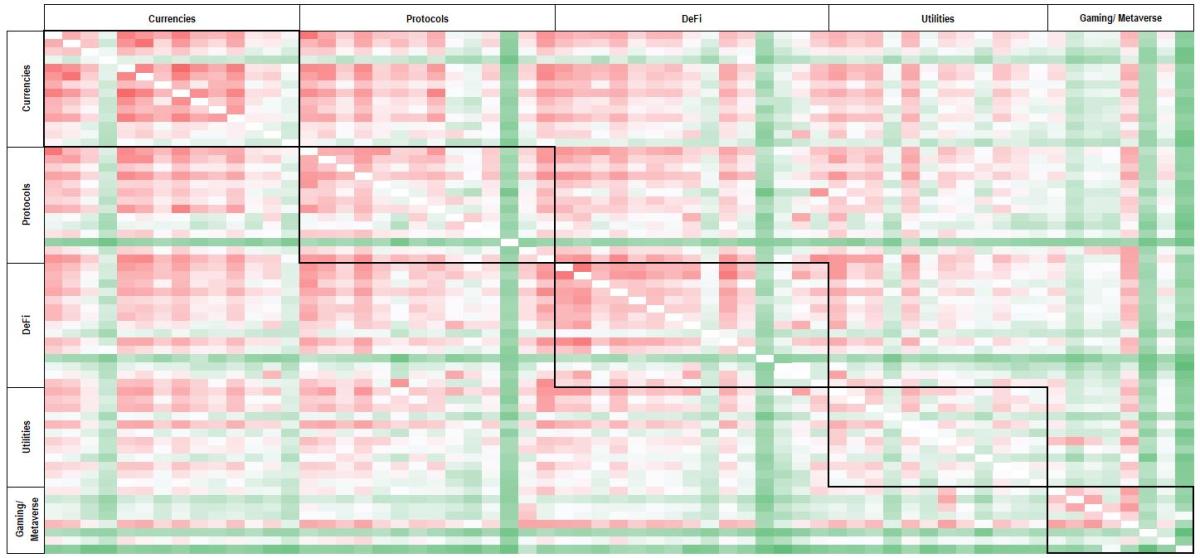
We observe that assets in the Currencies, DeFi, and Protocols sectors exhibited higher-than-average correlations compared to the average correlation across the entire universe.
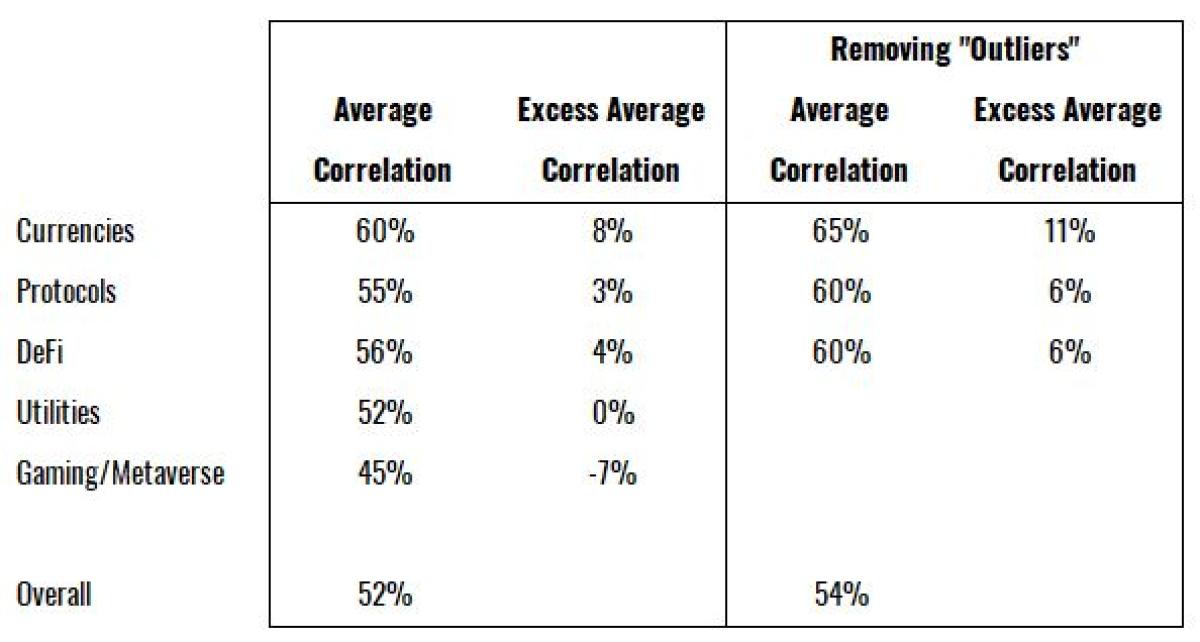
There are a few columns (SHIB, DOGE, LUNC, and CEL) in the Currencies, Protocols, and DeFi sectors that are notably green, indicating lower correlations. Shiba-Inu (SHIB) and Dogecoin (DOGE) are in the Currencies sector and are widely considered “meme” coins in that these assets originated from Internet memes. SHIB acts the most idiosyncratically of the assets in the Currencies sector. SHIB’s highest correlation is with DOGE. DOGE has been endorsed by Elon Musk, and the price of the coin can be heavily influenced by when Musk tweets about it.[i] Perhaps price movements in these coins could be explained by a virality or sentiment factor more so than risks that are unique to the Currencies sector. A virality or sentiment factor would fall into a long/short style premia factor grouping, and we will explore these types of factors in later research. If we exclude these two assets from the Currencies sector, we observe a higher average correlation in that sector of 65%. Terra Luna Classic (LUNC, in the Protocols sector) and Celsius (CEL, in the DeFi sector) went through idiosyncratic events in May and June 2022 respectively, and if we exclude them, average correlations across those sectors are even higher.
The Utilities sector average correlation is in line with the overall average. Finally, assets in the Gaming/Metaverse sector registered lower correlations than the average, with the exception of metaverse-related assets like Decentraland (MANA) and The Sandbox (SAND), which exhibited greater than 70% correlation.
Sector Excess Return Correlations
As we covered in our first post in this series, there is evidence of a shared risk in digital asset markets, something we referred to as “crypto beta.” We should remove this factor from the returns of all these assets to focus on their idiosyncratic price movements - that is, those movements that are not explained by general variations in the broad digital asset market. The correlation analysis below is the same as in the previous section except it removes the return of a market cap-weighted index from each asset to calculate the excess returns, which are then used to run the correlations.
Excess Return Correlations
Source: Messari. Period: June 1, 2021 - October 31, 2022 (limited by CVX). We chose the top 15 assets in each sector and excluded those with missing, inconsistent, or limited data. For more information on the methodology for selecting the assets included in this analysis, reference the “Sector Definitions” section. Dark red indicates higher correlations. Dark green indicates lower correlations.
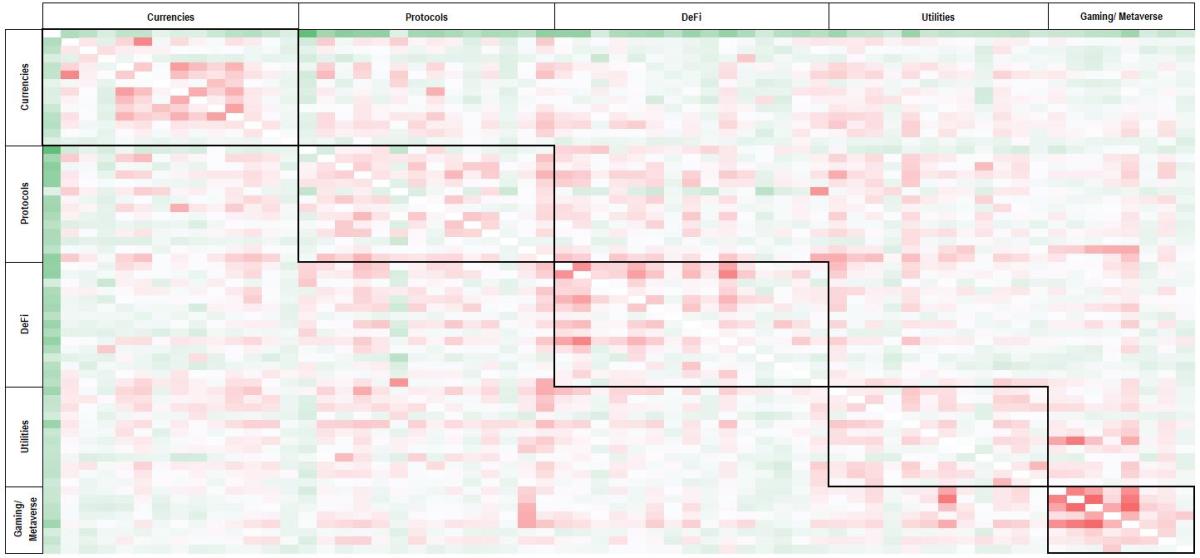
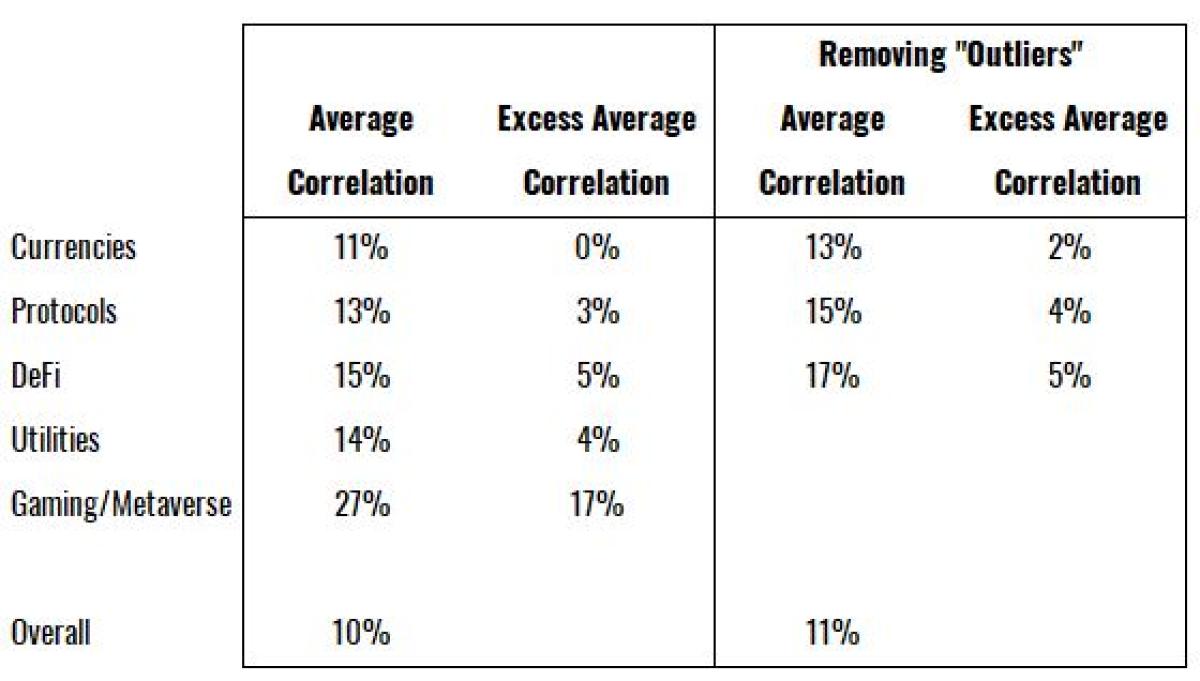
In this analysis, we find that all sectors exhibited excess of market return correlations higher than the average correlation across this universe. This is an encouraging result, one that supports the co-movement of assets within sectors, as the correlations suggest there are sector relationships that go above and beyond the positive relationships expected from these digital assets. The Gaming/Metaverse sector’s excess of market returns were the most correlated by a meaningful margin, followed distantly by DeFi.
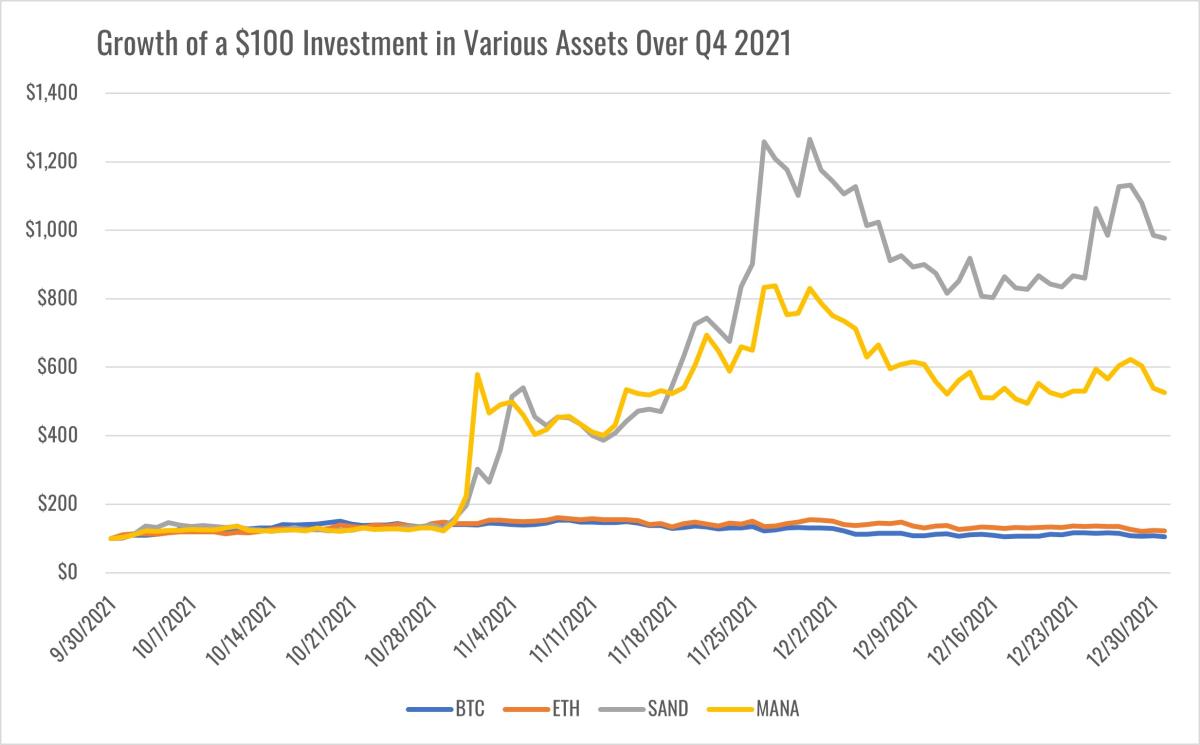
The most positive relationship in the entire table was between MANA and SAND at 66%. As mentioned in the previous section, these tokens represent decentralized, blockchain-based virtual worlds where users can create, experience, and monetize content and applications. We can observe from the case study below that when Facebook changed its name to Meta in Q4 2021, both assets soared, breaking away from BTC and ETH and instead reacting to the news that impacts their specific sector.
Returns of Select Digital Assets Around Facebook’s Announcement of Its Name Change to Meta
Source: Messari. Period: September 30, 2021 - December 31, 2021.
Another interesting result worth calling out is the relationship between decentralized apps (dapps) and the smart contract platforms that they are built on. You can see this in the relationships between certain assets in the DeFi and Protocols sectors, which themselves exhibited 12% correlation on average, higher than the 10% average across this sample. As an example, according to DappRadar as of this writing, the largest dapp on Ethereum by number of unique active wallets is Uniswap. The correlation between ETH and UNI (Uniswap’s governance token) is 25%.
Another example is Flow, a smart contract platform that is focused specifically on the Gaming/Metaverse sector. Its top app is NBA Top Shots, a first-of-its-kind collectible game that allows people to collect, trade, and sell their favorite NBA highlights as non-fungible tokens (NFTs).[i] Over this period, Flow exhibited an average excess return correlation of 25% to assets in the Gaming/Metaverse sector with some specific correlations like that with Axie Infinity, a blockchain-based game, higher than 40%. Flow’s average correlation with DeFi assets was only 11%, which is expected since that’s not a prevalent sector on the Flow blockchain.
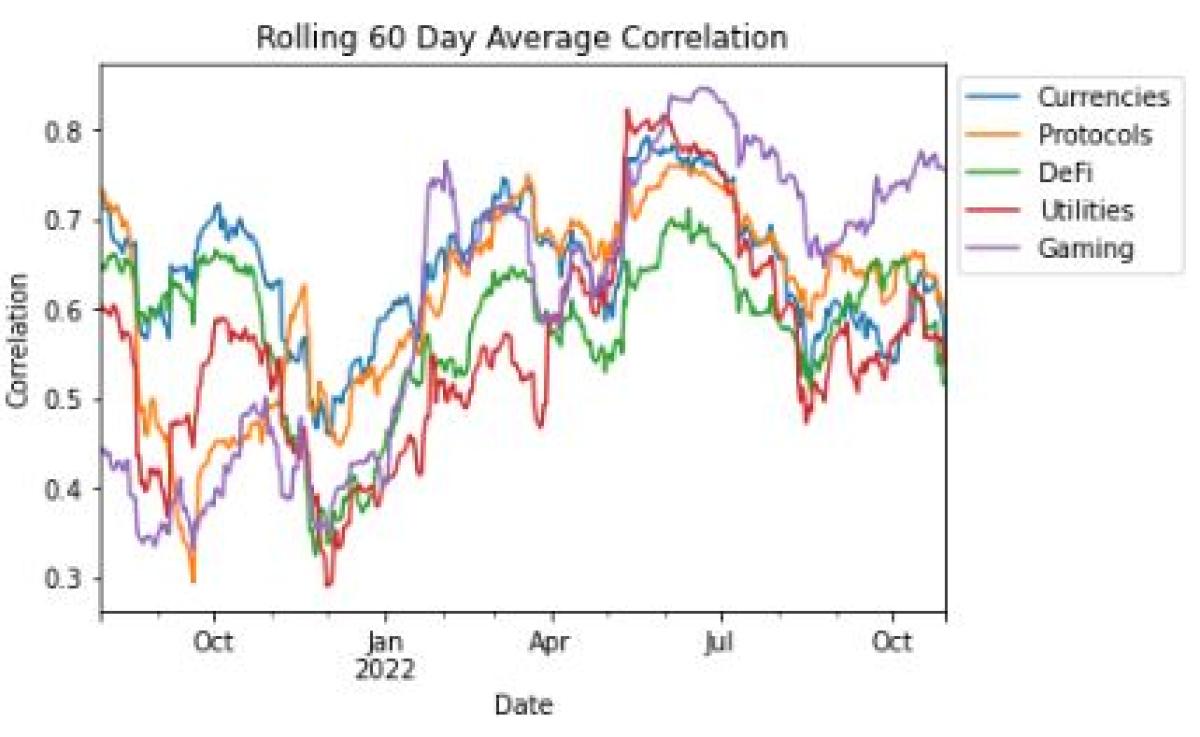
Next we’ll consider how these correlations have trended over the last year plus. We analyze both the total and excess of market correlations over the last 60 days, take the average correlation in each sector, and roll that forward one day at a time.
Trends in the Average Total Return Correlation by Sector
Source: Messari. Period: June 1, 2021 - October 31, 2022 (limited by CVX). We chose the top 15 assets in each sector and excluded those with missing, inconsistent, or limited data. For more information on the methodology for selecting the assets included in this analysis, reference the “Sector Definitions” section.
Trends in the Average Excess Return Correlation by Sector
Source: Messari. Period: June 1, 2021 - October 31, 2022 (limited by CVX). We chose the top 15 assets in each sector and excluded those with missing, inconsistent, or limited data. For more information on the methodology for selecting the assets included in this analysis, reference the “Sector Definitions” section.
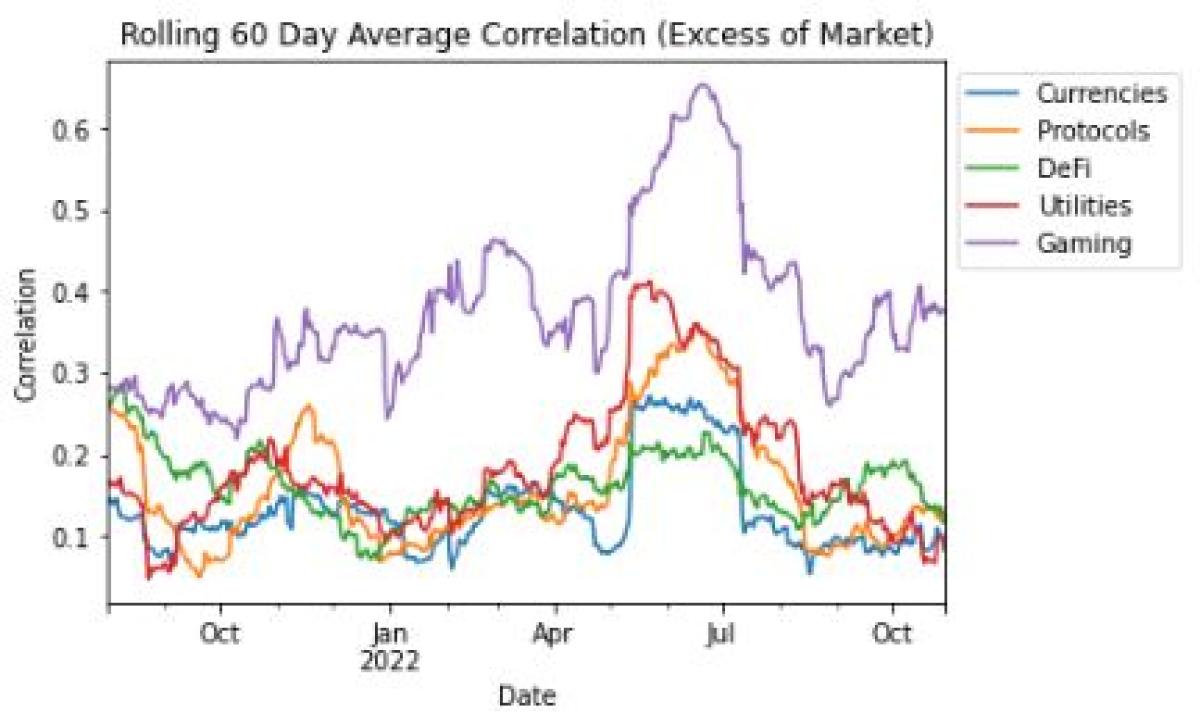
We observe that all total correlations have trended upwards over this period. Additionally, over all periods, excess of market correlations were positive. In other words, at every point in this period, the average correlation within each sector was positive, even after removing the crypto market returns from each asset.
Unsurprisingly, there was a notable increase in excess of market correlations during the stress events of Terra Luna, Three Arrows Capital, and Celsius collapses in May and June of 2022. Similar to traditional markets, correlations tend to rise in market stress events.
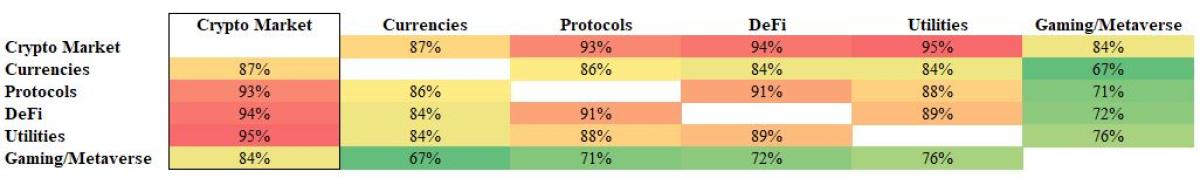
In order to build the sector factors, we will start by constructing market-cap-weighted, long-only sector portfolios that are made up of the assets in each sector as outlined in the Sector Definitions section. We expect these sector portfolios will have a substantial amount of overlap with the Crypto Market (or Crypto Beta) factor outlined in our prior piece since there is evidence of a shared risk across all digital assets. In the table below, we add a Crypto Market factor that is made up of all the assets outlined in the Sector Definitions section. As expected, correlations are quite high across the board and especially between the sector portfolios and the Crypto Market factor.
Correlations Between the Crypto Market Factor and Long Only Sector Portfolios
Source: Messari. Period: June 2, 2021 - October 31, 2022 (limited by CVX). We chose the top 15 assets in each sector and excluded those with missing, inconsistent, or limited data. For more information on the methodology for selecting the assets included in this analysis, reference the “Sector Definitions” section. Dark red indicates higher correlations. Dark green indicates lower correlations.
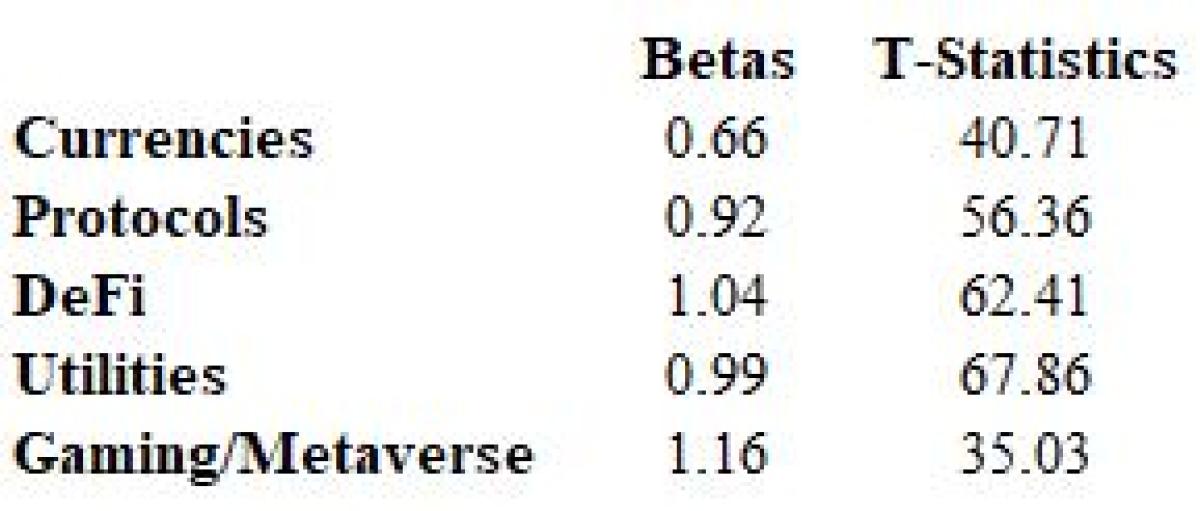
In order to remove the overlapping risk between the sector portfolios and the Crypto Market factor, we will subtract beta-adjusted Crypto Market returns from each sector portfolio. The below table shows the OLS regression results of each sector portfolio on the Crypto Market factor. All betas were statistically significant, unsurprisingly.
Regression Results of Long-Only Sector Portfolios on the Crypto Market Factor
Source: Messari. Period: June 2, 2021 - October 31, 2022 (limited by CVX). We chose the top 15 assets in each sector and excluded those with missing, inconsistent, or limited data. For more information on the methodology for selecting the assets included in this analysis, reference the “Sector Definitions” section.
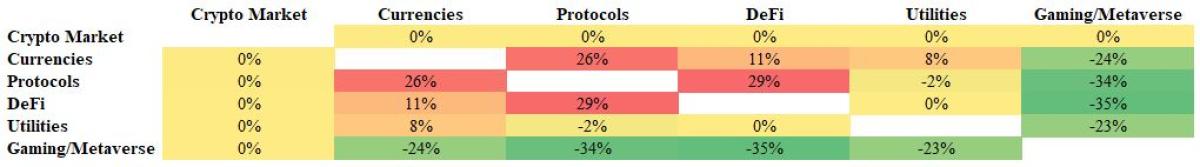
Now that the sector portfolios have been residualized against the Crypto Market factor, we will update the correlations. Now the correlations of the beta-adjusted sector factors are 0% with the Crypto Market factor, which is of course by design. The rest of the correlations are below 50-60% on an absolute basis, which is about the threshold we want to see so we don’t introduce collinearity in the final risk model. The highest positive correlation of 26% between Protocols and DeFi is acceptable and unsurprising based on what we saw earlier in the Sector Excess Return Correlations section. Finally, the Gaming/Metaverse sector is the most diversifying. DeFi and Gaming/Metaverse exhibited the largest negative correlation of -35%, which is also acceptable.
Correlations Between the Crypto Market Factor and Market Beta-Adjusted Long Only Sector Portfolios
Source: Messari. Period: June 2, 2021 - October 31, 2022 (limited by CVX). We chose the top 15 assets in each sector and excluded those with missing, inconsistent, or limited data. For more information on the methodology for selecting the assets included in this analysis, reference the “Sector Definitions” section. Dark red indicates higher correlations. Dark green indicates lower correlations.
Asset Tests
The next two sections are dedicated to testing the quality of the new six-factor model. We will run the first set of tests on each asset in our universe. The assets will serve as the dependent variable and the six factors (Crypto Market plus the five residualized sector factors) will serve as the independent variables. We are trying to understand if the majority of assets have strong, statistically significant exposure to their respective sector factor. To make the results more reliable, we remove each asset from the construction of its sector factor. For example, when testing Bitcoin’s exposure to the Currencies sector factor, we first remove Bitcoin’s representation in the Currencies sector factor and instead have the other currency assets make up the full Currencies sector factor. If we didn’t do this, the results below would be overstated.
The exhibit below has two tables. The first analyzes the percent of assets in each sector that have statistically significant positive exposure (t-statistics with a value of greater than 2) to their respective sector factor. The second looks at the percent of assets in each sector whose most statistically significant positive exposure (as measured by t-statistics) was to their sector factor.
Summary Regression Results of Assets on the Six-Factor Model
Source: Messari. Period: June 2, 2021 - October 31, 2022 (limited by CVX). We chose the top 15 assets in each sector and excluded those with missing, inconsistent, or limited data. For more information on the methodology for selecting the assets included in this analysis, reference the “Sector Definitions” section. Due to data limitations at the time of analysis, LDO’s representation in the Crypto Market and DeFi sector factors began on September 16, 2021.
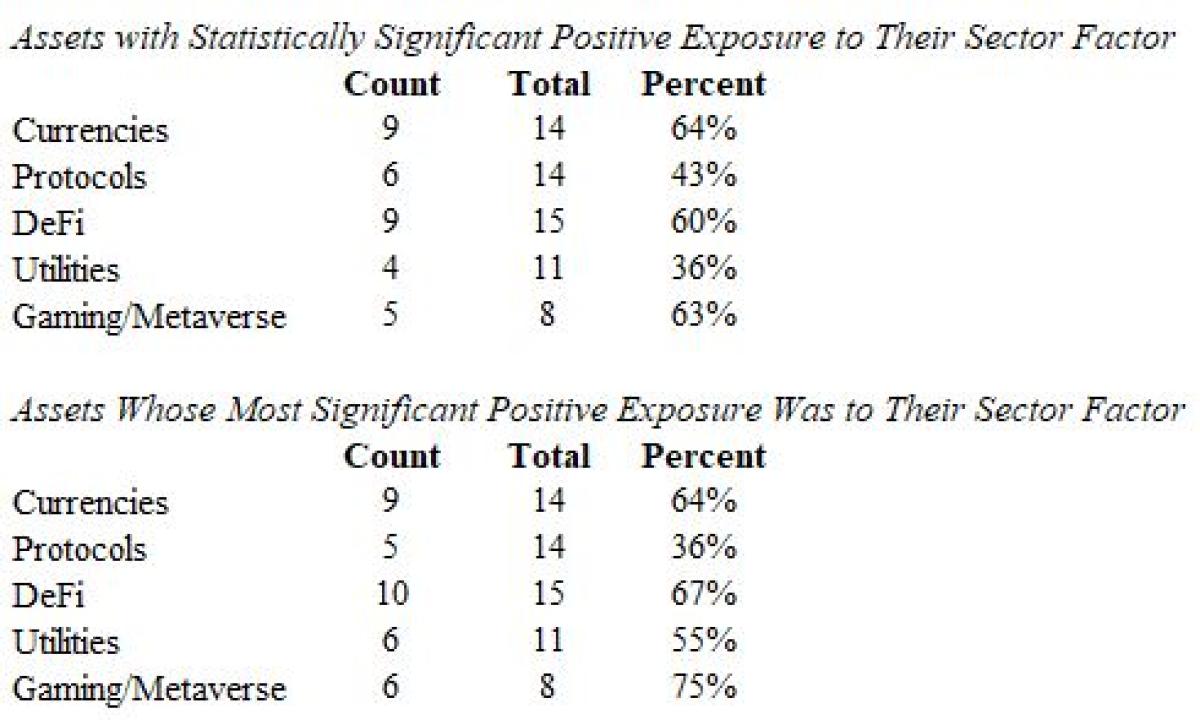
The results are encouraging for three of the five sectors (Currencies, DeFi, and Gaming/Metaverse), as a majority of the assets in those sectors not only demonstrated statistically significant positive exposure to their sector but also had the strongest relationship with their sector over other sectors.
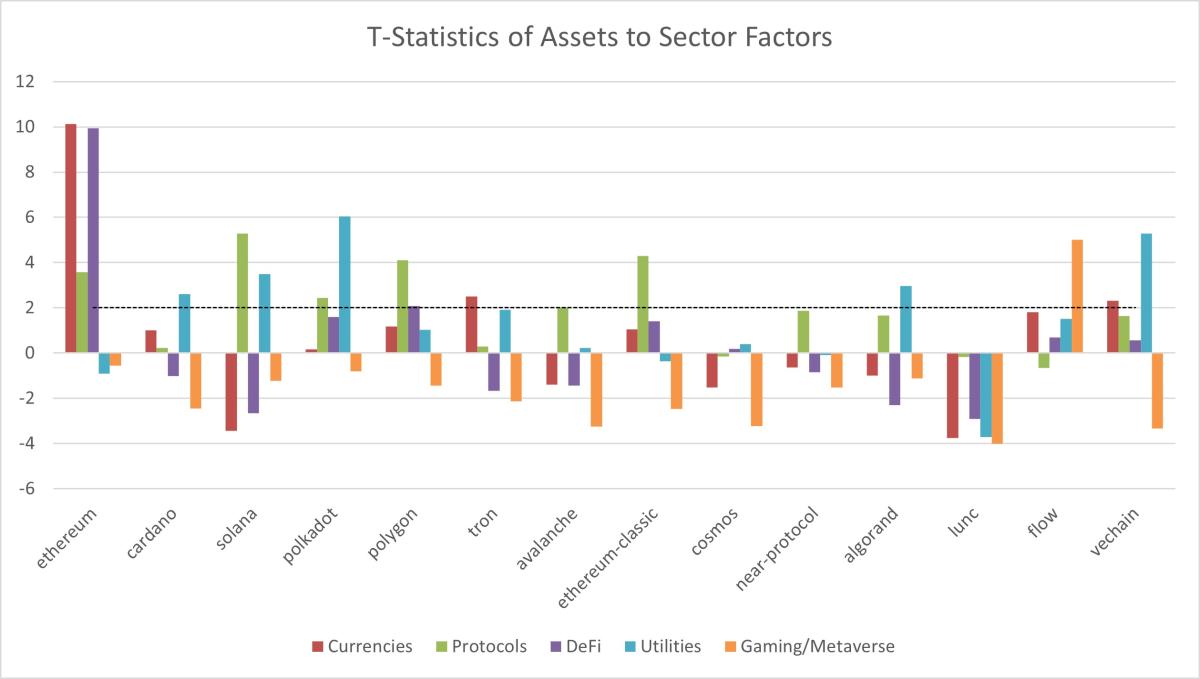
The sectors with the worst results in the tables above were Protocols and Utilities. As we can see in the exhibit below, most assets in the Protocols sector exhibited positive exposure to the Protocols sector factor, but only six were statistically significant. Some Protocol assets exhibited stronger relationships with other sectors. Two notable examples of this were Polkadot, which was more impacted by Utilities, and Flow, which was more impacted by Gaming/Metaverse. The latter makes sense given the points we made about Flow in the Sector Excess Return Correlations section. We believe this highlights the importance of factor models like this. Flow is a layer-1 blockchain, naturally falling into the Protocols sector. However, simply labeling it into a sector category would miss the fact that its risk and price movements are more impacted by the Gaming/Metaverse sector.
Another example of this is Ethereum. Ethereum has the largest DeFi ecosystem, as measured by TVL, of any blockchain by far. While Ethereum has statistically significant exposure to the Protocols sector, it also has statistically significant exposure to the DeFi sector. We believe understanding these relationships is critical, since if a major event impacting the DeFi sector were to occur (e.g., regulation), that would be expected to not only materially impact the price of DeFi applications but also Ethereum.
Regression Results of Assets in the Protocols Sector to the Five Sector Factors in the Six-Factor Model
Source: Messari. Period: June 2, 2021 - October 31, 2022 (limited by CVX). We chose the top 15 assets in each sector and excluded those with missing, inconsistent, or limited data. For more information on the methodology for selecting the assets included in this analysis, reference the “Sector Definitions” section. Due to data limitations at the time of analysis, LDO’s representation in the Crypto Market and DeFi sector factors began on September 16, 2021.
Portfolio Tests
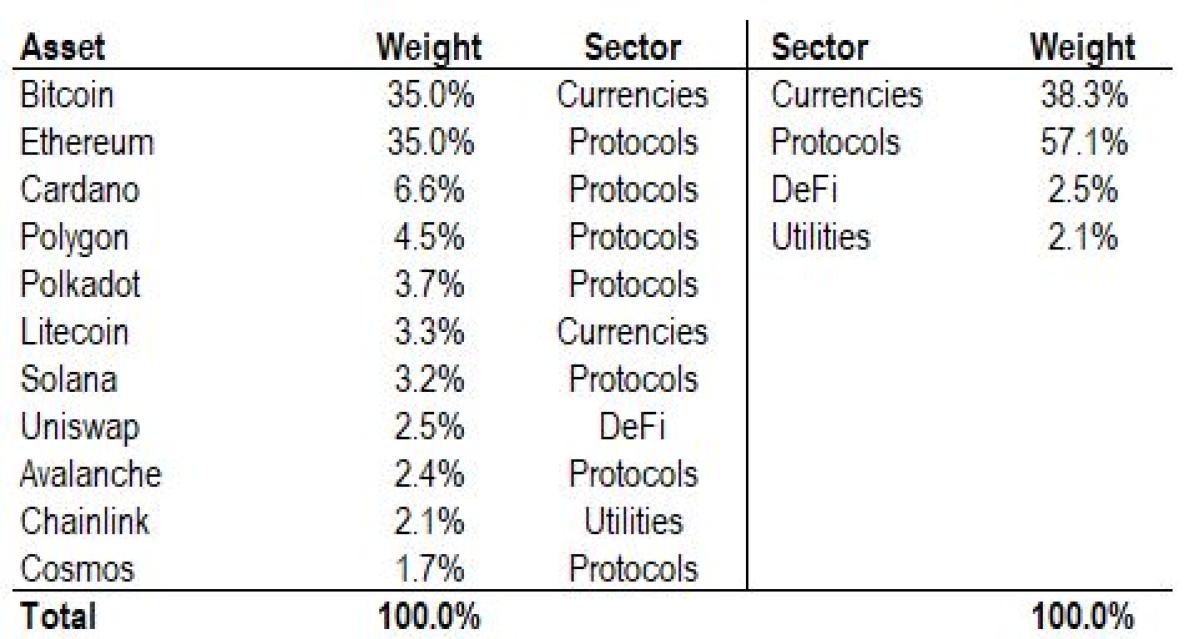
The purpose of building this risk factor model is for asset managers with liquid token portfolios to better understand and manage the risks in their portfolio. So let’s test this six-factor model on two liquid token portfolios. First, we’ll use one of the most widely used benchmarks in the liquid digital asset space, the Bloomberg Galaxy Crypto Index, to construct a pro-forma, daily rebalanced portfolio using the index’s weights as of December 2022.[i] This portfolio is allocated mostly across Protocols and Currencies, with small allocations to DeFi and Utilities. There is no Gaming/Metaverse exposure.
Bloomberg Galaxy Crypto Index Constituents by Asset and Sector
We regressed the returns of the portfolio on the six factors. We found that the model explained 99% of the risk in the portfolio, and the portfolio exhibited statistically significant positive relationships with all factors (t-statistics above an absolute value of 2) except for Gaming/Metaverse.
The portfolio had lower risk relative to the overall crypto market (the Crypto Market beta coefficient was less than 1). This is intuitive given the index’s large allocations to some of the least risky assets in the asset class, Bitcoin and Ethereum. Its 0.46 coefficient to the Currencies sector indicates that when Currencies outperformed (underperformed) the market on a risk-adjusted basis, the portfolio captured about 46% of that outperformance (underperformance) on average. The Protocols sector coefficient was 0.39, while the sensitivities to the DeFi and Utilities sectors were smaller. These results are unsurprising given the portfolio’s composition. However, if for some reason (think external manager evaluation) we didn’t have the holdings of the portfolio - we only had access to the portfolio’s returns - this analysis would provide valuable insight into the risk and return drivers of this portfolio over this period.
Multi-Factor Regression Results of Bloomberg Galaxy Crypto Portfolio on the Six-Factor Model
Sources: Messari and Bloomberg. Period: June 2, 2021 - October 31, 2022 (limited by CVX). We chose the top 15 assets in each sector and excluded those with missing, inconsistent, or limited data. For more information on the methodology for selecting the assets included in this analysis, reference the “Sector Definitions” section. Results in gray are not statistically significant.
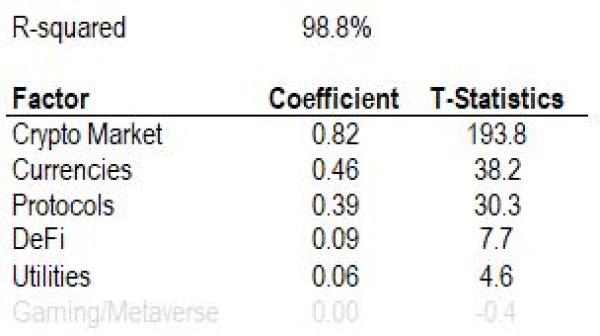
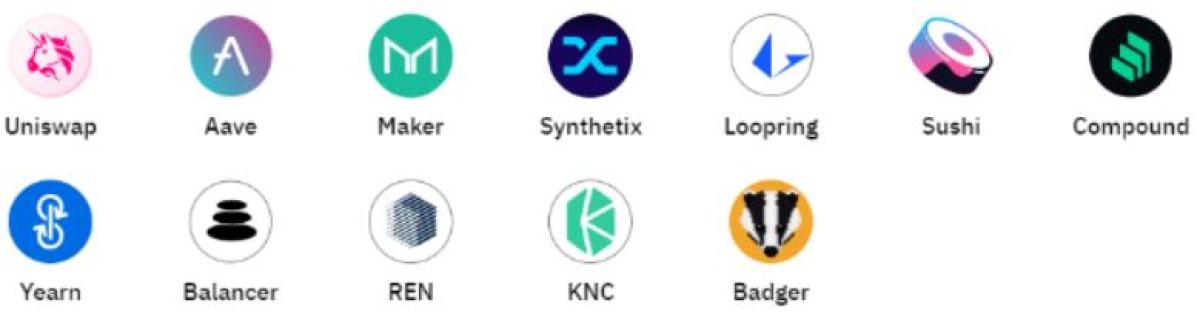
The second portfolio we will test is the DeFi Pulse Index, which is designed to track the performance of the DeFi industry. It is therefore made up of several DeFi-related tokens, but it also has had allocations to some assets that Runa would categorize as Protocols (e.g., Loopring). At the time of writing, here were the assets in the index. We do not know the composition of the portfolio historically; instead, we pulled historical returns of the index from Messari for this analysis.
Underlying Tokens in the DeFi Pulse Index as of December 2022[i]
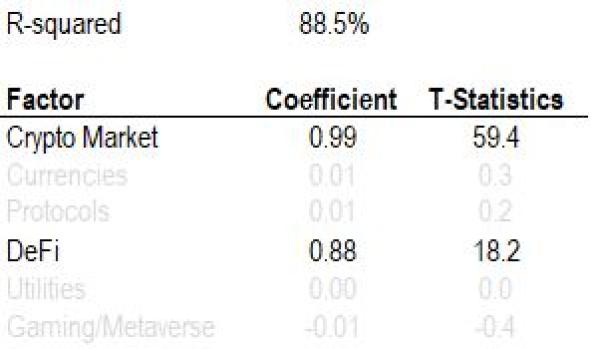
The model does a slightly worse job at explaining the risk of this second portfolio; however, the r-squared is still almost 90%. The portfolio only had statistically significant positive exposures to two factors - the Crypto Market and the DeFi sector. Despite having allocations to assets in other sectors beyond DeFi, the index’s risk and return is dominated by general crypto market and DeFi-specific movements. This could be an example of Protocols being more sensitive to the dapps built on top of them versus other smart contract platforms in the same sector.
Multi-Factor Regression Results of DeFi Pulse Index Portfolio on the Six-Factor Model
Sources: Messari and Bloomberg. Period: June 2, 2021 - October 31, 2022 (limited by CVX). We chose the top 15 assets in each sector and excluded those with missing, inconsistent, or limited data. For more information on the methodology for selecting the assets included in this analysis, reference the “Sector Definitions” section. Results in gray are not statistically significant.
Conclusion
Risk in liquid digital asset investing is high, and we at Runa seek to understand the risk drivers of this unique and emerging asset class. This piece of work expands on that line of research by organizing the digital asset market into sectors, similar to industry classification standards that exist in traditional asset classes. We construct a crypto-specific risk model with sector factors that can help portfolio managers and asset allocators better understand the risk and return drivers of liquid token portfolios. This model can measure a portfolio’s sensitivity to not only the broad crypto market, which of course may be partially impacted by exogenous macro factors as outlined in this piece, but crypto-specific factors that influence certain areas of the digital asset market. Measuring risk in a returns-based way has several benefits, including the ability to (i) analyze portfolios without needing to know the portfolio’s underlying token holdings and (ii) measure overlapping exposures that sector classifications and holdings-based analysis wouldn’t necessarily pick up on (like the Flow example). We aim to expand on this risk model over time, especially as the asset class matures and the industry coalesces around concepts like sectors and valuation frameworks.
Footnotes:
[1] Source: https://www.msci.com/our-solutions/indexes/gics
[3] Source: https://dappradar.com/flow/collectibles/nba-topshot
[4] Source: https://assets.bbhub.io/professional/sites/10/BGCI-Factsheet-Dec-22.pdf
[5] Source: https://indexcoop.com/defi-pulse-index-dpi
About the Author:
Alex Botte, CFA, CAIA is the Head of Client and Portfolio Solutions at Runa Digital Assets, an investment firm specializing in digital asset portfolios. In this role, Alex is responsible for the investment risk framework, chairs the Risk Committee, and contributes to content, portfolio analytics, research, and client engagement. Alex was previously a Vice President at Two Sigma, where she produced investment management-related content and helped with the development of the firm's factor-based risk analytics platform, Venn. Prior to Two Sigma, she was at AQR Capital Management, where she most recently served as a Product Specialist for the firm’s Global Asset Allocation strategies. Prior to AQR, she worked in Prime Services at Barclays. Alex holds a Bachelor’s of Science in Applied Economics and Management from Cornell University.
