


By Stephen L. Nesbitt – Chief Executive Officer, Chief Investment Officer of Cliffwater.
Industry data suggests that investor concern over an excess inflow of capital targeting private debt is unnecessary, and to the contrary shows that the growing supply of private debt capital over the past decade (the majority consisting of direct lending) has been consistent with the financing needs of a growing US buyout market. This finding is also consistent with the persistence of significant yield spreads in private direct middle market loans, the ultimate arbiter of supply and demand for financing.
The chart below provides three related metrics that put the growth of performing1 private debt in the context of a broader US private market ecosystem that has been growing at three times the rate of the public markets over the last 20 years.2 The three metrics are fundraising, dry powder, and total supply/demand3.
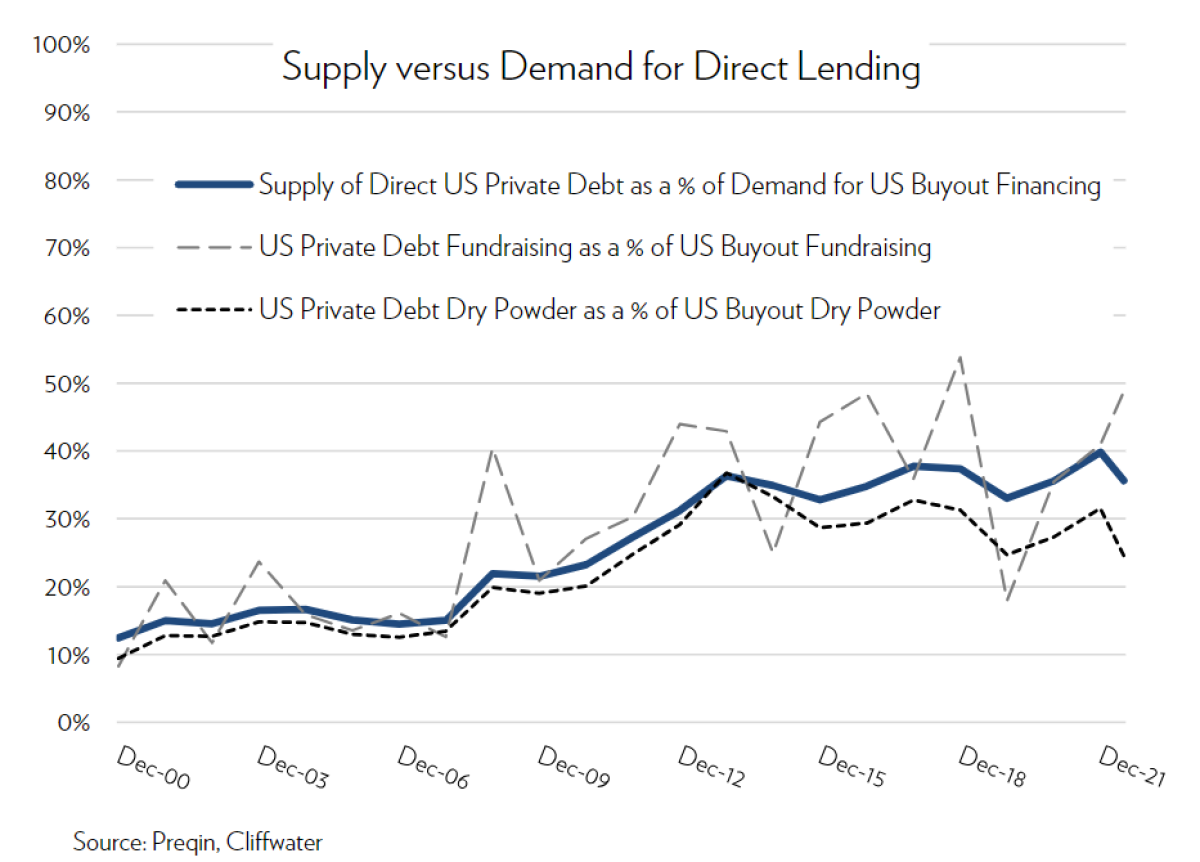
All three metrics express private debt as a percent of US buyouts, the segment of private equity that most utilizes private debt for financing. Since approximately 50% of US buyouts is debt financed, US private debt would equal approximately 100% of US buyout equity capital if it was the only source of financing. However, as the chart shows, US private debt, represented by the Preqin database consisting primarily of institutional private debt capital, represents approximately one-third of the financing needs of US buyout firms. Importantly, private direct debt doubled as a percent of US buyout equity needs after the 2008 Financial Crisis, as bank lending retreated, but has remained a consistent percentage over the last decade. If there was too much new institutional supply, which includes public and private BDCs, market penetration would be increasing, pushing out other suppliers of buyout financing like banks, insurance companies, non-bank finance companies, and hedge funds. Instead, the level market share for US private debt suggests that the “too much money” condition is not present.
Footnotes:
1 Performing private debt includes senior secured, second lien, unitranche loans to middle market companies together with special situation debt. Distressed debt, which is generally considered non-performing or in non-accrual status, is excluded.
2 Cliffwater calculations.
3 Supply of Direct US Private Debt equals recycled supply (estimated at 33% of AUM), plus 100% of dry powder. Demand for US Buyout Financing equals recycled demand (estimated at 17% of private equity AUM), plus 100% of dry powder. Other definitions yield similar results.
About the Author:
Steve Nesbitt is the Chief Executive Officer and Chief Investment Officer of Cliffwater, and is primarily responsible for the day-to-day management of Cliffwater Corporate Lending Fund (CCLFX) and the Cliffwater Enhanced Lending Fund (CELFX), an SEC registered credit interval fund focused on the US corporate middle market.

Steve is recognized for a broad range of investment research. His papers have appeared in the Financial Analysts Journal, The Journal of Portfolio Management, The Journal of Applied Corporate Finance, and The Journal of Alternative Investments. His private debt research led to the creation of the Cliffwater BDC Index, measuring historical BDC performance, and the Cliffwater Direct Lending Index, measuring historical performance for direct middle market loans. Steve authored the book, Private Debt: Opportunities in Corporate Direct Lending, Wiley Finance (2019) which provides the analytical and empirical underpinnings of the private debt market.
Stephen L. Nesbitt snesbitt@cliffwater.com
The views expressed herein are the views of Cliffwater LLC (“Cliffwater”) only through the date of this report and are subject to change based on market or other conditions. All information has been obtained from sources believed to be reliable, but its accuracy is not guaranteed. Cliffwater has not conducted an independent verification of the information. The information herein may include inaccuracies or typographical errors. Due to various factors, including the inherent possibility of human or mechanical error, the accuracy, completeness, timeliness and correct sequencing of such information and the results obtained from its use are not guaranteed by Cliffwater. No representation, warranty, or undertaking, express or implied, is given as to the accuracy or completeness of the information or opinions contained in this report. This report is not an advertisement, is being distributed for informational purposes only and should not be considered investment advice, nor shall it be construed as an offer or solicitation of an offer for the purchase or sale of any security. The information we provide does not take into account any investor’s particular investment objectives, strategies, tax status or investment horizon. Cliffwater shall not be responsible for investment decisions, damages, or other losses resulting from the use of the information. Past performance does not guarantee future performance. Future returns are not guaranteed, and a loss of principal may occur. Statements that are nonfactual in nature, including opinions, projections, and estimates, assume certain economic conditions and industry developments and constitute only current opinions that are subject to change without notice. Cliffwater is a service mark of Cliffwater LLC.