
By Nicolas Rabener, CAIA, CEO & Founder of Finomial.
SUMMARY
- Stocks can be ranked by their upside and downside betas to the S&P 500
- Results in strong sector biases and factor exposures
- Excess returns from upside stocks were negative, zero for downside stocks
INTRODUCTION
Most capital allocators use correlation to identify strategies that may add diversification benefits to their portfolios. However, average correlations are often misleading. For example, a market-neutral merger arbitrage strategy is uncorrelated to stocks in good times, but when stocks crash then mergers between companies fall apart. In this case, diversification benefits fail to materialize when most needed (read Merger Arbitrage: Arbitraged Away?).
A perhaps better metric for evaluating diversifying strategies is downside betas to the S&P 500, which represent the betas calculated by only using the negative returns of the stock market. If a strategy has a negative downside beta, then it would generate positive returns when stocks decline.
Although downside betas are most useful for reviewing asset classes or funds, the concept can also be used for stock selection, which we explore in this article.
DOWNSIDE VERSUS UPSIDE STOCKS
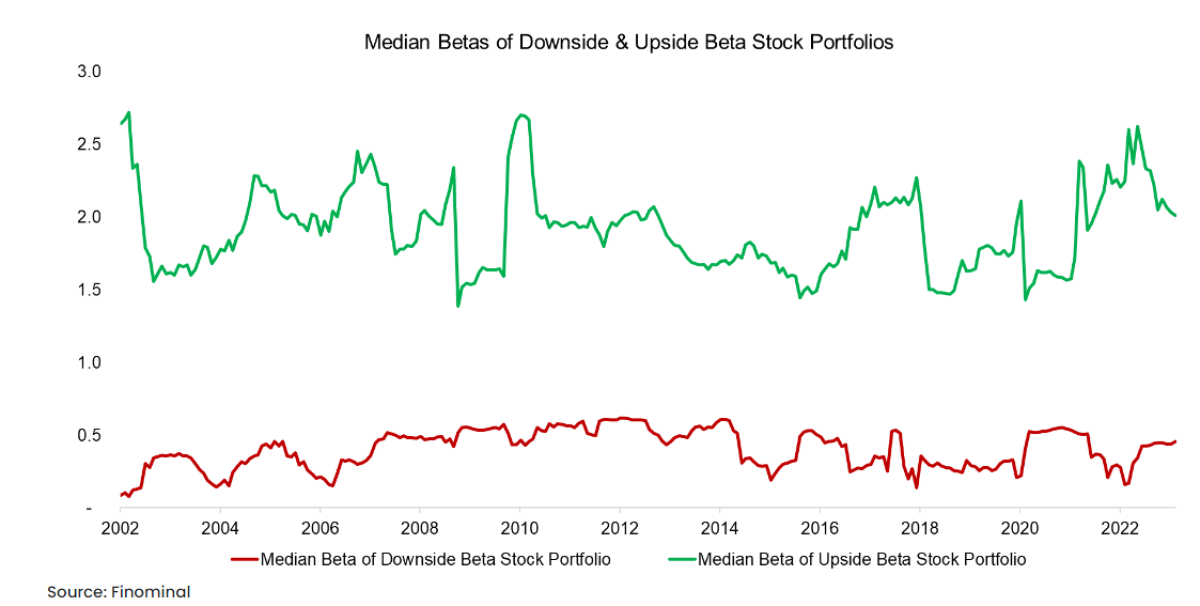
We consider our universe as all stocks traded in the US stock market with a market capitalization above $1 billion. We calculate the upside and downside betas for each stock for the trailing 12 months and create two portfolios by selecting the 10% of stocks with the highest upside and 10% of stocks with the lowest downside betas. These portfolios are rebalanced on a monthly basis and stocks are weighted equally.
We observe that the median beta of the upside beta portfolio was 1.9 in the period from 2002 to 2023, which can be compared to a leveraged position in the stock market. In contrast, the median beta of the downside beta portfolio was 0.4. It is interesting to observe that the downside beta was never negative during those 20 years, ie almost all stocks were positively correlated with the stock market. It seems that the diversification benefits from stocks are limited.
PERFORMANCE OF UPSIDE VERSUS DOWNSIDE STOCKS
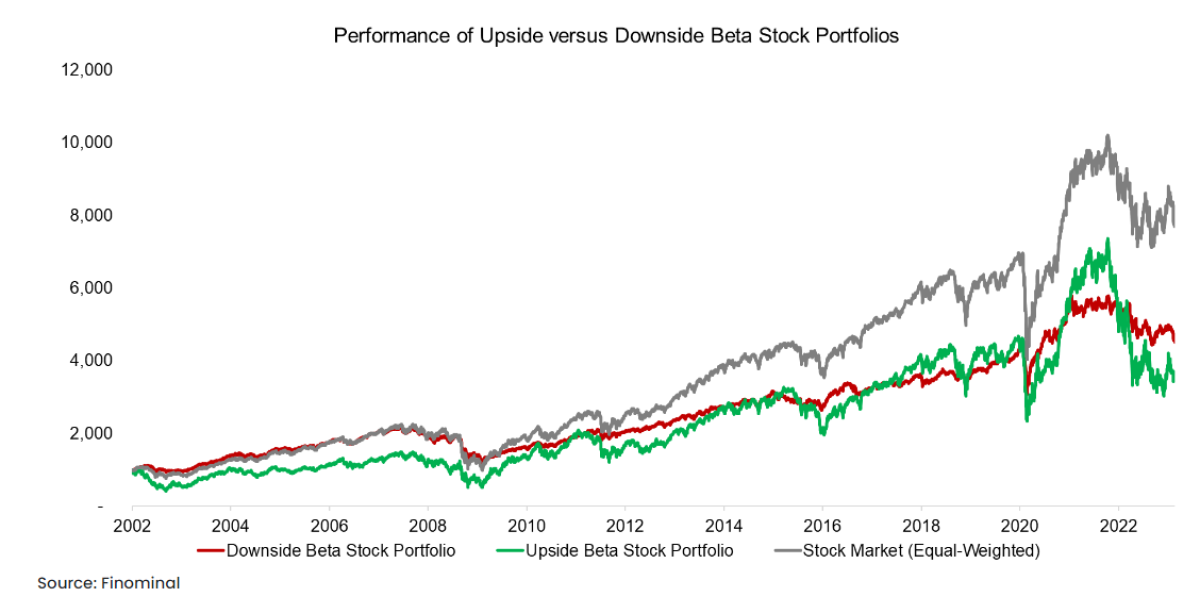
Next, we compare the performance of both portfolios to an equal-weighted index of the US stock market. We observe that both portfolios have underperformed the index over the last 20 years.
Specifically, downside stocks outperformed upside stocks during the tech bubble implosion between 2002 and 2004, whereas the performance thereafter was mixed. Most interesting is that downside stocks achieved approximately the same return as upside stocks, but with significantly lower volatility, which was 13.2% and 31.3% respectively.
BREAKDOWN BY SECTORS
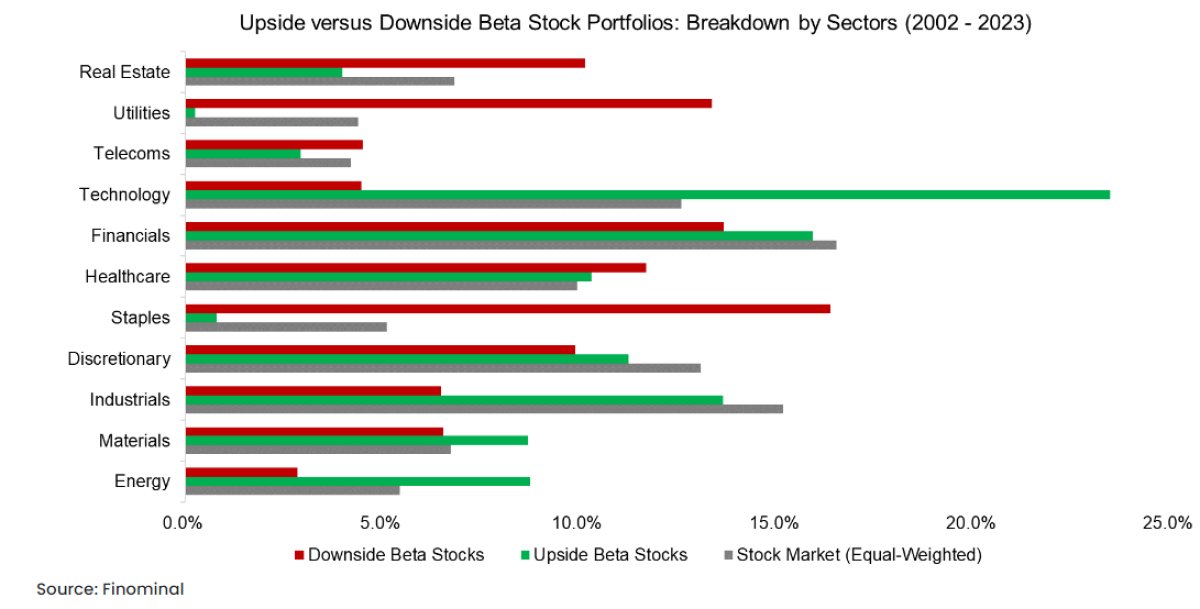
Analyzing the breakdown by sectors between 2002 and 2023 highlights significant differences between these portfolios. The portfolio comprised of downside beta stocks has overweights in real estate, utilities, and staples. In contrast, upside stocks are primarily from the tech and energy sectors.
These sectoral bets are intuitive and somewhat expected, e.g. there real estate and utility companies offer a lower exposure to the economic cycle than energy stocks.
FACTOR EXPOSURE ANALYSIS
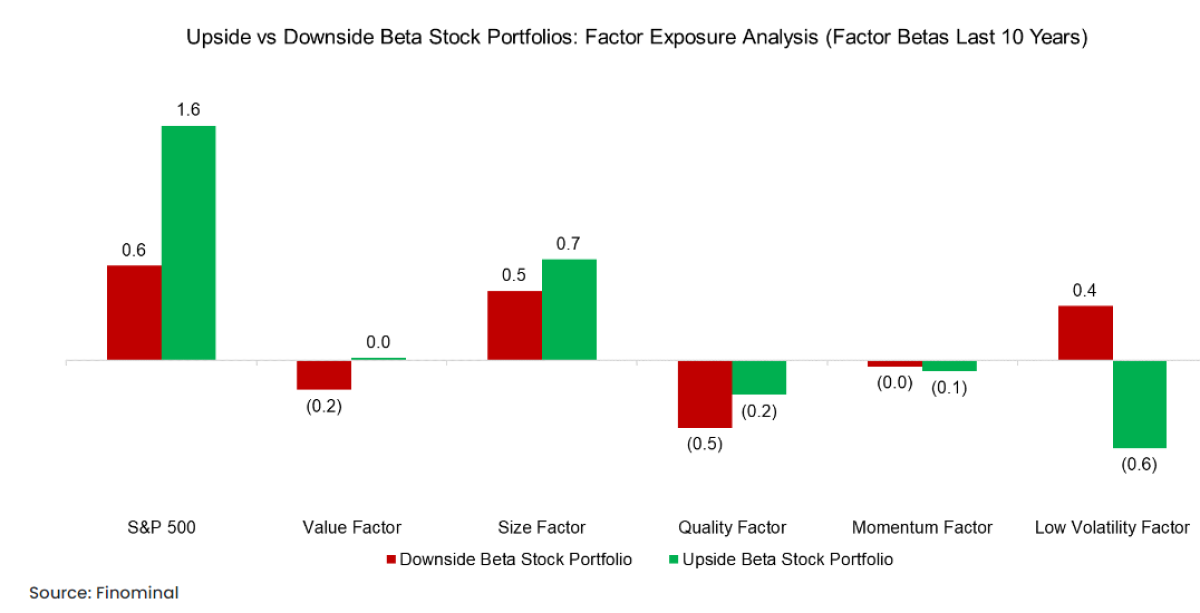
Running a factor exposure analysis on both portfolios over the last 10 years highlights the difference in betas to the S&P 500, but also similar exposure to the size and quality factors, which were positive and negative. The betas to value and momentum were negligible, and most prominent was the exposure to the low volatility factor, where downside stocks exhibited a positive and upside stocks a negative beta (try Finominal’s Know Your Factors tool for a factor exposure analysis).
The large positive beta of downside stocks to the low volatility factor indicates that these two are related, which is also confirmed by the sector biases. Low volatility stocks are typically derived from sectors such as real estate, utilities, and telecom.
EXCESS RETURNS FROM UPSIDE & DOWNSIDE STOCKS
Finally, we compute the excess returns from these two portfolios by adding a short position on the stock market. Given that the betas are significantly above and below one, we need to adjust these to make the long-short portfolio beta-neutral (read Factor Construction: Beta vs $-Neutrality).
We observe that the excess returns from upside stocks were consistently negative during the last 20 years. Downside stocks generated a positive excess return, albeit almost all of that was generated between 2003 and 2004. The performance thereafter was random.

FURTHER THOUGHTS
What do we conclude from this analysis?
First, if a stockbroker is talking about the upside of a stock and recommending it, then it better not be the upside beta as that is a clear indicator of underperformance. Second, stocks with low downside betas can be considered a proxy for low-volatility stocks. It seems that this metric is better applied to asset classes and fund selection rather than single stocks.
RELATED RESEARCH
Shorting Lousy Stocks = Lousy Returns?
LOVM: Low Volatility-Momentum Portfolios
Volatility, Dispersion & Correlation – Friends or Foes?
Downside Betas vs Downside Correlations
About the Author:
Nicolas Rabener is the founder & CEO of Finomial (formerly FactorResearch) and previously founded Jackdaw Capital, an award-winning quantitative hedge fund. Before that, Nicolas worked at GIC and Citigroup. Nicolas holds an MSc from HHL Leipzig Graduate School of Management, is a CAIA charter holder, and enjoys endurance sports (100km Ultramarathon).