


By Michael Markov, co-founder, and chairman of Markov Processes International, Inc. (“MPI”), a fintech provider of investment research solutions.
Many high-profile funds with set risk targets exhibit levels of volatility last seen only during the Global Financial Crisis. This and the disparity of results between funds in the category is the subject of this post.
The increased correlations of bonds and equities have caused significant losses in traditional passive balanced stock/bond strategies that have become gospel to investors, as the WSJ reported in a prominent October story “The Trusted 60-40 Investing Strategy Just Had Its Worst Year in Generations”. A less highlighted casualty of the changing stock/bond relationship, however, has been risk parity – and the pension funds that adopted such institutional-oriented strategies and products en masse.
The risk parity or “balanced beta” approach popularized by Ray Dalio’s Bridgewater Associates allocates investor dollars based on the risk contribution of an asset class to a portfolio. Their “All Weather” fund is literally intended to ‘weather’ all economic environments reasonably well – or in the manager’s words to “chug along, providing attractive, relatively stable returns”. The category Dalio pioneered has become very popular with institutional investors, with hundreds of billions of dollars allocated globally[1], where the strategies are often viewed as a distinct asset class[2].
And while Bridgewater’s All Weather fund still manages $32B AUM[3], the fund’s performance has been anything but all-weather recently. Last year, the fund lost -22% – two percent more than its -20% loss in 2008 during the Global Financial Crisis. This year, All Weather is up 4.5% through November, boosted out of negative territory at the end of October (down -1.8% vs 2.9% for a Global 60/40) by the best month for bonds since the 80’s and a top 20 month for large-cap domestic stocks. (The Fed’s pivot at their December meeting will most likely provide a further lift.)
In the bar chart below, we compare 2022 and 2023 year-to-date through November performance of some of the largest and most referenced risk parity mutual funds, ETFs, UCITS, hedge funds and institutional products (SMAs) alongside Bridgewater’s All Weather 10% Volatility Target fund[4]. We also added a Global 60% stocks/40% bonds portfolio[5] as a reference point (after all, the risk parity approach was created to provide a “better 60/40”) and the Permanent Portfolio (PRPFX) mutual fund – a multi-asset portfolio strategy where assets are equally rebalanced between equities, bonds, cash and gold (and other inflationary assets silver, real estate and natural resources).[6]
To be fair, Bridgewater was not alone in 2022; performance was a disaster for the category as a whole. Most risk parity products significantly underperformed the -16.1% return of the Global 60/40 benchmark; the HFR Risk Parity 10% Vol Target Institutional Index, an equal-weighted average of hedge funds implementing the strategy, was down -19.5% for the year. AQR’s Multi-Asset Fund (AQRIX) – their rebranded risk parity strategy – stands out for preserving capital, with a peer group-leading return in 2022 (-10.5%). Columbia Adaptive Risk Allocation Fund and Invesco Balanced-Risk Allocation Fund slightly bested a traditional balanced portfolio in 2022, while Man AHL Target Risk UCITS Fund saw a similar drawdown.
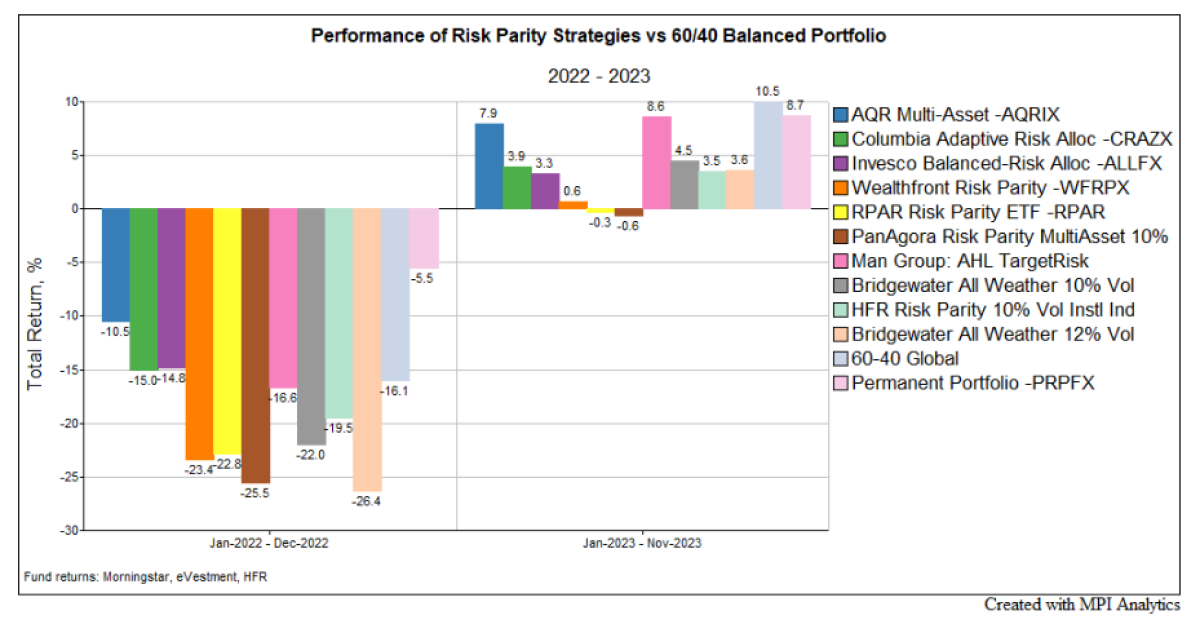
This year through November 30th, the dispersion of results is quite wide, from the -0.6% loss for PanAgora Risk Parity Multi Asset to a 8.6% gain for Man AHL Target Risk UCITS, which together with AQR’s AQRIX (7.9%) have the best performance in the group. The best, however, is still shy of the 10.5% return of the Global 60/40, propelled by November’s “everything rally”. The average institutional risk parity fund gained 3.5%, per HFR, rebounding from being in the red -1.6% through October.
The Permanent Portfolio stands out with significant allocations to both equities and gold contributing to its exceptional capital preservation in 2022 (-5.5% loss) and 8.7% return through November this year.
We wrote about 2022 risk parity challenges in detail: the algorithms had nowhere to hide amid unprecedented inflation, with commodities being the only asset providing a real inflation hedge, and a historic, if delayed, rate hiking cycle to combat price increases. Any funds that used TIPS to hedge inflation or significantly levered fixed income suffered massive losses. [7] Blame the weather – or the Fed.
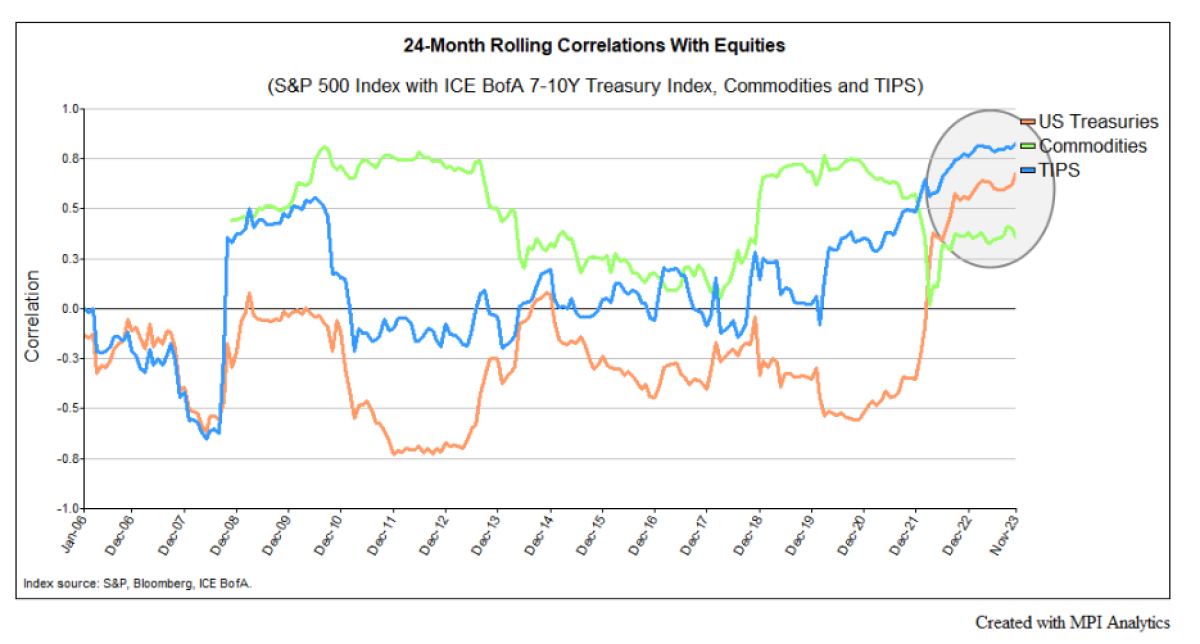
This year the climate has improved a bit for the strategies, but we’re witnessing (for the first time in decades) correlations between Treasuries and equities moving solidly into positive territory – reaching .65 in 2022. In the chart below, we show 24-month rolling correlation of the S&P 500 Index with ICE BofA 7-10Y Treasury Index, ICE BofA US Inflation-Linked Treasury Index (TIPS), and Bloomberg Commodities Index. Starting in 2022, all correlations trended upwards. That has not been good news for risk parity, as the strategy relies heavily on a low-to-negative correlation between stocks and bonds even more than a traditional 60/40 portfolio does because of the leverage typically involved.
But what’s most troubling this year is that the realized risk of some risk-parity funds is significantly exceeding targeted levels of volatility, making some question the methodologies and fundamentals of certain managers’ risk management algorithms.[8]
Risk-parity implementation – precisely targeting or not exceeding a volatility level – is dependent on one’s ability to measure, estimate and/or predict asset class correlations and risk. Most important in that mix is fixed income because it’s the asset class being levered.
The chart below shows rolling 24-month standard deviations of the funds’ returns. While the strategies measure target volatility over various timeframes, when looking at a 2-year rolling window, we note that some funds – including Bridgewater’s All Weather, Wealthfront, RPAR and PanAgora – have realized volatility roughly 50-80% higher than their stated targets, as well as exceeding the Global 60/40 benchmark[9]. In fact, the oldest funds in the group – Bridgewater All Weather and PanAgora Risk Parity Multi Asset – have been at or above volatility levels they haven’t hit since the Global Financial Crisis.
(The chart below is an interactive plug-in in the original article. A link is provided at the bottom of this post.)

With one exception, the current volatility levels of funds in the peer group are the highest ever, or on par with the highest on record.[10] Notably, this is happening when the Global 60/40 is well below its record volatility (14.2% currently vs. 17.3% in the GFC) and VIX has trended to its lowest in almost four years.
As well, the current dispersion of exhibited volatility amongst the products is large. Columbia stands out for maintaining volatility below target, and a few other funds have lower standard deviation than the Global 60/40. While the average institutional risk parity strategy has about matched the 60/40’s volatility of late, this is largely the result of diversification (it’s an index of funds).
It is well-documented that a scenario of high inflation and rising rates can be unfavorable for the performance of risk-parity strategies. Here, the challenge is that movements in equity and fixed income no longer counterbalance each other, undermining the diversification benefits between the two principal assets that have persisted since the millennium. In addition, inflation-hedging assets – TIPS and commodities – have largely moved in lockstep with equities this year. Risk parity algorithms, when detecting such a market environment, are expected to reduce emphasis on fixed income and redistribute weight to other asset classes. However, in the current situation, it appears that some may have not made such adjustments, causing overall portfolio volatility to rise 50 to 80 percent.
Traditionally, we run strategy or fund returns through our MPI Stylus system using Dynamic Style Analysis (DSA) to decipher the dynamic of allocations and the estimated leverage of risk parity funds. This can provide clues into, and attribution of, their performance and risk. Such an analysis of risk-parity funds is particularly important because it can validate the “parity” between risk allocations and to see what might be happening – by just using monthly performance (or daily for mutual funds, ETFs and UCITS).
The chart below shows the result of such analysis – the changes in effective exposures of risk-parity products to aggregated asset classes over the past nearly two years compared to the average risk parity hedge fund and Global 60/40 benchmark. The red negative exposure indicates the estimated level of leverage[11]. The range is significant. It’s also worth noting that Bridgewater All Weather 10% Vol appears to have the highest level of implied leverage in the group for strategies with a 10% volatility target and behaves as if it started rapid deleveraging only at the end of 2022 – after the Fed was more than halfway through the most rapid rate hiking cycle in recent history. PanAgora’s Risk Parity Multi Asset strategy shows a similar pattern.
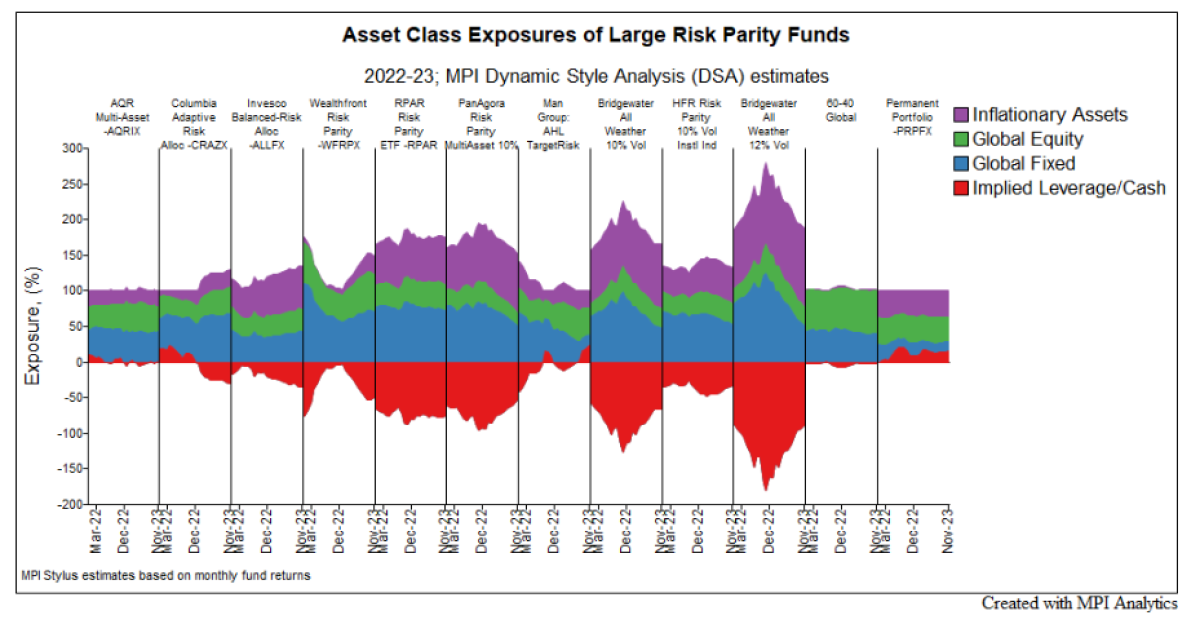
Once all products are looked at through the same quantitative returns-based lens, it becomes apparent how strikingly different they behave in leveraging bonds and inflationary assets (TIPS and commodities). Where they do seem to agree is in lower equity exposures. Any product that either looked similar to the long-only Global 60/40 (e.g., AQR, Columbia, and Man AHL) or showed lower implied leverage and was exposed to commodities vs. TIPS as an inflation hedge (e.g., Invesco) had better performance and lower risk over the past two years. As expected, DSA estimates the Permanent Portfolio’s exposures are equally split between equities, bonds/cash and inflationary assets (precious metals in the case of PRPFX).
When looking at efficiency as expressed by risk-adjusted returns over both the short- to mid-term (3-5 years) and longer-term (10-15 years), both a Global 60/40 and the Permanent Portfolio – with its simple allocation formula – dominate most or all risk-parity funds (depending on the window viewed) as shown in chart below. This is a tough result to swallow because better efficiency has been a selling point of risk parity.
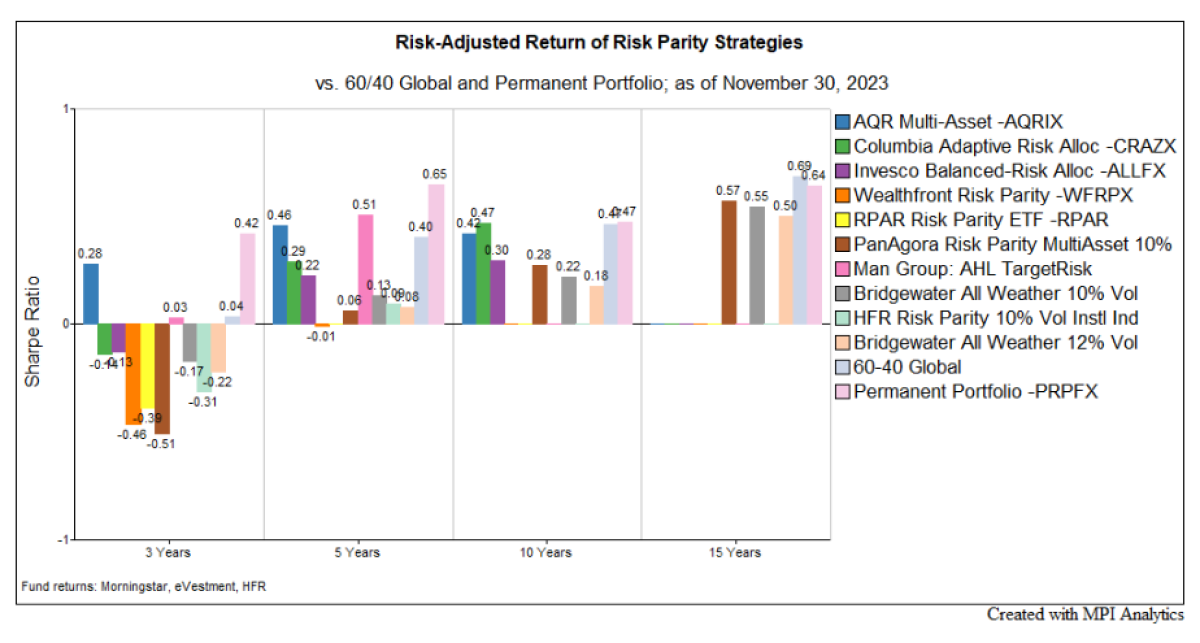
The risk parity approach has its roots in a simple idea that shorting and leveraging inevitably “lifts” Markowitz’ efficient frontier to allow for more optimal (read “higher Sharpe Ratio”) portfolios. That was also the premise for the 130/30 obsession some fifteen years ago that we rarely hear about anymore after suffering brutal GFC drawdowns. As a group, risk parity’s vast dispersion of returns coupled with low portfolio efficiency and volatilities that have gotten out of control – for funds implementing seemingly the same idea with the same volatility targets – needs an explanation.
No one has perfect foresight on correlations and volatilities across all asset classes. It would seem that estimation errors and widely different projections utilized in risk management algorithms are being magnified by leverage and/or shorting. This is likely leading to the observed wide dispersion in risk parity funds’ results – something that we don’t typically see among long-only products. It’s interesting to note that two of the most efficient funds with the best performance – Man AHL Target Risk and AQR Multi-Asset – are the closest to being long-only.
The experience of the past two years strongly suggests that risk parity is not an asset class that investors can “set and forget” – especially considering such a wide dispersion of results between funds targeting a similar concept (balancing risk) or volatility level. Additionally, managers’ reliance on predictions of risk levels and correlations between assets – both short- and long-term – mean allocators would be wise to monitor the managers they place money with, especially if they choose to make sizable allocations to risk parity.
With a heightened likelihood of longer-term changes in correlations, calls for continued ‘higher-than-Fed-target’ inflation and more elevated volatility in rates as the market vacillates between a future that sees “immaculate disinflation” and a soft landing, stagflation or a hard landing, investors would be wise to realize that a striking disparity in risk parity managers’ approach to balancing portfolio risk remains – and is likely to persist. Investors in risk parity strategies, whether hedge funds, UCITS, mutual funds, ETFs, or SMAs, should pay attention – especially when their volatility exceeds targets, recent implied leverage varies from near zero to well over 100% and estimated exposures suggest a vast range in methodologies, from less responsive and/or backward-looking to super reactive, tactical and forward-looking.
For institutional investors who became comfortable enough with risk parity during the end of the 40-year bond bull market to lift allocations to the strategy out of their hedge fund bucket into a standalone category, has the recent period of inflation, rising rates and staggeringly dispersed and often disappointing results led them to reconsider risk parity as an asset class?
Footnotes:
[1] In 2015, Bridgewater estimated there to be $400B AUM in risk parity, per Financial Times’ reporting.
[2] For example, the $184 billion Texas Teachers pension’s allocation to risk parity was $13.2 billion, or 7.2% of total assets as of August 31, 2022. It lost -17.20% in FY2022. Risk parity’s 8% target occupies a separate line in the asset allocation on the same level with Global Equities. P.60 ACFR 2022 (texas.gov).
[3] AUM of the 10% target vol strategy as of October 31st, 2023, as reported by HFR, is down from $78 billion in 2015 due to a combination of redemptions and performance. For example, in 2020, then $55B Pennsylvania PSERS board unanimously voted to reallocate $2B from “expensive and underperforming” investments, including from Bridgewater as they shifted out of risk parity hedge funds that had comprised 8% of assets.
[4] We also included the smaller ($3B AUM per HFR) Bridgewater All Weather 12% Volatility Target fund for additional perspective on the risk parity pioneer’s strategy performance and behavior.
[5] 60% MSCI ACWI Index, 40% Bloomberg US Aggregate quarterly rebalanced.
[6] A fund based on the idea pioneered by Harry Browne in 1981 in his book, “Inflation-Proofing Your Investments.” While disciples of Browne have varying interpretations of the concept, PRPFX has been a prominent expression of the idea since its 1982 inception.
[7] It is worth noting that in 2015, Financial Times reported that Bridgewater “sought to ease concerns that the strategy was particularly vulnerable to a bond sell-off”, estimating that risk parity would’ve done well in the “bond-hostile inflationary” ‘70s and that over the rising rate period from 1946 to 1981 a risk parity strategy would’ve returned 8.7% annually, outperforming a traditional balanced stock/bond fund.
[8] A topic Risk Magazine’s Luke Clancy dove into last year in “Keep Risk Parity Simple, Stupid”.
[9] Bridgewater All Weather 12% Vol has a 12% volatility target. It’s our understanding that other funds / strategies included target a 10% volatility level.
[10] As measured by 24-month standard deviation. Wealthfront WFRPX’s peak volatility of 18.6% was in February 2022 (14.76% currently). Man AHL’s November volatility level of 11.8% is slightly lower than the 12.1% hit in April 2023.
[11] DISCLAIMER: MPI conducts performance-based analyses and, beyond any public information, does not claim to know or insinuate what the actual strategy, positions or holdings of the funds discussed are, nor are we commenting on the quality or merits of the strategies. This analysis is purely returns-based and does not reflect actual holdings. Deviations between our analysis and the actual holdings and/or management decisions made by funds are expected and inherent in any quantitative analysis. MPI makes no warranties or guarantees as to the accuracy of this statistical analysis, nor does it take any responsibility for investment decisions made by any parties based on this analysis.
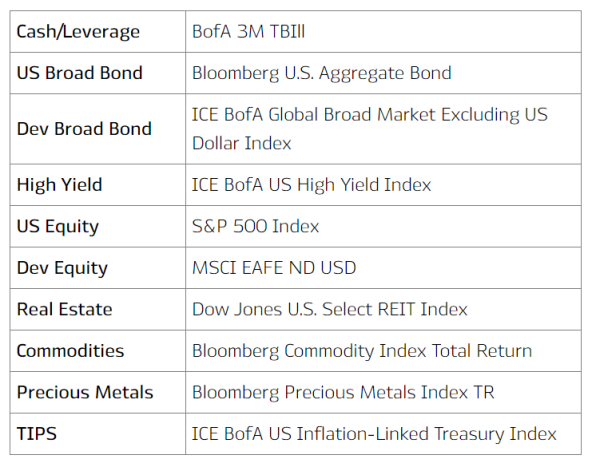
The list of market indices used in the quantitative dynamic analysis of risk parity funds’ exposures in MPI Stylus:
About the Author:
Michael Markov is co-founder and chairman of Markov Processes International, Inc. (“MPI”), a fintech provider of investment research solutions.

In 1992, recognizing the power that quantitative analysis delivers investors, he led the development of the industry’s first returns-based style analysis application based on Bill Sharpe’s groundbreaking methodology. Continuing this spirit of innovation, he co-authored Dynamic Style Analysis (“DSA”), a significant advancement to legacy returns-based modeling techniques for investors seeking the most precise analysis of managed investment products and portfolios. Being an industry expert in quantitative analysis, Michael is a frequent speaker at investment management forums around the globe on fund performance attribution, due diligence and monitoring, investment risk management, and hedge fund analysis. His thoughts and opinions are regularly sought by the leading financial press.