


By Brian A. Schroeder, the founder of OCIO Monitor, a specialty consulting firm that provides due diligence of investment consultants and outsourced chief investment officers.
As a public service to every institutional asset owner, here are some questions and statistical observations SBCERA's trustees should explore with their internal investment staff and investment consultant. This topic is seldom given a second thought, which is a mistake.
SBCERA reported beating its Policy Index in FY-2022 by 1,120bps, and by 1,360bps in FY-2021. This hot performance came to my attention by a recent Pensions & Investments story. It was so extraordinary, I wanted to learn what generated such fantastic relative performance.
My attribution analysis, based strictly on their publicly available reports, indicates they added value through manager alpha and tactical asset allocation. But it appears their Policy Index construction method also helped these last two fiscal years.
FYI, I have never worked with SBCERA either as a manager or consultant. And I have never had a mutual client with their investment consultant. This is strictly an exploration of an industry practice using SBCERA as an example due to their recent outperformance and because their reports are publicly available.

Question 1: What is our Policy Index?
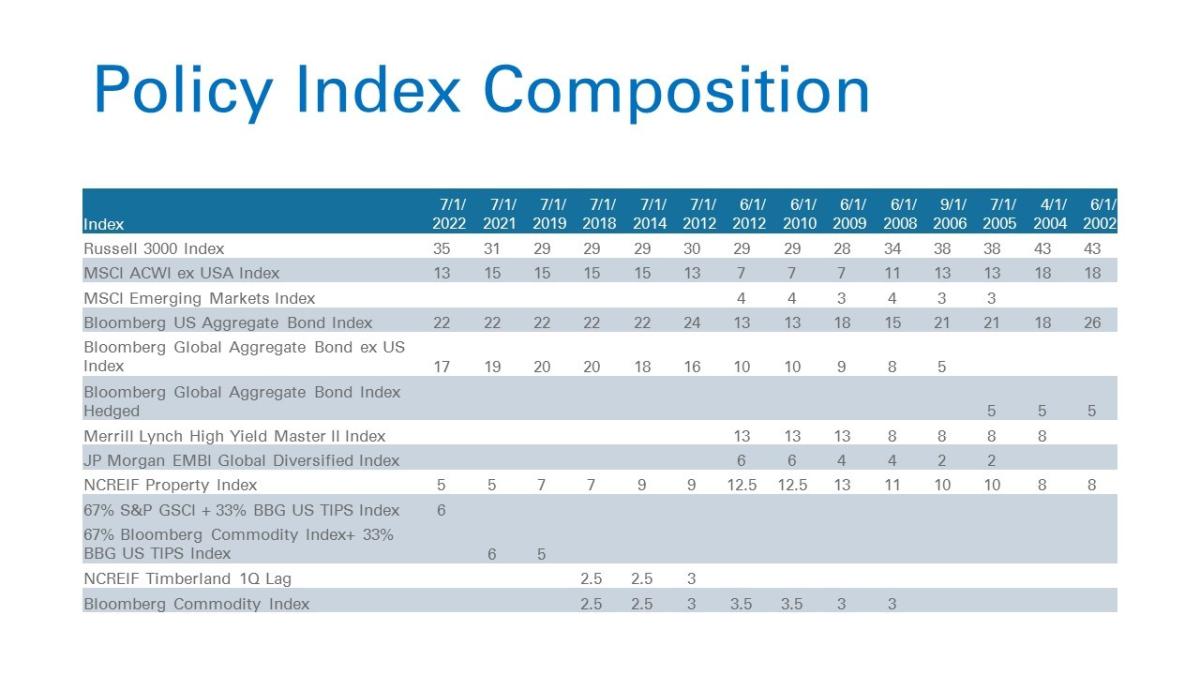
In SBCERA's performance reports the investment consultant does not disclose a construction history of the Policy Index. They do provide a history for other similar clients within SACRS. Specifically, they disclose for Stanislaus and what is current for Ventura. After several emails and phone calls over many weeks, I received the following history. (Note, the missing 2% is cash.)
This type of disclosure should appear in every client report from every investment consultant/OCIO. By having it documented, it will memorialize the history so that the chance of "gaming" is lessened (see Goodhart's Law.) And yes, I have seen total plan benchmarks manipulated in truly creative ways. Read this to learn how it is done. One investment consultant even did a manual overwrite!
Question 2: How is our Policy Index constructed?
In my 13 years of performing due diligence of investment consultants and OCIOs, I have learned there are two common total plan benchmarks. The first is broad-static and the second is specific-dynamic. The vast majority use only the specific-dynamic.
A broad-static total plan benchmark is expected to meet the risk/return objectives over an infinite period and covers a wide opportunity set. It will rarely, if ever, change. For instance, 60% MSCI-ACWI and 40% Bloomberg Global Aggregate Bond Index- the "Global 60/40." Domestically, it is the "60/40." With the advent of alternatives and finer asset class diversification, those that use a broad-static now do something like a 50/30/20 with each broad asset class partially sub-divided.
A specific-dynamic total plan benchmark uses individual indexes whose weightings precisely reflect the ever-changing strategic targets contained in a written strategy, like an Investment Policy Statement. The specific-dynamic total plan benchmark is a Linked Benchmark. It has also been called "benchmark hopping."
If you understand these two total plan benchmarks, and if they are constructed and reported faithfully, they are an insightful combination. But if only one is reported, its use is limited and potentially misleading. I will explain how to use and interpret them at the end.
Considering the Policy Index Composition above, it is broad-dynamic. It is neither of the common industry practices. In other words, they use broad indexes and then change the weightings. (You can see it has changed 3 of the last 4 years.) This hybrid of the two common methods does not make return attribution readily apparent. Is it strategic allocation, tactical allocation or manager alpha determining our relative performance?
Because there are no industry standards and no legal guidance on how to create a total plan benchmark, no one can say if this broad-dynamic method is right or wrong. I will say, however, this broad-dynamic method can make subtle differences more pronounced during volatile markets in both directions.
Question 3: What is our strategic asset allocation history?
Below is the recent history for SBCERA's strategic asset allocation history as presented in their quarterly performance reports.

If you compare the Policy Index Composition history with this strategic asset allocation history, you can see similarities and stark differences. Let's review a few of them now.
Public Domestic Equity, Private Equity & Private Debt appear to be combined into the Russell 3000. If you add together the strategic weightings, they equal the broad-dynamic weighting. But most consultants either make the private equity index R3000+ X%, or they use a universe. Plus, in times of high volatility, the divergence between public and private can be vast. Just consider the first half of 2022- public equity down ~20% while PE is down single digits, not to mention private debt.
US Core Fixed, US Credit and Absolute Return appear to be combined into the Bloomberg US Aggregate Bond Index. Yet if you look at the individual manager strategies and their respective benchmarks, most are out-of-index and more aggressive. Just 2% of the total portfolio is actually invested in US Core Fixed, yet that index represents 22% of their broad-dynamic Policy Index.
Non-US Core, Non-US Credit and Emerging Markets Debt appear to all be combined into the Bloomberg Global Aggregate Bond ex-US Index. Non-US Core, as a target, had only a 1% allocation, then a 0% allocation. The Global Aggregate is also an investment grade index, yet the Non-US Credit allocation, which likely has investment grade and below investment grade, has been a consistent 11% of the total portfolio. In their meeting books they benchmark the Non-US Credit against the ICE BofA Euro High Yield Constrained TR.
Considering these last three paragraphs, there are substantial out-of-index allocations within 87% of their broad-dynamic Policy Index. The problem with this is it makes it difficult to understand return attribution- "are we performing well, or is the Policy Index performing poorly?" The reverse can also be true with good performance looking bad, depending on the direction and magnitude of the markets for the period observed.
Looking at the asset class benchmarking details above, it is not unfair to question if the portfolio is stealth aggressive. Or conversely, is the Policy Index stealth conservative? Over time, a more aggressive portfolio should handily beat such a Policy Index. And it can diverge greatly in shorter periods as you're about to read.
Lastly, the SBCERA portfolio has a beta overlay that uses derivatives to tactically weight and rebalance. A strategic allocation is long-term, and tactical is temporary. But if you compare the historic beta overlay targets to the stated policy targets, you will notice a consistent over/under weighting of certain asset classes.
It's not unreasonable to conclude the overlay targets are the true strategic/policy targets, making the implemented strategy again more aggressive than the Policy Index. Of course, this depends on your definitions of strategic and tactical. Beta overlays can also involve leverage. If so, how then is leverage reflected in the Policy Index? And be aware that leverage may be present within individual manager strategies.

Question 4: How does our Broad-Dynamic compare to a Specific-Dynamic?
Again, most institutional investors compare total plan performance with a specific-dynamic total plan benchmark. It is objectively created following the targets for each asset class in the Investment Policy Statement using the appropriate benchmark. This ensures an apples-to-apples comparison minimizing the potential for manipulation.
The bar chart below shows the quarterly differences between a re-created specific-dynamic total plan benchmark and the reported broad-dynamic Policy Index. The re-created specific-dynamic is the average weighted quarterly returns of SBCERA's target allocations and the benchmarks per their Total Fund Risk Statistics page.
The re-created specific-dynamic Policy Index is very close to what is reported for the first five fiscal years. However, once there was large volatility starting with the covid crash, you can see the divergence starting Q1-2020 and continuing for 9 more quarters.

The average annual arithmetic difference for the 5 fiscal years ending 2020 is estimated to be 0.12% (12bps.) For the last two fiscal years the estimated average difference is 4.40% (440bps.) That is a 36x difference and happens to be in the favorable direction.
Looking at it another way, for the last 2 fiscal years the re-created Policy Index had an estimated cumulative return of +16.0%. The broad-dynamic Policy Index showed just +6.2%. (Note, the private equity return for Q2-22 was estimated based on preliminary data currently available.)
To put this into perspective, I estimate 35% ( (2x440)/2480 ) of the reported outperformance the last 2 fiscal years can be explained by using the broad-dynamic Policy Index instead of a specific-dynamic total plan benchmark. To cross check, I estimated the value-add from manager alpha and tactical asset allocation and subtracted them from the reported outperformance. Following this alternative method, approximately 39% of the outperformance is explained by the Policy Index. Since they have similar results, I am confident in my estimates.
SBCERA indeed had good performance following the covid crash. Even so, every Board of Trustees needs to understand how their Policy Index is constructed because it has the potential to affect relative performance comparisons, both near term and over time.
Coincidentally, SBCERA was interviewing potential replacements for their investment consultant. A committee vote was made in June of 2021 to replace, but it failed. The incumbent was retained. Did relative performance presentation impact their decision?
Question 5: Is there a better method?
The broad-dynamic Policy Index used for SBCERA is not mainstream. And its construction, compared to how the actual portfolio has been invested, appears to make it easier to beat over time.
Because there are no formal standards or laws for creating total plan benchmarks, no one can say the way an investment consultant or OCIO does it is right or wrong. Therefore, prudent plan sponsors must learn how their total plan benchmark is created to understand how it can affect performance presentation in different markets and over the long run.
Fortunately, there is a better way for institutional asset owners. Use both a broad-static and specific-dynamic in combination. This approach will help institutional asset owners better monitor their investment results and improve governance. It is better than what most every institutional asset owner reviews today, and a positive step forward for consistency within an industry masterful at playing with numbers.
This one-page benchmarking strategy is simple, objective, transparent and conveys meaningful comparisons so institutional asset owners can better monitor and govern their investment plans. Plus, this method practically eliminates gaming or manipulation because it is objectively constructed and can be objectively tested.
Click here to download a PDF of this one-page handout. If you would like more information, or would like to comment/question offline, email admin@OCIOmonitor.com.

About the Author:
Brian A. Schroeder is the founder of OCIO Monitor, a specialty consulting firm that provides due diligence of investment consultants and outsourced chief investment officers. He has over 30 years of investment experience, as both an institutional manager and consultant.
