


By Dr. Michel Degosciu, Ph.D. and Robin Jakob, Ph.D. managing partners of LPX AG. LPX AG is a leading research house in the field of Listed Alternatives and offers investment professionals a wide range of services, covering global listed private capital.
Over the past few years, the private credit asset class has increasingly attracted investor attention due to a number of factors that have had a lasting impact on the credit market environment in particular. In the 1990 banks reduced their lending activity against middle-market companies. It started in the United States where regional banks began to consolidate and focused on larger transactions that were fee-based. New regulation, introduced after the financial crisis in 2007/2008, led to higher capital requirements not only in the U.S. but also in other countries that are part of the Basel Committee on Banking Supervision.
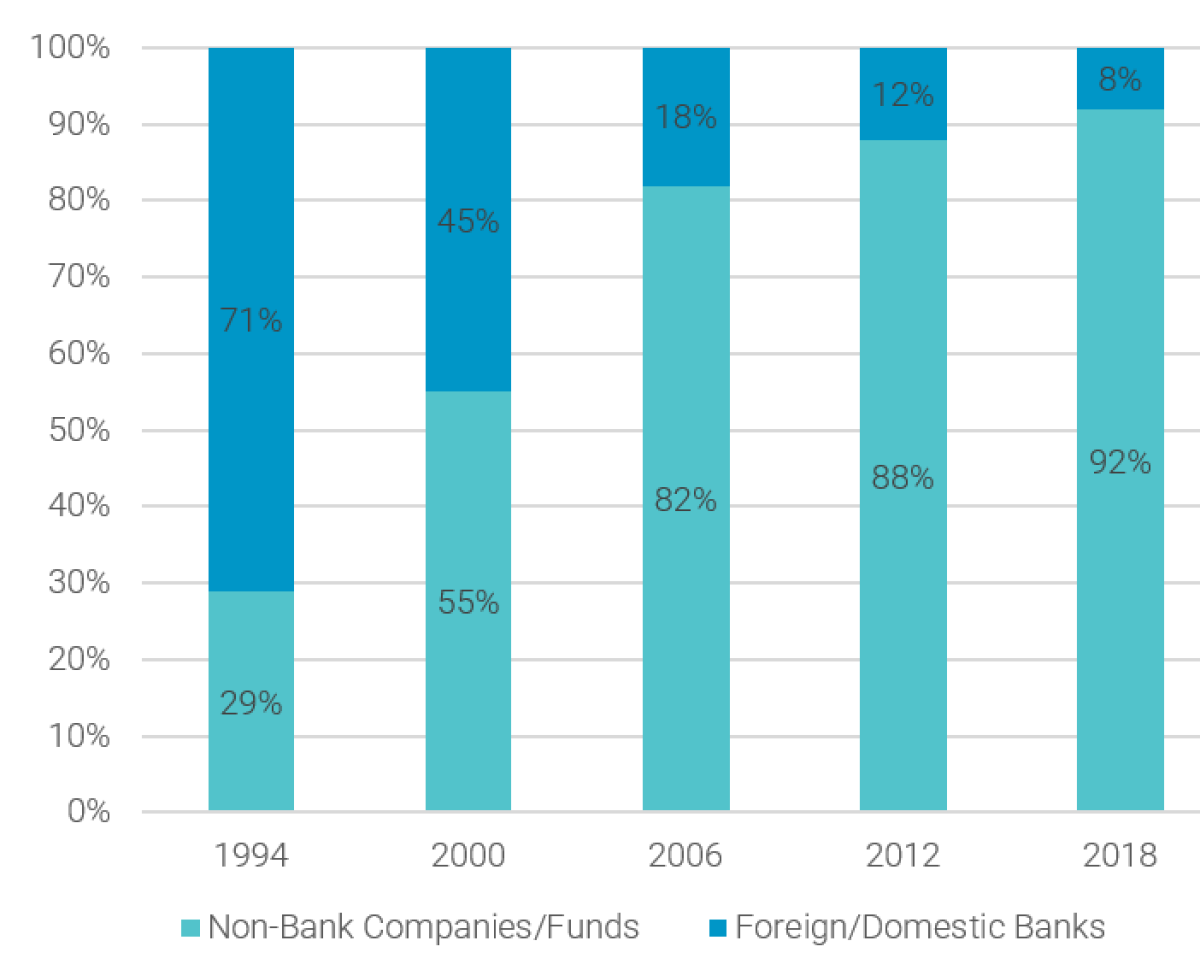
The resulting lending gap has been closed by so-called "non-banks". These have taken over parts of the traditional lending business of the banks and have also launched investment vehicles that offer investors the opportunity to participate in their private credit portfolio. While U.S. banks still had a market share over 70% in 1994, this fell to less than 10% in 2018. Figure 1 shows the increasing market share by “non-banks” since 1994.
Figure 1 – Market share of non-banks
This figure shows the market share of “non-banks” in the U.S. Source: S&P Global Market Intelligence U.S. Leverage Loan Data as of Q2-19.
The aforementioned distortions in the traditional lending business have led to private credit increasingly being perceived as a separate asset class. This is shown by the investment volume, which has risen steadily over the past few years. Figure 2a and 2b show the fundraising commitments and investment volume of funds managed in private credit funds since 2007. The majority of the assets is managed and invested in the US, where the "non-bank" sector is already an integral part of the overall credit market.
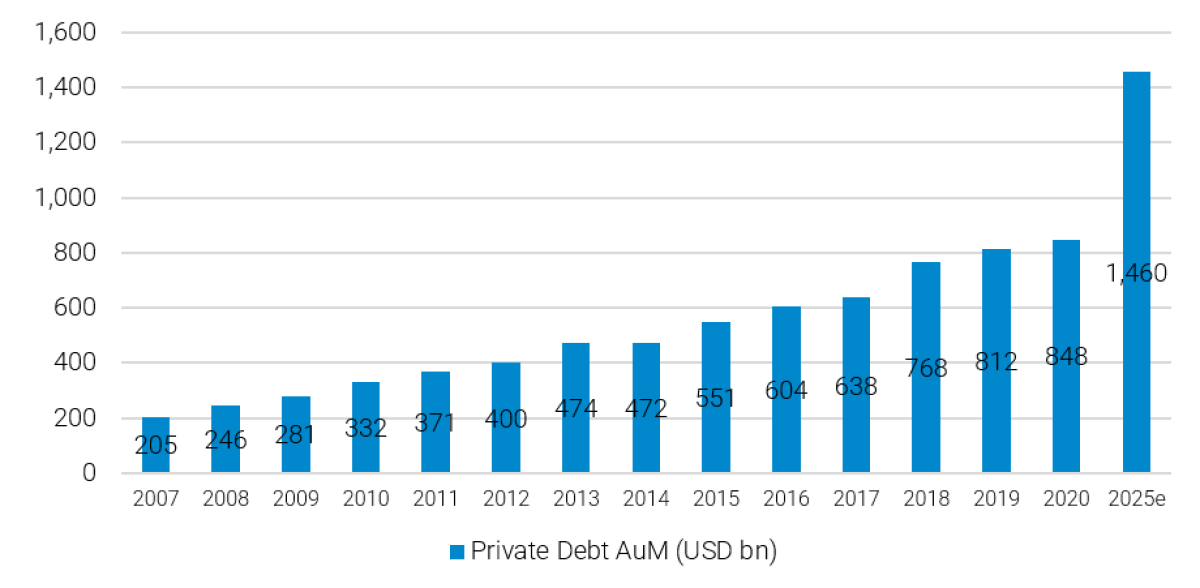
According to the PitchBook Global Private Credit Report H1 2023, fundraising commitments in Private Credit amounted to USD 100 billion p.a. on average (over the past 10 years) with an all-time high of USD 271 billion in 2021. In 2022, inflows were USD 203 billion and in the first half of 2023 USD 95 billion. According to Preqin, assets under management (AUM) reached more than USD 848 billion in 2020. The volume of private credit funds raised in 2020 was approximately USD 118 billion. Preqin forecasts that private credit AUM to exceed USD 1.46 trillion by the end of 2025. This indicates the sustained high level of interest from investors in this asset class.
Figure 2a – Fundraising commitments in private credit
This figure shows the fundraising commitments in Private Credit from 2007 to 2022 in USD billion. Source: PitchBook: Global Private Credit Report H1 2023.
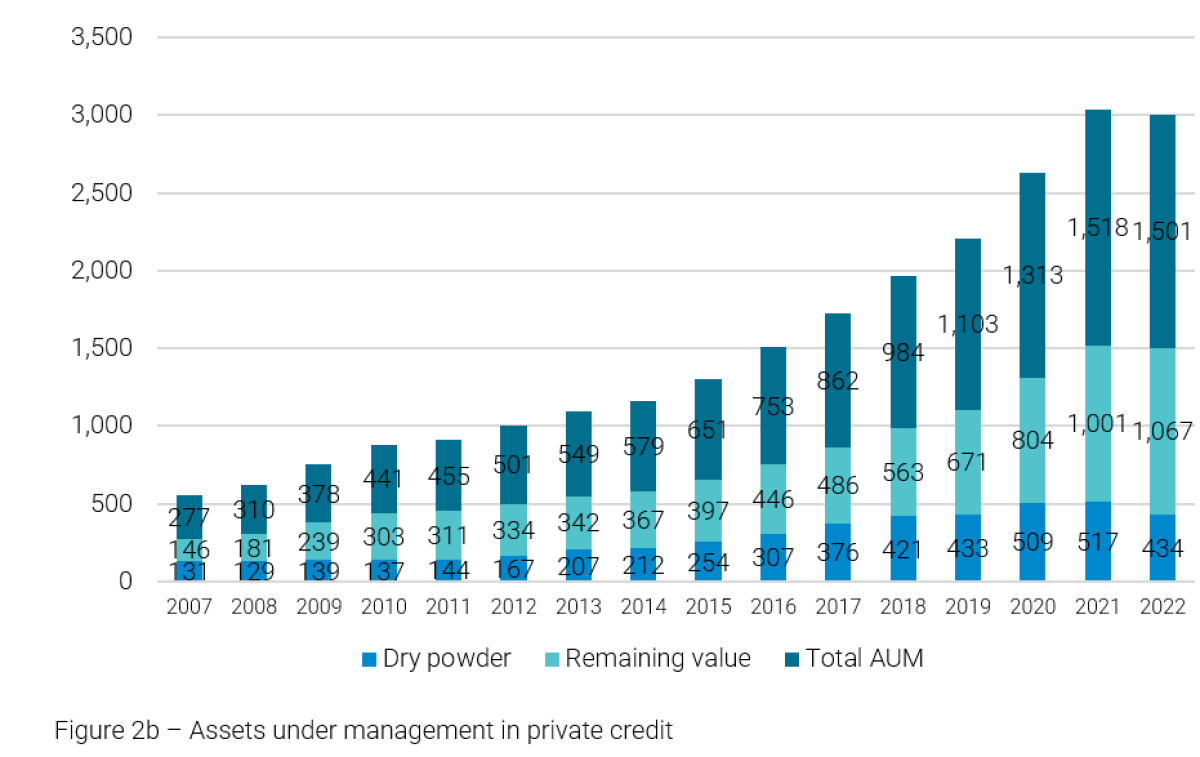
This figure shows the aggregated assets under management (AuM) of closed-end private credit-funds from 2007 to 2019 and expected AuM in 2025 in USD billion. Source: Preqin Global Debt Report 2017 and 2020.
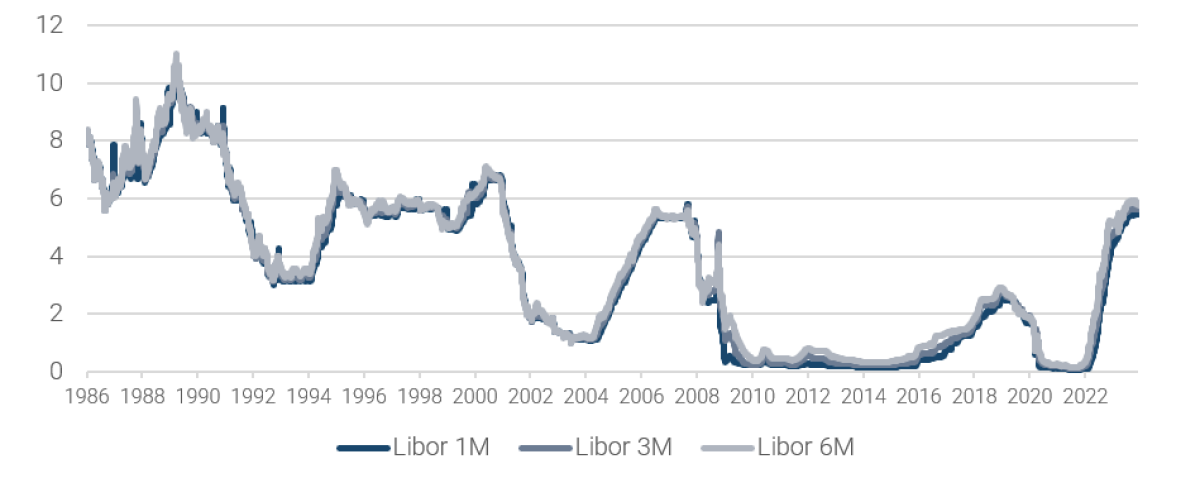
One of the advantages of private debt investments is that typically, the rate structures are floating with no duration in the portfolio. The rate is often linked to the Libor Index and private credit companies typically use “floor+Libor” as pricing mechanism. Figure 3 shows the development of the Libor Index since 1986. This characteristic resulted in attractive relative returns over the past years. The weighted average yield of Listed Private Credit in 2023 was 10.31%[i] which compares to 9.44% of US leveraged loans and 7.58% of US Corporate High Yield Bond (see figures 8a and 8b).
Figure 3 – Libor Index
This figure shows the development of the Libor Index since 1986. Numbers are in %. Source: Bloomberg.
Private Credit
- Benefits of Private Credit
Investing in private credit offers various advantages compared to other forms of debt investments.:
- Hedging against interest rate fluctuations: Loans typically have a shorter duration and floating-rate coupons. This is unlike many fixed-rate debt instruments.
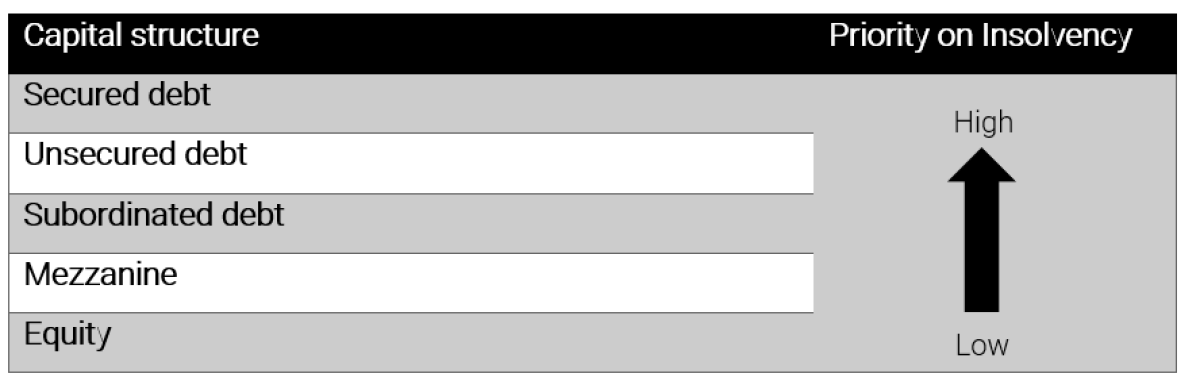
- Higher seniority: Secured loans have a prime position in the capital structure, ensuring priority payment in case of default. Senior secured loans possess primary claims on assets, while junior secured loans, despite being subordinate, still hold seniority over unsecured debt. Listed Private Credit companies usually focused on secured loans.
- Lender protection: These loans offer robust downside protection because they are usually collateralized and occupy seniority positions in the capital structure.
- Enhanced control: Private credit demands deeper due diligence similar to private equity norms. This fosters a relationship-based lending model, granting lenders more control over terms and structures, particularly advantageous during challenging situations.
- Increased diversification: The large size of the universe helps lenders to create more diversified portfolios. Investors can access to loan portfolio that is diversified across various sectors.
- Listed Private Credit offers additional benefits: daily liquidity, no minimum investment, immediate participation.
- Higher yield: Listed Private Credit offers higher yield than other corporate bonds (see figures 8a and 8b).
- Last but not least investing in private credit offers exposure to private-equity-sponsored deals without taking on the same risk level as equity investors.
- Terms and definitions
Private Credit funds pursue various strategies with different risk/return profiles. The risk profile ranches from senior secured tranches to distressed strategies. Basically, it is possible to distinguish between the following types of debt:
- Senior Debt refers to financing through senior loans that may be secured or unsecured.
- Junior Debt are financial instruments that rank lower than other claims against the debtor company in the case of insolvency. These can also be secured or unsecured.
- Mezzanine is a hybrid of debt and equity. It is often used subordinately to bank financing. The total return results from the current interest and an additional participation in the equity of the company.
- Investment possibilities
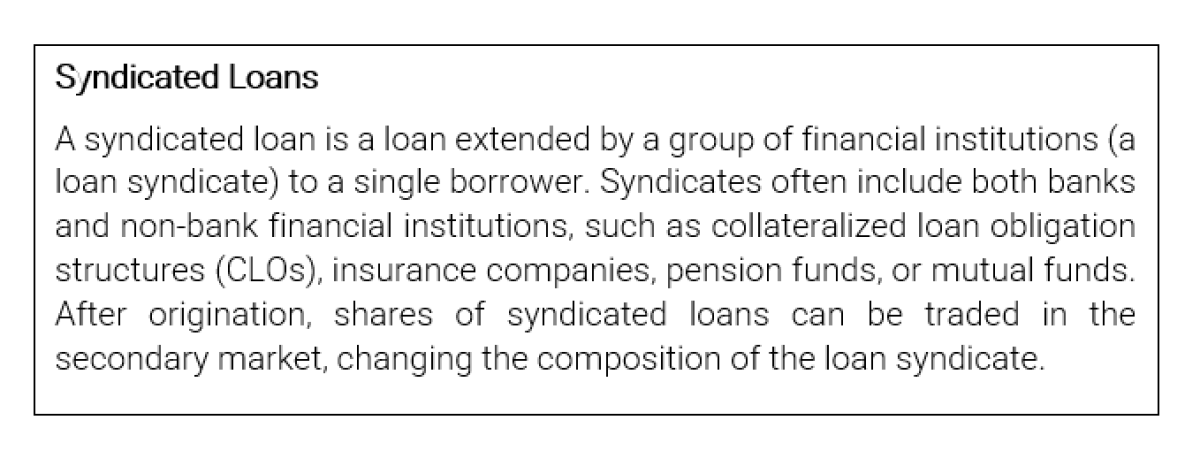
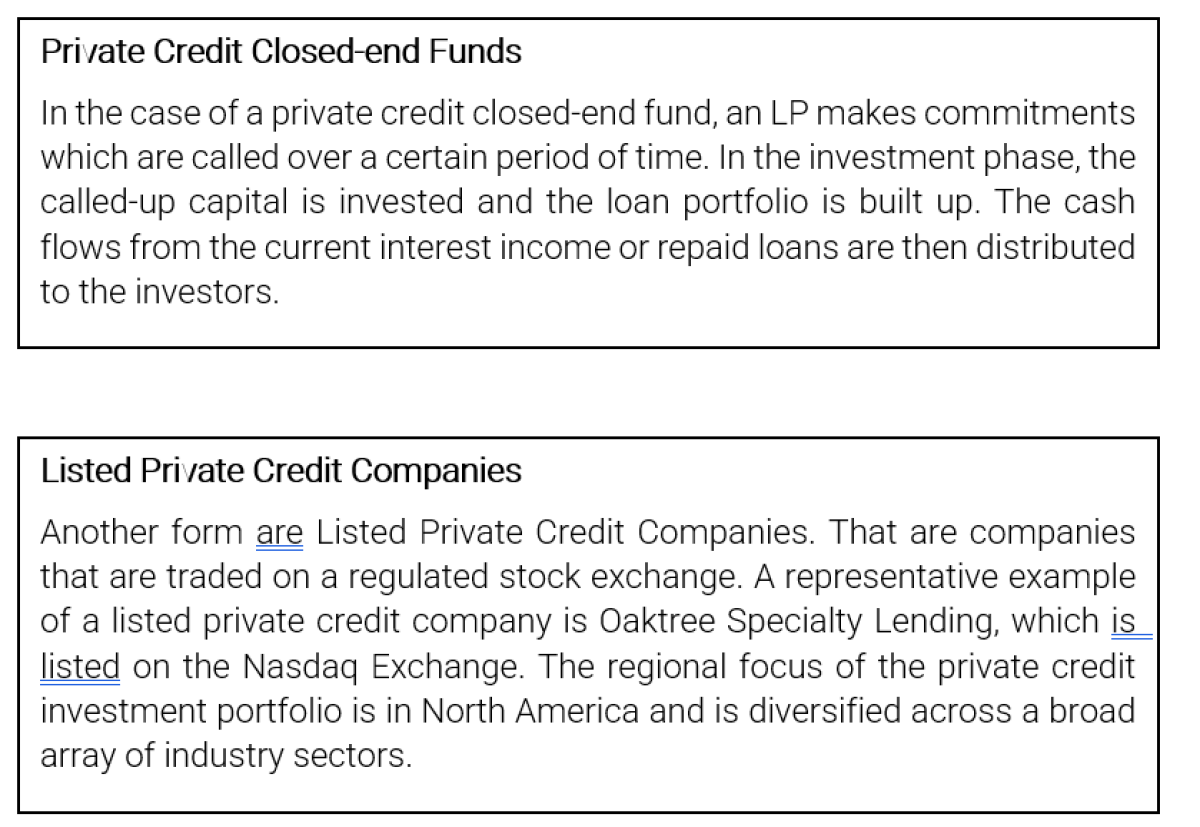
Investors have three possibilities to participate in the private credit asset class. The first one is via syndicated loan portfolios. The second one is via closed-end funds, where so-called limited partners ("LP") provide capital for a certain period of time. In principle, every investor could be an LP, but they are typically large institutional investors, such as pension funds and insurance companies. In the meantime, a number of intermediaries have emerged, which offer retail investors access to closed private credit funds via platforms. The third avenue is through exchange-traded companies whose business purpose is to lend credit to unlisted companies ("listed private credit"). Unlike closed-end funds, which are primarily reserved for institutional investors, the stock market route gives a much broader investor base access to this asset class. In addition to daily liquidity, exchange-traded private credit companies give immediate access to a broadly diversified loan portfolio. Figure 4 shows the organizational forms of closed-end Private Credit Funds and Listed Private Credit Companies. While this is a simplification, it underscores the similarity in the underlying economics of the situation.
- Case study SLR Investment Corp.
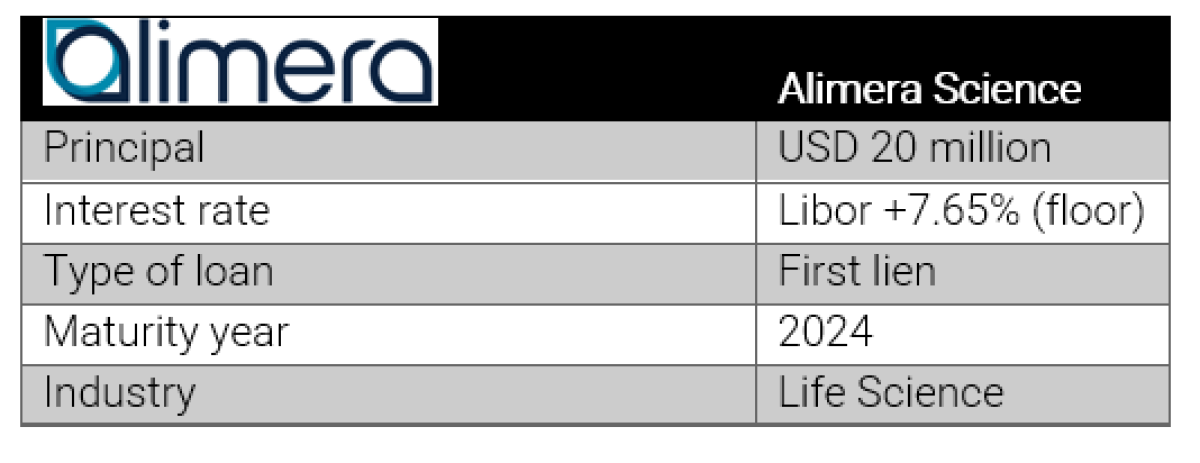
SLR Investment Corp. is a yield-oriented business development company based in the U.S. The company invests in leveraged middle-market companies in the form of senior secured loans, including first lien, unitranche and second lien debt instruments.
Characteristics:
-
- Since inception in 2011 average yield of 9.8% p.a.
- 101 sector-diversified portfolio companies
- Total Assets > USD 2.18 bn; +90 industries
Example of loan investment by SLR Investment Corp.:
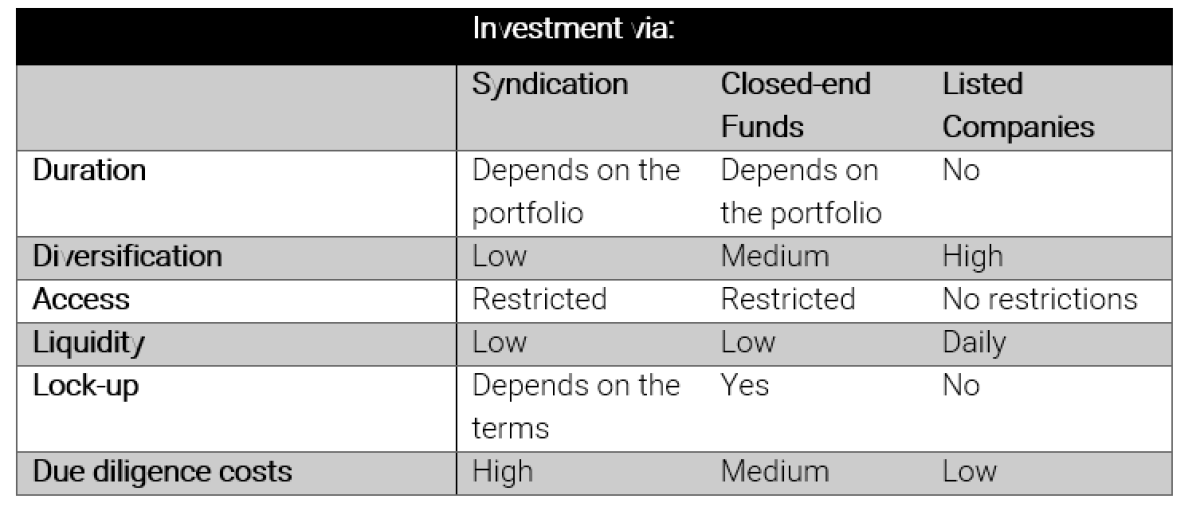
Although each of these organizational forms provide access to the private credit asset class, they have different characteristics that need to be considered. Closed-end private credit funds generally show a high minimum investment requirement, which is to be invested over a predefined period of time. Against this backdrop, closed-end private credit funds are particularly suitable for large institutional clients. There is no minimum investment for an investment via a listed private credit company / fund. In addition, the investment can be traded daily via the stock exchange. Furthermore, it should be noted that private credit funds focus on individual credit strategies. An investor who seeks to invest in a broadly diversified portfolio of different credit strategies must therefore participate in several funds. Due to the low investment requirements, this goal is much easier to achieve over the stock market. Table 1 summarizes the various characteristics for the described investment opportunities.
Table 1 – Investment characteristics
This table summarizes the characteristics of the various investment possibilities in Private Credit.
A key challenge is the identification and categorization of the relevant universe of publicly traded companies that provide debt capital to medium sized companies (“Listed Private Credit”). Since Listed Private Credit is a niche market there is no standard definition available to identify a global universe of Listed Private Credit companies.
For the further analysis, the following admission criteria were defined:
- Provision of debt capital
- At least 50% of total assets must be provided as debt to unlisted companies
- Listed on a regulated stock exchange
- Banks are excluded
Due to the stock exchange listing, the companies / funds are subject to transparency and publication requirements, which allow to gather information about the investment strategy as well as the composition of the loan portfolio. In order to determine the degree of diversification, information regarding the geographical and sectoral distribution of the loan portfolio is also evaluated. Only publicly available information is used as published by the companies through quarterly/annual reports or press releases.
The study is based on a representative universe of listed private credit companies. As of January 1, 2024, a total of 42 companies can be identified worldwide. On average, the investment rate of loans to unlisted companies is over 75%.
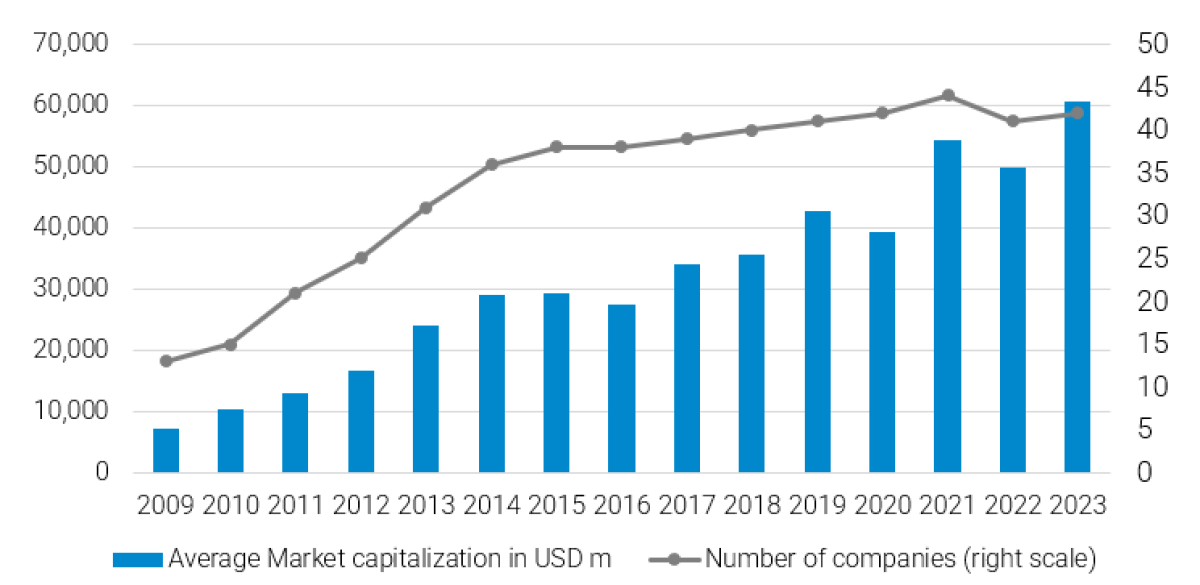
The aggregate market capitalization of the companies amounts to USD 60.64 billion as of January 1, 2024. Figure 5 shows the historical development of the market capitalization and the number of companies at the end of each calendar year. The universe was traced back to 2009. It turns out that the liquid part of the private credit asset class has a comparatively short history. This means that, investors have been able to invest in a sufficiently diversified portfolio of listed private credit companies for only a few years now.
Figure 5 – Number of listed private credit companies & aggregate market capitalization over time
This figure shows the number of listed private credit companies (right scale) at the end of each calendar year and the aggregated evolution of the market in USD million (left scale). Source: LPX AG.
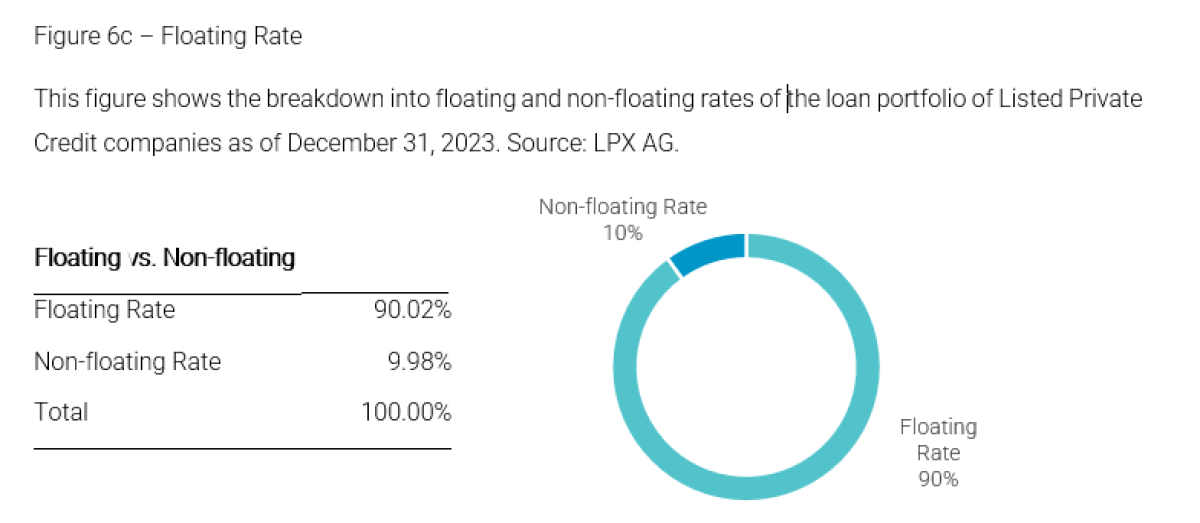
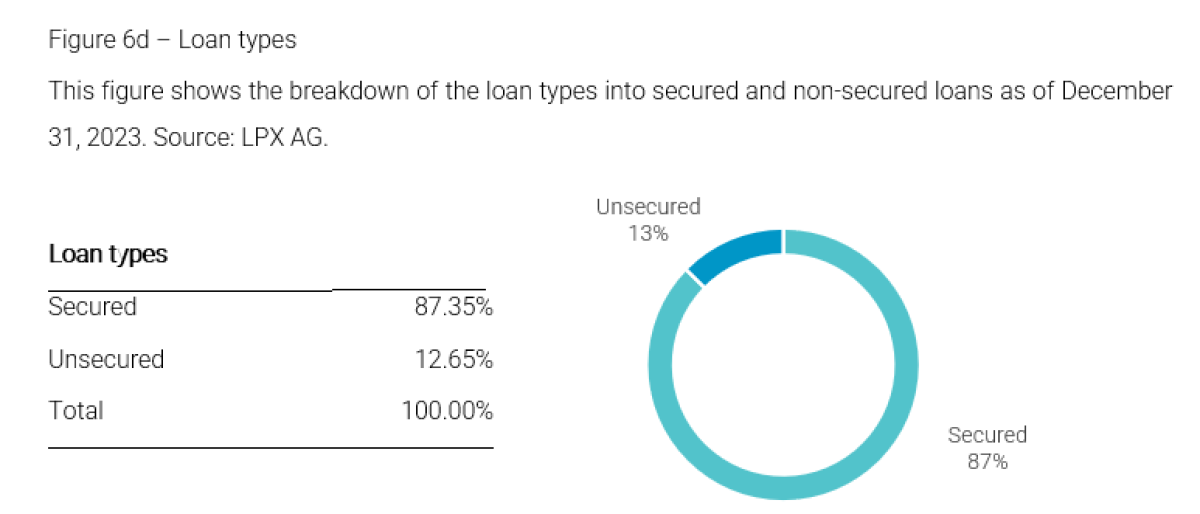
The underlying aggregated loan portfolio of the 42 listed private credit companies as of January 1, 2024, comprises a total of 5’486 borrowers with an aggregate credit volume of USD 139 billion (at fair value). The sectoral breakdown of the loan portfolio includes the entire range of sectors and subsectors. Overall, the identified universe of listed private credit companies provides access to a broadly diversified loan portfolio. Figure 6a shows the sectoral breakdown of the aggregate loan portfolio of the universe by industry sector. Figure 6b illustrates the collateral breakdown of the aggregated loan portfolio. Notably, over 83% of the aggregate portfolio consists of senior debt. Figure 6c shows the breakdown into floating and non-floating rates of the loan portfolio of Listed Private Credit companies. Figure 6d shows the breakdown of the loan types into secured and non-secured loans.
Figure 6a – Sectoral allocation of the loan portfolio This figure shows the allocation of the aggregated loan portfolio of Listed Private Credit companies[i] as of December 31, 2023 according to GICS (Global Industry Classification Standard). Source: LPX AG.
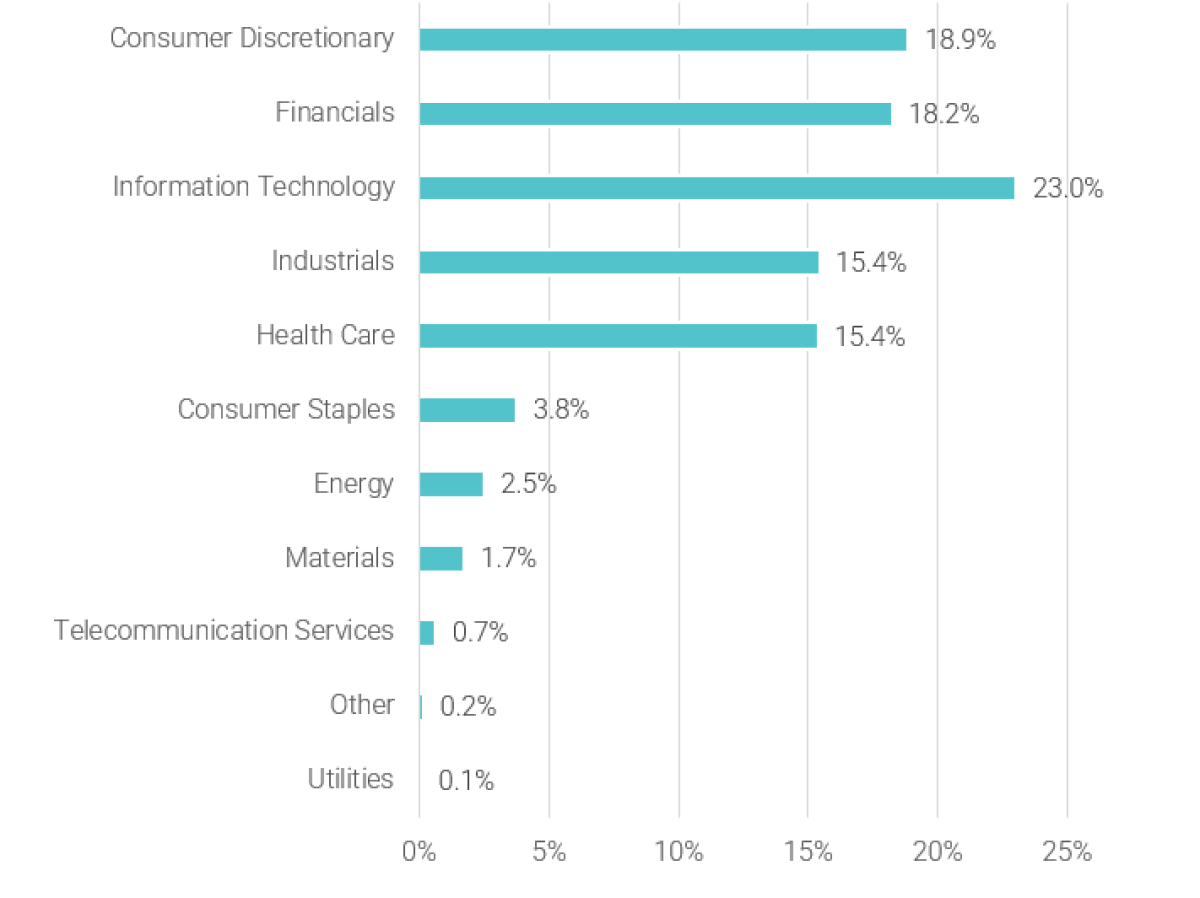
Figure 6b – Collateral allocation of the loan portfolio
This figure shows the collateral breakdown of the aggregated loan portfolio of Listed Private Credit companies as of December 31, 2023. Source: LPX AG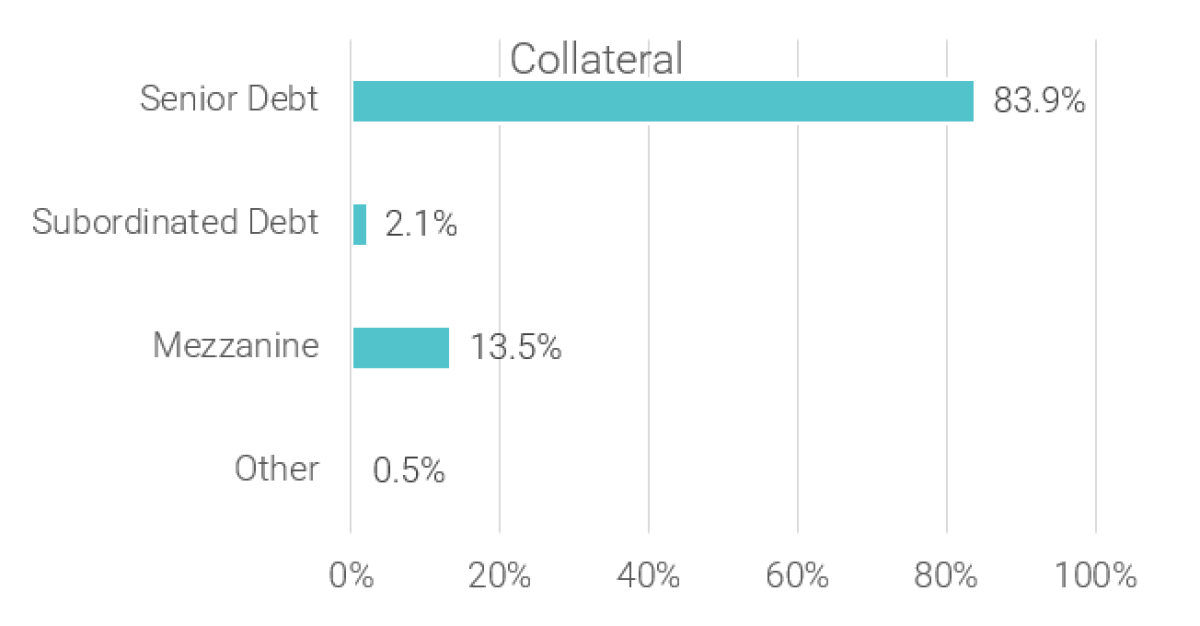
- I. Performance Characteristics
Historical annual dividend yields are depicted in Figure 7. As of December 31, 2023 the yield of Listed Private Credit was 10.31%. How does this compare to other credit indices? Figure 8b depicts the current yield for the Morningstar US Leveraged Loan Index (9.44%) and for the Bloomberg Barclays US Corporate High Yield Bond Index (7.59%), as of December 31, 2023. Figure 8a shows the yield development for the past seven years.
Figure 7 – Dividend yieldThis figure shows the indicative weighted average dividend yield (in percentage) of Listed Private Credit from 31.12.2009 to 31.12.2023. Source: LPX AG, Bloomberg, Dividend Indicated Yield - Gross (FLD: DV013).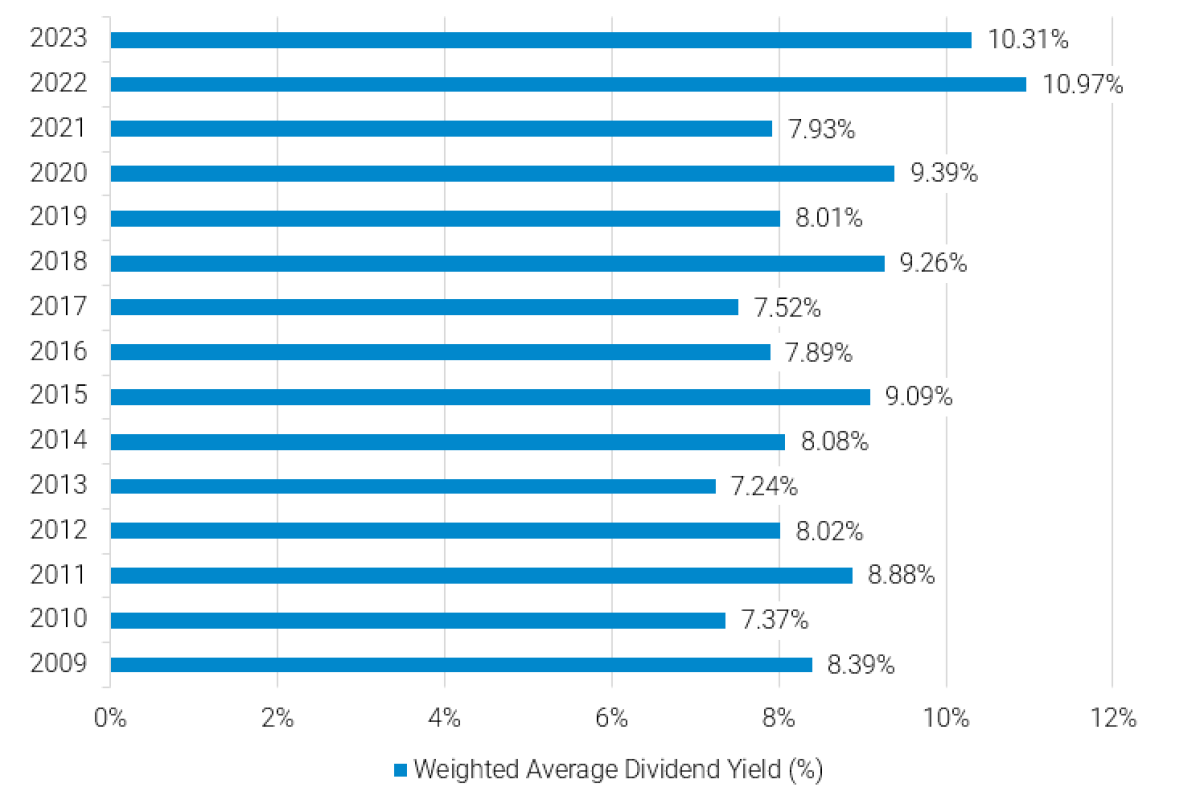
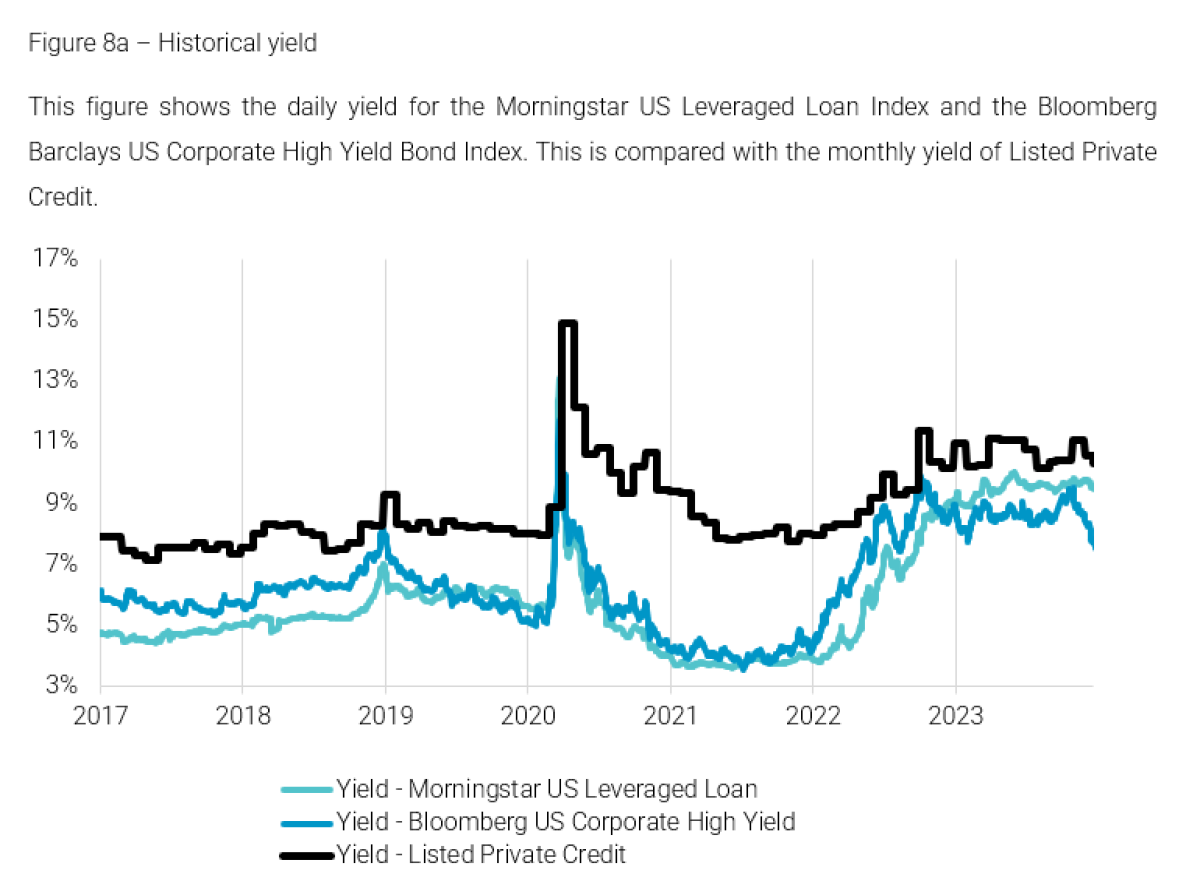
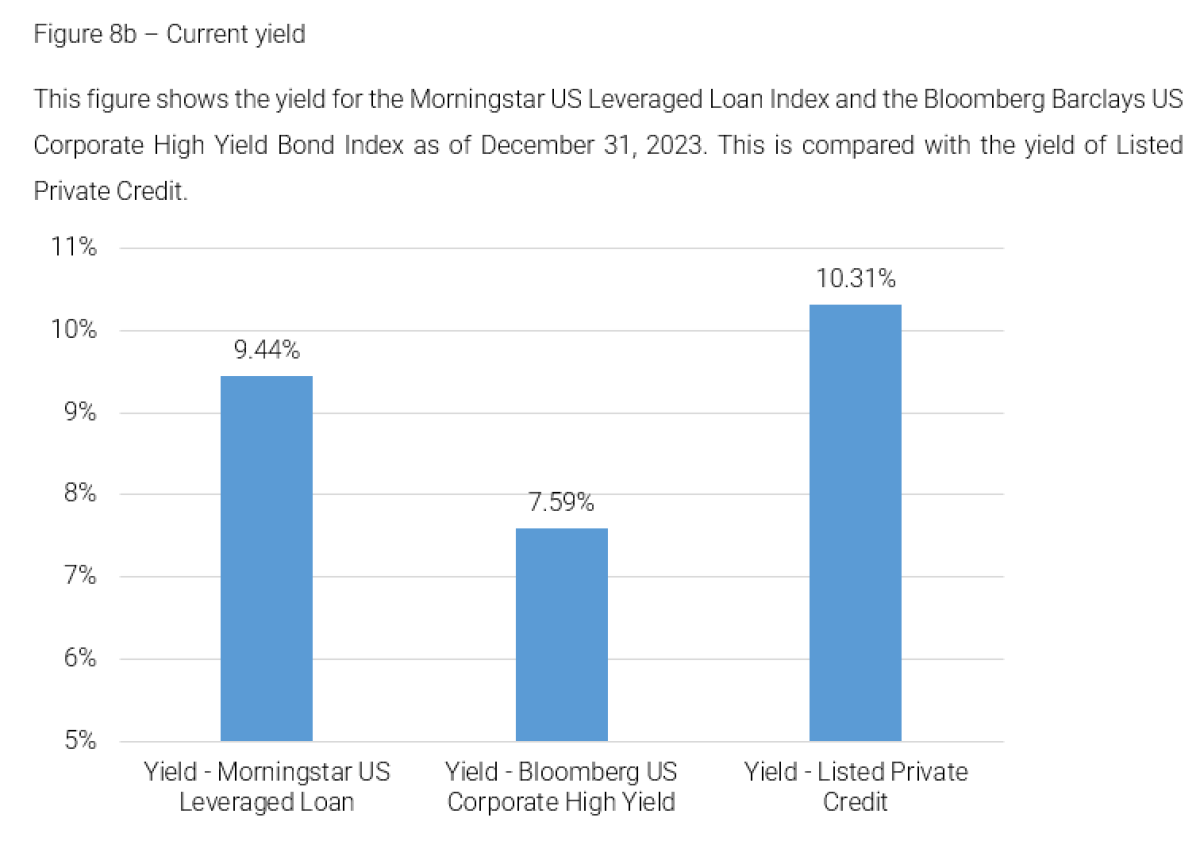
Figure 9 shows the performance of Listed Private Credit from December 31, 2009, to December 31, 2023. This includes dividend payments, which are invested assuming a withholding tax. In 2023, Listed Private Credit generated a return of 20.73%. Over the entire observation period, Listed Private Credit shows an annualized geometric mean return of 10.17% with a standard deviation of 18.62%. (see table 2).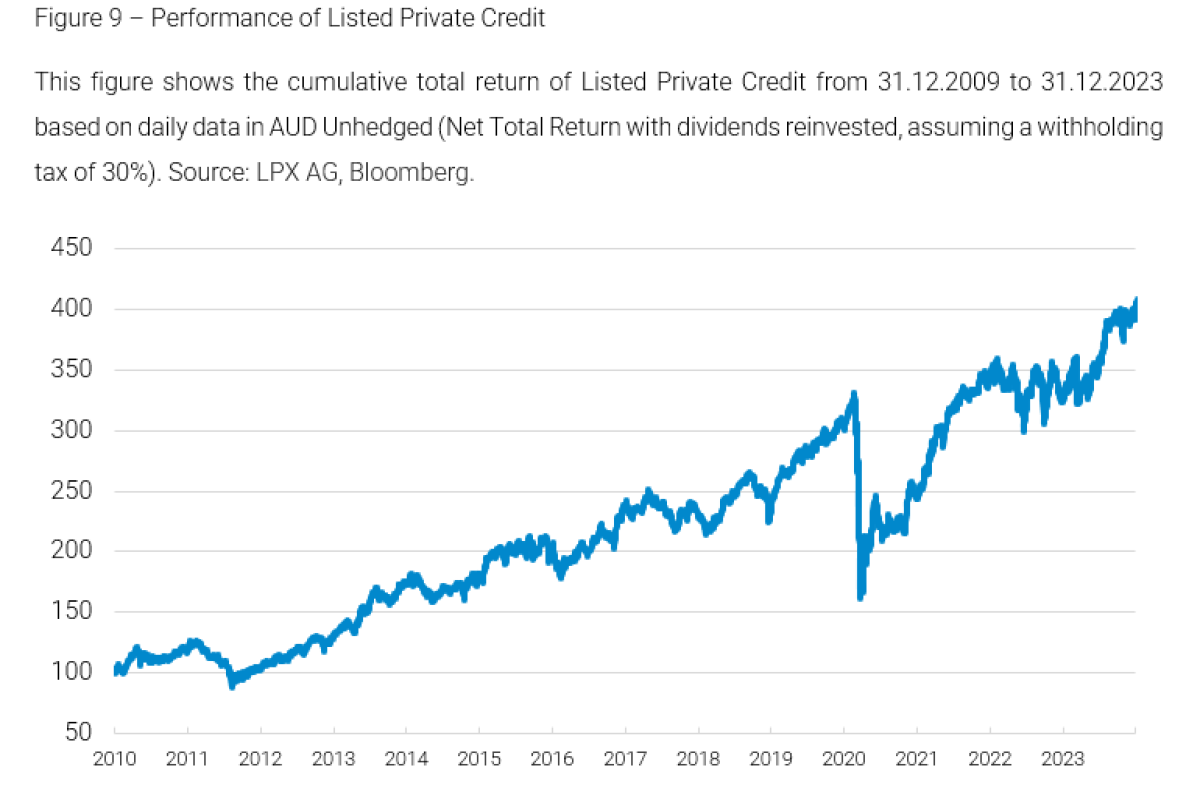
Private debt has been identified by investors as a separate asset class driven by attractive yields. As of December 31, 2023 the yield of Listed Private Credit was 10.31%. This compares to 9.44% for the Morningstar US Leveraged Loan Index and 7.59% for the Bloomberg Barclays US Corporate High Yield Bond Index. Private debt strategies delivered also attractive relative total returns in 2023, benefiting from floating-rate structures and diligent underwriting. While Listed Private Credit returned 20.73%[i], the Morningstar US Leveraged Loan Index increased by 13.06% and the Bloomberg US Corporate High Yield Index by 8.54% (performance number measured in AUD). The distortions over the past decades in the traditional lending business contributed to this dynamic. The fact that the duration is close to zero makes it a less risky investment opportunity compared to a traditional bond portfolio. The study shows the different organizational forms of the private credit asset class and focuses on listed private credit. Listed Private Credit companies have a comparatively high and stable dividend yield. It is higher than the yield of leverage loans or high yield corporate bonds. At the same time Listed Private Credit offers lower risk than high yield due to various factors, including higher governance and lower default risk. Against this background, the asset class appears to be particularly appealing to investors seeking liquid exposure to private credit investments.
Dr. Michel Degosciu is managing partner of LPX AG. He co-founded LPX in 2004 and is responsible for Business Development. Having been at the vanguard of alternative asset democratization since 2004, LPX AG offers representative benchmarks for the asset classes Private Equity, Infrastructure and Private Credit. It also offers research data based on in-depth research, to a broad array of financial institutions seeking liquid exposure to alternative asset classes.
Prior to LPX, Dr. Degosciu conducted various studies on the private equity asset class at the Department of Finance, University of Basel. He holds a master's degree with a major in Corporate Finance from WHU Otto Beisheim School of Management and a PhD from the University of Basel.