


By Phil Huber, CFA, CFP®, Head of Portfolio Solutions for Cliffwater, a leading alternative investment adviser and fund manager.
It is well documented that Internal Rate of Return (IRR) is a useful yet incomplete tool for measuring the performance of closed-end, drawdown funds in private markets.
The use of IRR becomes even less relevant when evaluating the performance of semi-liquid evergreen1 funds that invest in private markets, a category for which time-weighted returns (TWR) matter much more.
Understanding that IRR and TWR are like apples and oranges for comparative purposes, allocators need a framework to help bridge that gap as they increasingly adopt evergreen structures like tender-offer funds and interval funds.
Translating IRR and TWR assumptions into the common language of long-term net multiples on invested capital (MOIC) allows investors to better assess the expected long-term compounding potential of both evergreen funds and drawdown funds on a more level playing field.
- Our empirical analysis of net-of-fee cash flow data from private equity fund commitments supports the notion that for a given IRR, a comparable net MOIC can be achieved in an evergreen fund through a substantially lower TWR over a similar time horizon.
Private Equity Returns: A Fruit Basket of Acronyms
We’ve all heard the phrase "comparing apples and oranges" used metaphorically to describe the act of comparing two items that are fundamentally incompatible due to their inherent differences. While numerous fruit hybrids do exist, such as tangelos (a hybrid of tangerines and pomelos) and pluots (plums and apricots), sadly the elusive apple-orange amalgamation remains a botanical impossibility.
While the genetic crossbreeding of certain fruits may be out of reach, it doesn’t mean they can’t be enjoyed together – that’s why we have fruit salad! Our individual fruit preferences will depend on our unique taste buds, any allergy considerations, our appetite, the time of day, the setting, etc...
Performance measurement in private markets can be thought of similarly. While IRR has historically been the most popular metric, it has been supplemented over time by a veritable fruit basket of complementary acronyms. In addition to IRR and TWR, we also have MOIC, TVPI, DPI, and PME, among others. The allocator community has smartly recognized that there is no “one metric to rule them all” and that a mosaic of measurements can offer investors a more holistic picture to inform decision-making. Like our fruit analogy above, the utility – or lack thereof – of a particular metric will vary based on a host of variables: cash flow patterns, time horizon, investor activity, comparative analysis needs, valuation dependence, benchmark selection, reporting standards, portfolio composition, investment lifecycle stage, and investor objectives.
A deep dive into each of these metrics is beyond the scope of this paper2. Instead, we will focus our attention on the private investment industry’s favorite punching bag3: IRR.
Trouble with the IRR
The flaws in IRR are well-trod territory. Oaktree’s Howard Marks introduced the phrase “You can’t eat IRR”4as far back as 2006. So as not to belabor the issue, we will quickly review some of the major critiques of IRR as a performance metric:
• Cash Flow Manipulation: Fund managers may time distributions and delay capital calls (through subscription lines and credit facilities) to artificially inflate a fund's IRR, which does not necessarily reflect the underlying performance of the investments.
• Obfuscation of the Cost of Vintage Diversification5: Manager-reported IRRs do not account for any performance drag from an investor’s uncalled capital in the calculation of return.
• Investment Horizon Bias: IRR can favor investments with shorter durations over those that might result in greater absolute returns over a longer period. This can lead to a preference for quicker, smaller wins over potentially more lucrative, long-term investments.
• Limited Comparability Across Funds: Given its sensitivity to the timing of cash flows, comparing IRRs across funds can be misleading. A fund with a strategy of making early distributions might appear to have a higher IRR compared to a fund that focuses on long-term value creation.
• Unrealistic Reinvestment Assumptions: The assumption that interim cash flows can be reinvested at the fund's IRR is often impractical in the context of private equity, where reinvestment opportunities at equivalent rates are not always available.
Despite its imperfections, the rumors of IRR’s demise have been greatly exaggerated. As allocator Christopher Schelling notes6, “Maybe it can be misinterpreted, particularly early on in the life of a fund during what is referred to as the J-curve. Over short periods, IRR and compound returns can diverge significantly. And large early cash flows can create a very high IRR, but that doesn’t mean it’s false. Short-duration strategies with quick return of principal do earn high rates of return, and since they are lower risk, they will have a lower cash-on-cash return.”
Mind the Gap: An Update
So, if IRR is a useful but flawed way to measure private asset fund returns, can the metric itself be enhanced?
We think so.
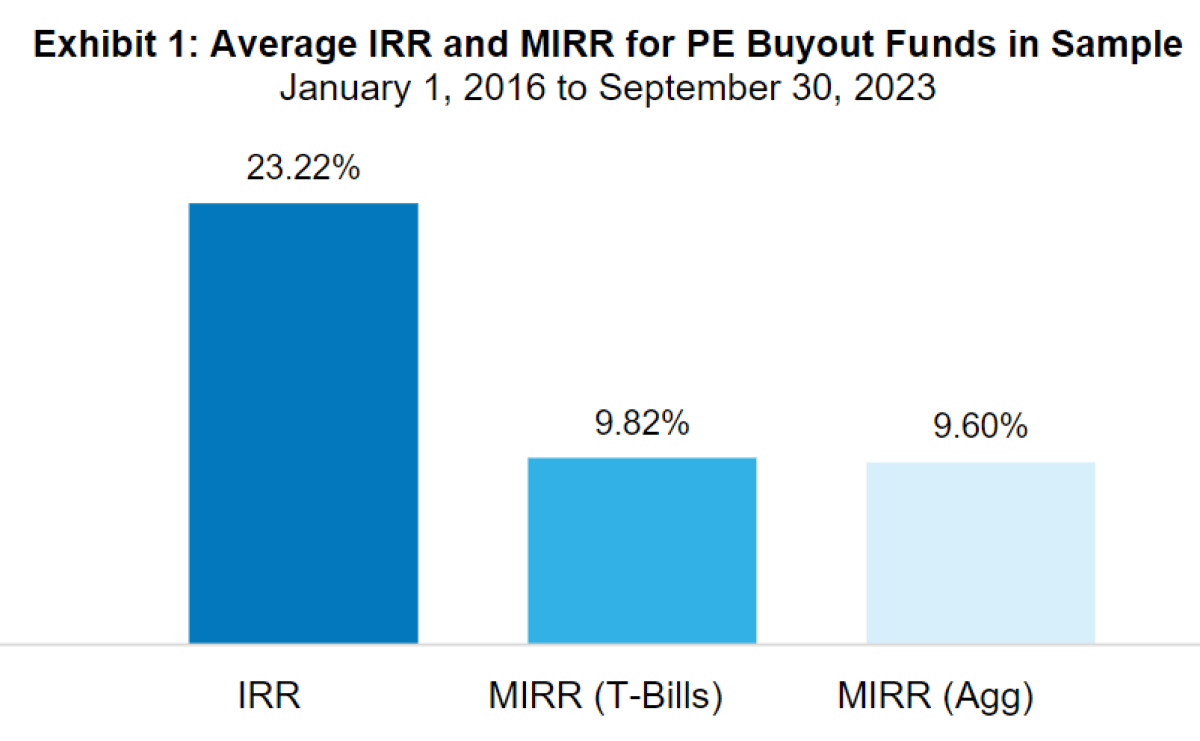
In 2021, Cliffwater authored a study7 seeking to answer that very question by measuring the performance gap between GP- reported IRRs and Modified IRRs (“MIRR”) that include “placeholder” assets, such as fixed income, that many investors use as a reserve for future capital calls. We found sizeable IRR gaps for both buyout and direct lending funds, demonstrating the importance of getting capital deployed faster and having fees levied on invested capital rather than committed capital. At that time, our rough estimate was that published buyout returns should be cut by one-half and direct lending returns should be cut by one-quarter to get a truer picture of actual investor returns.
We thought it was timely to revisit this study and update the data, using the same methodology and data set as the original paper8, to determine if our observations remained intact. For brevity purposes, we limited this update to private equity, where the gaps between GP-reported IRRs and MIRRs were wider.
Like our original study, we found that when uncalled capital is invested in either of the two cash alternatives, the GP-reported simple IRR is indeed significantly higher than MIRR, creating a measurable spread.
Investors can likely decrease the IRR/MIRR spread by investing uncalled capital in an index fund or ETF that more closely matches the return profile of the drawdown fund. In doing so, however, one will have to contend with the increased volatility that comes with the increased expected return. Downside volatility would potentially leave the investor short of the necessary liquidity or cash to fund capital calls, potentially putting the investor at risk of defaulting on their capital commitment or crystallizing unrealized losses as drawdown commitments are called. Anecdotally, we do not find such practices common, as defaulting on an LP commitment is a bright red line for investors in drawdown funds.
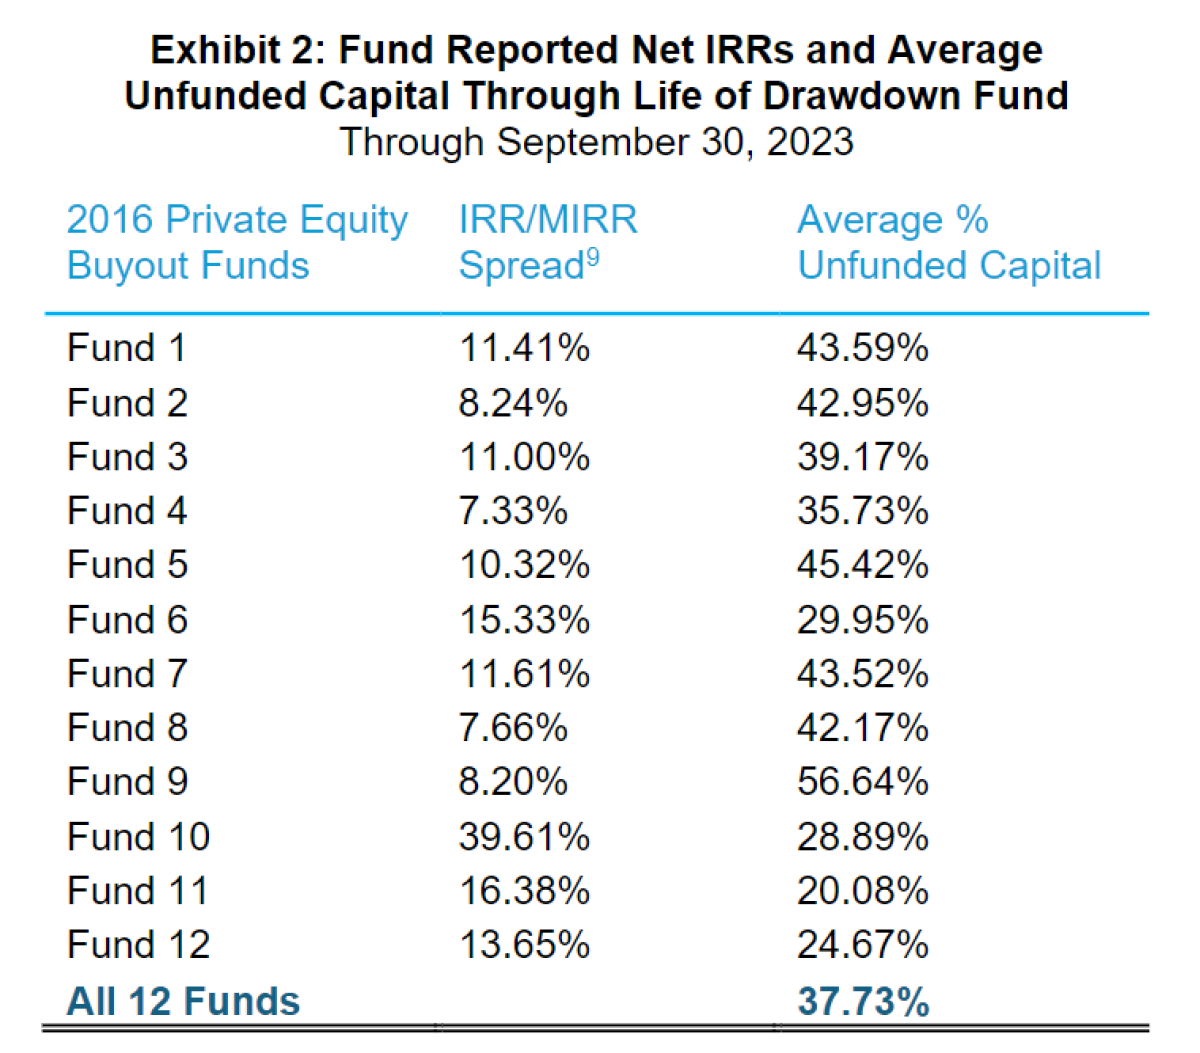
We observed further that the average percentage of unfunded capital for private equity buyout funds was 37.73% over the life of vehicles in our sample, a factor that likely exacerbates the IRR/MIRR spread.
While our study was focused on the various flavors of IRR – the lingua franca for the private equity community – we now turn our attention to time-weighted returns (TWR), the common vernacular for financial advisors and other investors who are accustomed to liquid (mutual fund/ETF) and semi-liquid (interval fund/tender fund) perpetual fund wrappers.
Chocolate and Peanut Butter
“Hey, you got your chocolate in my peanut butter!”
“You got your peanut butter on my chocolate!”
This iconic commercial, produced by vaunted New York ad agency Ogilvy & Mather, was released in 1981. The rest, as they say, is history.
Reese’s peanut butter cups would go on to become the top-selling candy brand in the United States, becoming synonymous with this beloved flavor pairing.
Ubiquitous as it is today, peanut butter and chocolate were not always considered an iconic duo. At least not until H.B. Reese came along with his eponymous confection in 1928. Still, it wasn’t until decades later that Reese’s peanut butter cups became the cultural staple they are today.
Why mention any of this? In the investing world, a similar melding of distinct ingredients is taking place to create products that appeal to a broader audience, offer unique benefits, and transform consumer behavior.
If it were a commercial, it might say:
“Hey, you got your private assets in my ’40 Act fund!”
“You got your ’40 Act fund on my private assets!”
The trend towards registered perpetual funds, particularly in the wealth management segment, is gaining momentum as evidenced by AUM growth for the various semi-liquid form factors. Investors are voting with their wallets, and the product landscape is evolving accordingly. Preqin estimated10 evergreen fund net asset value (NAV) to be at least $350 Billion at the end of 2023, spread across interval funds, tender offer funds, BDCs, and non-traded REITs.
Relative to closed-end, drawdown vehicles, several features of evergreen funds have resonated with investors:
• Immediate capital deployment: Investor dollars are exposed to a diversified portfolio on day one, versus managing unfunded commitments over a multi-year horizon in a drawdown structure.
• Broader access: Funds are typically available to Accredited Investors (AI) instead of the more stringent Qualified Purchaser (QP) requirements of private funds.
• Modest investment minimums: Bite-sized allocations at the end-investor level in the tens of thousands of dollars, if not even lower– a far cry from the millions often required to invest directly in private funds.
• Administrative ease: Less burden on the investor to manage capital calls and distributions; in some cases, ticker-symbol trade execution at the major custodians.
• Periodic liquidity: Funds offer regular subscription and redemption periods.
• Simplified tax reporting: Investors file Form 1099 rather than Schedule K-1, the standard for drawdown funds.
Despite the obvious operational and convenience benefits of evergreen funds, they are not without their critics. A healthy dose of skepticism is not necessarily a bad thing. As Cliffwater CEO Stephen Nesbitt points out in a recent interview with Private Debt Investor11:
“Perpetuals are not perfect. They do bring their own unique but manageable issues, including valuation and liability management. These imperfections are in my opinion far outweighed by the convenience, liquidity, diversification, and cost benefits of perpetuals, particularly those offered by experienced allocators.”
There is no right answer to fund structure – each allocator is different and will find what works best for them. Institutions are typically more equipped to meet the hurdles of programmatic drawdown/vintage fund investing, whereas wealth managers and individual investors are more likely to happily offload those burdens. While both approaches can be executed successfully – and unsuccessfully, what’s clear is that neither approach to private market investing is going anywhere. Thus, we need a framework to better compare the two on a level playing field.
Lost in Translation: Conflating Drawdown Fund IRRs with Evergreen Fund TWRs
The alphabet soup12 of private market fund performance measurement was challenging enough before perpetual funds entered the equation. Recognizing that comparing returns across different types of private funds was not a straightforward exercise, J.P. Morgan conducted an analysis13 that attempted to rectify these differences. Their solution to solve for the lack of comparability of TWR and IRR in evergreen and vintage funds, respectively, was to recommend that investors compare net multiples of invested capital (MOICs) over similar time horizons.
Their findings concluded that for a given IRR, a comparable net MOIC could be achieved in an evergreen fund through a lower TWR over a similar time horizon. This is due largely due to the more immediate deployment of capital, which results in being more fully invested for longer. The back-of-the-napkin conversion multiple they arrived at was that IRR ≈ 2 * TWR.
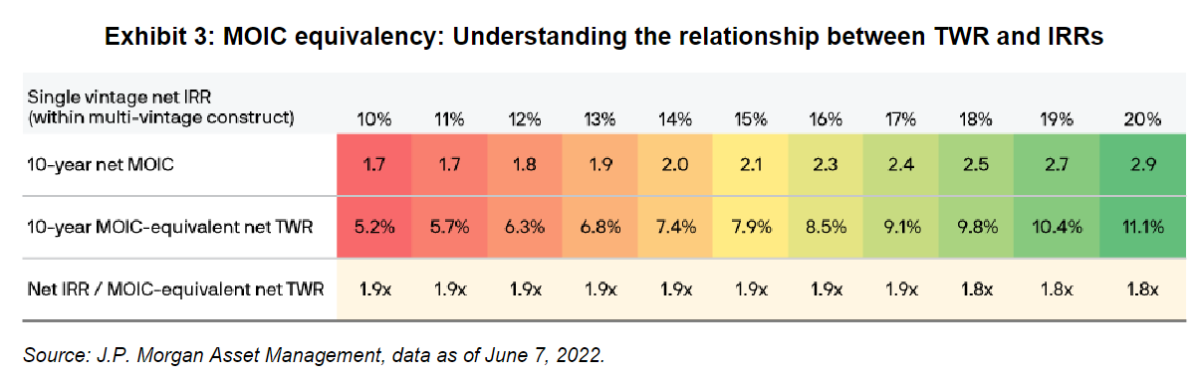
Separate hypothetical analyses from StepStone14 and Partners Group15 yielded similar results.
While the precise “ratios” of IRR to MOIC-equivalent TWR are highly sensitive to the assumptions used, directionally we agree they make intuitive sense. We sought to expand on these stylized hypothetical concepts empirically, using our proprietary database of real-world private equity fund allocations where we possess net-of-fee cash flow data.
We examined net-of-fee cash flow data for 30 discrete 2014 vintage private equity funds in the following categories: Large Buyout, Small/Mid Buyout, Growth Equity, and Venture Capital. We selected 2014 vintage funds for our sample to achieve a roughly 10-year history, in line with the other studies. Samples for vintage years 2015 and 2016 are included as well for reference purposes. It should also be noted that Total Value to Paid-In Capital (TVPI) and MOIC essentially converge with one another once a fund is fully-funded, and all capital calls have been met. Below is a table summarizing our results, highlighting the aggregate performance of our sample using the lifetime-to-date IRR, TWR, TVPI, and distributions to paid- in-capital (DPI) metrics through September 30, 2023.
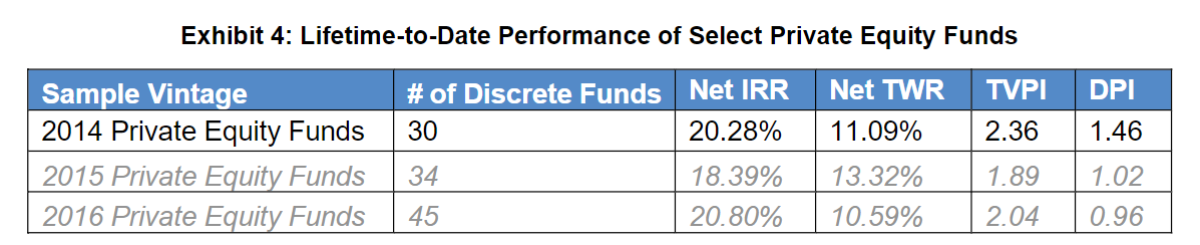
The numbers, while not a carbon copy of the “rules of thumb” published by our peers, are close enough to provide a degree of real-world validation. If anything, it supports the notion that MOIC/TVPI can offer a bridge for IRR and TWR, assuming a similar time horizon is used.
Closing Thoughts
Apples and oranges might not be compatible, but peanut butter and chocolate sure are. While IRR and TWR are not interchangeable, those differences can be reconciled and shouldn’t stand in the way of embracing the innovative pairing of private markets and perpetual funds.
All investment decisions are an exercise in managing tradeoffs – the asset classes we select, the managers we hire/fire, and the fund structures we implement with. For the last tradeoff, investors now have greater choice in how they fulfill their private markets allocations. No longer are they limited to the “traditional alternative16” of closed-end drawdown vehicles.
Investors should not ignore the shortcomings of the drawdown fund structure. Not only do they require more operational flexibility than their open-ended counterparts, but the calculation of returns can be highly misleading as we have shown. In contrast, perpetual structures - while not a panacea - eliminate the real-world burdens that can come with drawdown vehicles like vintage timing, high minimum investment thresholds, uninvested cash, and cash drag on performance.
Numerous asset managers have put forth studies that attempt to provide a ratio for investors to use when comparing drawdown fund IRRs and evergreen fund TWRs. While rules of thumb can be useful at times, we prefer to validate empirically when possible. Our net-of-fee cash flow-based data on private funds has produced confirmatory results.
Now that we have a baseline to reconcile IRR/TWR and better evaluate drawdown funds and evergreen funds side-by-side, investors are in a better position to answer the question: Is the juice worth the squeeze?
Footnotes:
1 The terms evergreen, perpetual, and semi-liquid are used interchangeably throughout the paper. Consider them one in the same.
2 See Appendix for a table that summarizes the key features and use cases of the most common private asset performance metrics.
3 “The Faulty Metric at the Center of Private Equity’s Value Proposition”, Institutional Investor ( September 11, 2019).
4 “You Can’t Eat IRR”, Oaktree Capital, July 12, 2006.
5 See Cliffwater research paper, “Vintage Voodoo (January 2024).”
6 “Dear IRR: It’s Not You, It’s Me.” Institutional Investor (October 21, 2020).
7 See Cliffwater research paper, “Mind the Gap! Published IRRs are out of reach for many investors (April 2021).”
8 We leverage our access to private, drawdown fund cash flow data to examine the differences between simple IRRs and modified
IRRs across a randomized sample of twelve 2016 vintage private equity buyout funds. We chose 2016 vintage year funds for
sufficiency of both number of private fund vehicles and variability of cash flow (both called capital and distributed capital). We
surmise that the results would look similar had we chosen 2014, 2015, or other seasoned vintages. We assume that uncalled capital
(i.e., when capital is not invested with the manager) is invested in either 3-month T-bills or the iShares U.S. Aggregate Bond ETF
(ticker: AGG).
9 Using 3-mo T-Bills
10 “Evergreen capital funds hit record high at $350bn on private wealth demand” Preqin (February 22, 2024).
11 “Perpetual fund structures are here to stay” Private Debt Investor (March 2024).
12 Last food reference, I promise.
13 “Alternative asset returns” J.P. Morgan (July 2022).
14 “Evergreen vs. Traditional Closed-End Drawdown Structures” StepStone (October 2023).
15 “Evergreen funds: the next frontier for private markets investors?” Partners Group (February 2022).
As both a wealth management practitioner and an investment-industry thought leader, Phil Huber, CFA, CFP®, is uniquely qualified in helping investors design, implement, and stick with evidence-based portfolios built to fulfill long-term financial goals and objectives.
Phil is the Head of Portfolio Solutions for Cliffwater, a leading alternative investment adviser and fund manager. Prior to joining Cliffwater in 2024, Phil was the Chief Investment Officer for Savant Wealth Management, a multi-billion dollar wealth management firm. Phil has been involved in the financial services industry since 2007. He earned a bachelor’s degree in finance from the Kelley School of Business at Indiana University. He is a member of the CFA Society of Chicago.
He is the author of The Allocator’s Edge: A Modern Guide to Alternative Investments and the Future of Diversification.
Phil has been featured by a number of media outlets, including The Wall Street Journal, The New York Times, InvestmentNews, CityWire RIA Magazine, and Bloomberg TV.
Phil and his wife Christie live in the northwest suburbs of Chicago where they enjoy reading, yoga, and spending time with their daughter Hannah. He is also a lifelong, die hard professional wrestling fan.
