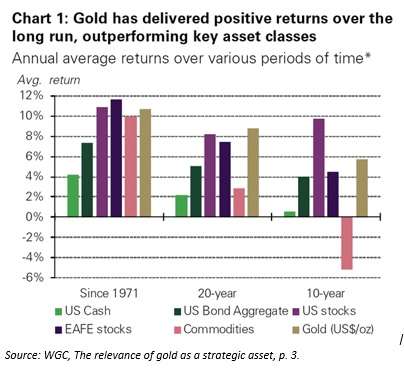
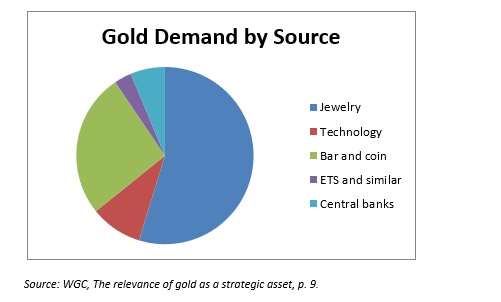
The World Gold Council has recently posted its analysis of the continued relevance of gold. As one might expect from the source, the WGC finds that gold is a strategic asset that can play several valuable roles in a portfolio. Toward this end, the paper offers a chart of gold’s returns over three distinct time horizons: 10 year, 20 year, and since 1971. The last of those periods, then (I’ll spare you the arithmetic) is 47 years. It is significant because 1971 is the year that President Richard Nixon pulled the United States out of the Bretton Woods system created by the victors in World War II. Since 1971, the dollar has been free to float as against the value of gold and by virtue of logical equivalence the value of gold has been free to float against the U.S. dollar. So this is the longest continuous time horizon available. Looking at the whole period since 1971, then, gold has been the third best performing asset, coming in just below US and EAFE equities, just ahead of commodities, and well ahead of both US bond aggregates and US cash.  This means, says WGC, that “gold has not just preserved capital,” but has helped capital grow. It has consistently outpaced inflation. Gold-backed ETFs were first launched in 2003. They have become important market participants, amassing more than 2,000 tons of the precious stuff, worth nearly $100 billion. Central banks have been net buyers for the last eight years. Diversification that Works But it isn’t merely standalone performance that recommends gold, the WGC says. It is golds stature as an example of “diversification that works.” When correlations among all other asset classes are rising, gold remains aloof from the pack. Panics that send people away from everything else (thus increasing correlations) send them toward gold. During the 2008-09 crisis, for example, “hedge funds, broad commodities and real estate, long deemed portfolio diversifiers, sold off alongside stocks and other risk assets.” That was not, though, true of gold. Gold investors benefit from the fact that gold is both deep and liquid. By the WGC’s estimates, “physical gold holdings by investors and central banks are worth approximately US$2.9 trillion, with an additional US$400 billion” as open interest via the gold derivatives markets. That is depth. The range of the parties who demand gold accounts for its value as diversification. Gold is bought to make jewelry, or for technology (that is, as a component in high-end electronics). It can be bought in bar or coin form, through an ETF or similar vehicle, or by central banks. The pie graph for those pieces of the demand for gold look like this: jewelry represents more than half; the rest of the pie is split up in a not particularly intuitive way.
  Separately, gold is a very liquid market. Combining the figures for spot and derivatives OTC markets, one gets gold transactions per day of between US$150 billion and US$220 billion. Gold futures trade another dozens of billions more per day, and gold-backed ETFs add more liquidity still to the over-all picture. The average daily trading volume in gold, as measured in US dollars, exceeds the trading volume of all the stocks in the S&P 500. It also exceeds the volume of the euro-yen trade or UK gilts. Not Like Other Commodities Some other commodities also have depth, and some have liquidity, too. But gold is not just another commodity, the WGC says. Unlike many other commodities, it is not consumed. It’s an element, so there is as much gold on or in the planet now as there was a thousand or a million years ago (unless, perhaps, a small amount was contained in the artefacts left on the moon in the Apollo era). Also, unlike many commodities, gold mining is spread out evenly around the world, so that political instabilities in one particular region don’t create supply shocks. “From an empirical perspective,” the study concludes, “including a distinct allocation to gold has improved the performance of portfolios with passive commodity exposures.”


