

A new paper by Claus Huber, of Rodex Risk Advisers, looks at machine learning for risk analysis, working especially from the “self-organizing maps” associated with Finnish Professor Teuvo Kohonen.
A SOM is a low-dimensional representation of input space (thinking of it as two dimensional makes the “map” analogy intuitive, and as we shall see the SOM at issue is two dimensional). Kohonen maps use a neighborhood function to preserve the topological properties of the space. In plainer language, the data forms itself into clusters, and these clusters represent otherwise non-obvious logical connections.
The SOM isn’t new: Kohonen's key publication on the subject, an article in Biological Cybernetics, appeared in 1982. Further, Huber isn’t the first to apply the idea to the hedge fund space. What he has done, though, is develop a new SOM specifically designed for manager selection, using a method he calls SOM_REMOTE.
SOM_REMOTE develops as a 5x5 grid of managers. The focus, in manager selection, is on the corners of the grid. So, the investor can select three managers from each of the four corners, producing a portfolio of 12 hedge funds with high diversification based on their return profiles.
An Experiment
For a simulation experiment Huber matched a portfolio selected in this way against what he calls Portfolio Free (a random selection of 12 from the corresponding vintage year) and Portfolio Style (a selection of one of each of 12 different investment styles, accepting the managers’ word for what their own style is). “The styles, like long/short equity, event driven, or short-term trading, are taken from Barclay Hedge,” Huber says, “There are 80 styles in the database. All managers are categorised according to one of those self-declared styles.”
The point is that the position of managers in the SOM, with dimensions based on performance characteristics, may be said to discriminate among styles better than the self declaration of the managers.
The simulation pitted SOM_REMOTE not only against Free and Style but against the Barclay Hedge Fund universe and the Standard & Poor’s Total Return Index (SPXTR).
What may interest those who argue against active management in general, in favor of passive indexing, is this: the SPXTR wins the race It beat all four of the tested portfolios over the period 2007 - 14 as to mean return. This of course was a period that began with the earlier stages of the subprime crisis, a year before it became the global financial crisis, and takes us through most of the recovery years.
But among the four portfolios with active managers, the winner is: SOM_REMOTE.
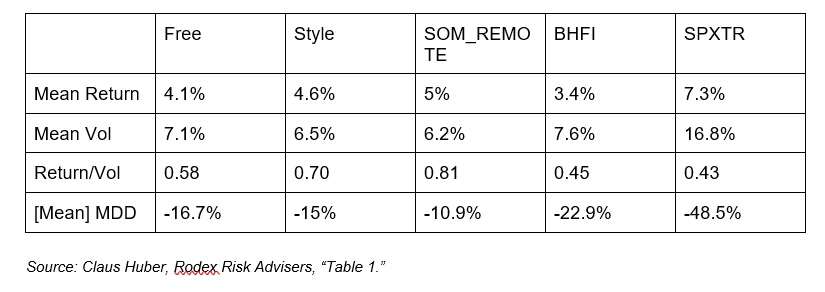
That higher return for SPXTR, not incidentally, isn’t free. It comes with the highest mean volatility in the test, and the highest maximum drawdown.
SOM_REMOTE, on the other hand, has the lowest MDD in the simulation, and the lowest vol.
Risk Management
Another potential use of SOM is risk analysis. As Huber observes, the grid layout itself makes the return profiles of hedge funds transparent and allows for a check on whether “the self-declared style of one manager actually matches this style’s expected return structure.”
If a convertible arb manager ends up on the map in a cluster with trend followers, then (Huber says) investors could “ask a few questions.”
Style drift can bring about a discrepancy. Huber observes that two distinct SOMs can be “trained on two non-overlapping different periods, for example, a) 2015 to 2016 and b) 2017 to 2018.” If the convertible arb manager can be found: (a) close to other convertible arb managers and on SOM (b) closer to equity strategies, “this might be a hint that this manager has taken more equity risk than his peers.”
Similarly, a “trained SOM could visualize which instruments, like derivatives or hedge funds, behave similar to the benchmarks.”