By Nicolas Rabener of FactorResearch (@FactorResearch)
INTRODUCTION
When pitching an investment product with a backtested history the frequent response from potential investors is that they have never seen a bad backtest. Naturally this is true as there is no point in marketing a strategy with a poor backtest as investors have zero interest in losing money. They also tend to chase performance.
However, it is somewhat challenging to respond to the criticism for the quant that ran the backtest. Most quants have a scientific education and are unlikely to champion discretionary investing. Especially given that most active fund managers have failed to beat their benchmarks over the short-, medium- and long-term as highlighted by the S&P SPIVA Scorecards.
Backtesting should be regarded critivally, although it also depends on the type of backtesting. The more complex and innovative a strategy is, the more skeptical a potential investor should be. Theoretical returns of statistical arbitrage in Indonesian stocks are less likely to be replicated in reality than those of a Value strategy in the US.
The returns of plain-vanilla quantitative strategies as seen in factor investing literature should be achievable. In this short research note, we will contrast publicly available factor investing data and investigate if investors were able to capture theoretical returns.
THE DARK SIDE OF BACKTESTING
Suhonen, Lennkh, and Perez analyzed the backtested and live excess returns of 215 quantitative strategies issued by fifteen investment banks between 2005 and 2015. The universe includes strategies from equities, fixed income, currencies, commodities, and multi-assets. The research paper shows a significant difference between the in-sample and out-of-sample performance.
Naturally some strategies are expected to generate worse returns than during backtesting as no strategy performs consistently. However, all strategies generate significantly lower returns once live, which highlights that the strategies are either the result of data mining or are impacted more negatively by transaction and market impact costs than expected by the investment banks.
The difference between backtested and live performance was greatest for equity strategies, which perhaps highlights the intricacy of dealing with thousands of individual stocks versus only a few commodities or currencies. The researchers conclude that all backtested returns require a discount, which should be proportional to the complexity of a strategy.
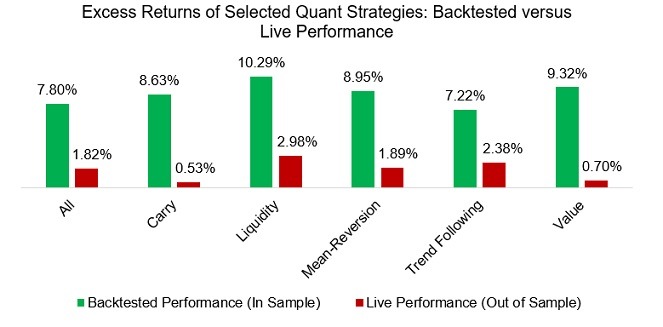
Source: Suhonen, Lennkh, and Perez, “Quantifying Backtest Overfitting in Alternative Beta Strategies”, Journal of Portfolio Management, 2017.
COMPARING FACTOR INVESTING RETURN DATA
The amount of factor investing literature continues to grow and a substantial part of that is based on the publicly available factor returns from the Kenneth R. French data library. The data is not only used for highlighting positive excess returns from common equity factors like value or momentum when marketing investment products, but also for explaining the returns of active managers via factor exposure analysis.
However, the data can be challenged as it includes microcaps that are not tradable by large institutional investors and excludes transaction costs. As a case study, we take the long-short value factor in the US stock market, which is defined as buying cheap and selling expensive stocks, and contrast the Fama-French data with two different data sources. AQR, a large US quantitative asset manager, also provides free factor data on its website, and FactorResearch calculates its own indices.
We observe that the long-short value factor shows identical trends across the three datasets from 1991 to 2018, although the total returns differ significantly. There are multiple reasons that explain the difference in performance:
- Data source: The universe of stocks and data quality depend on the provider of price and fundamental data, which might be CRSP, Bloomberg, Factset or S&P Capital IQ
- Market cap constraints: Fama-French and AQR have no market cap restrictions while FactorResearch excludes all stocks with a market cap below $1 billion
- Value definition: Fama-French and AQR define Value via price-to-book while FactorResearch uses a combination of price-to-book and price-to-earnings multiples
- Transaction costs: Fama-French and AQR assume zero transaction costs while FactorResearch includes 10 basis points per transaction
- Portfolio construction: Rebalancing frequency, dollar versus beta-neutrality, time lags for fundamental data, and portfolio size are further points of differentiation
We harmonized the volatility of the three factor indices given the differences in factor construction, in order to make them more comparable. It is somewhat surprising that the trends in performance were not more heterogeneous. The robustness of factor performance is an attractive feature from a backtesting perspective.
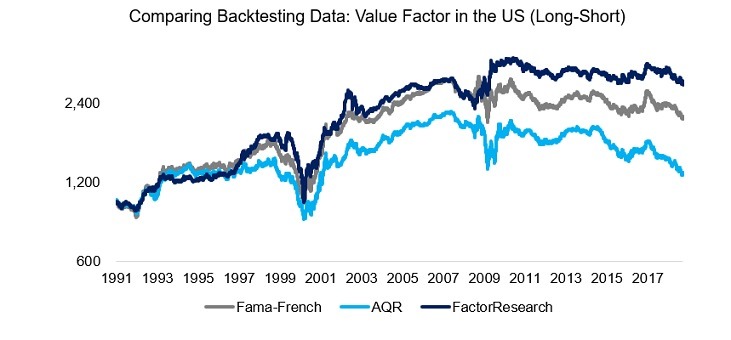
Source: Kenneth R. French Data Library, AQR, FactorResearch
As a second case study for comparing backtesting data we analyze the Momentum factor, which is defined as buying the best and selling the worst performing stocks as measured over the last 12 months, excluding the most recent month. We observe that the Fama-French and AQR data show an almost identical performance, in contrast to a lower total return from FactorResearch.
The two primary reasons for the lower return of the Momentum factor as calculated by FactorResearch are likely the market cap constraints and transaction costs, which are excluded by Fama-French and AQR. The Momentum factor is characterized by a high portfolio turnover and transaction costs have a significantly negative impact on performance.
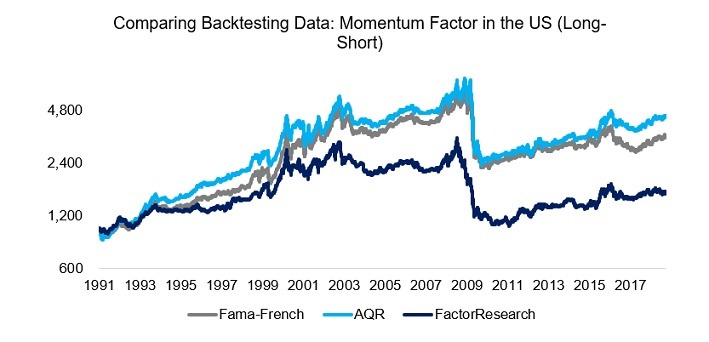
Source: Kenneth R. French Data Library, AQR, FactorResearch
FACTOR INVESTING: THEORY VS. REALITY
Given the large difference between the backtested and live performance of quantitative strategies, investors should be critical of literature highlighting attractive returns from factor investing. Fortunately, asset managers have launched products in recent years that provide long-short factor exposure and empower investor to efficiently compare theoretical versus realized returns.
We can use AQR’s Equity Market Neutral Fund (QMNIX), which was launched as a liquid alternative mutual fund in 2014, to contrast backtested and live returns. The fund provides exposure to three factors namely value, momentum, and quality via a globally diversified, beta-neutral, long-short portfolio of equities.
AQR is highly transparent about factor and portfolio construction that make it relatively easy to replicate the fund. We observe that the fund closely tracked the performance of a theoretical multi-factor portfolio, which was created by sorting for the value, momentum, and quality factors via the intersectional model. These results indicate that the excess returns seen in factor investing literature can be achieved in reality.
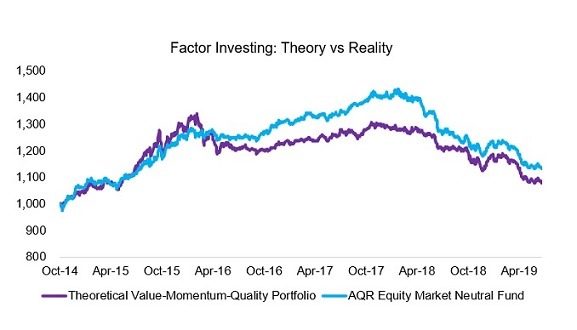
Source: AQR, FactorResearch
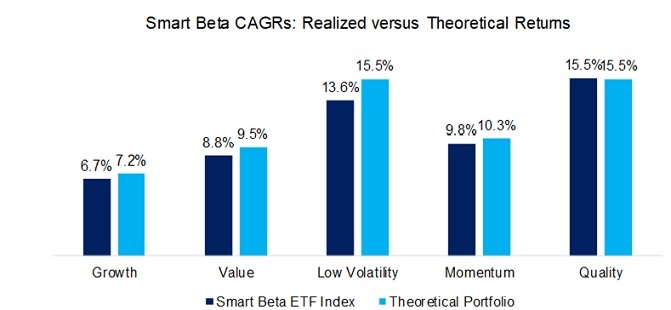
We can also compare the realized returns of smart beta ETFs to their theoretical returns, which highlight that ETFs had lower returns than the theoretical benchmark portfolios, but that can partially be explained by the lack of management fees for the theoretical portfolios. Broadly speaking smart beta ETFs are generating performance similar to the theoretical portfolios, i.e. are in line with investors’ expectations.
Source: FactorResearch
FURTHER THOUGHTS
The good news is that returns seen in factor investing literature can be harvested by investors via liquid alternative mutual funds or smart beta ETFs. The bad news is that factor investing has not been attractive in the recent years. A classic multi-factor portfolio in US generated negative excess returns that accumulate to a drawdown of almost 15% since the beginning of 2018. It would be easy to blame backtesting for the poor performance, but the reasons lie elsewhere.
RELATED RESEARCH
REFERENCED RESEARCH
Quantifying Backtest Overfitting in Alternative Beta Strategies


