A new paper from Loomis Sayles, a subsidiary of Natixis Global Asset Management, discusses the data, and the sort of data, that may tell investors and traders what are the likely effects of the COVID-19 pandemic, in however many mutations there may be.
A familiar metaphor in such discussions is the use of a rearview mirror while driving. The rear view gives a driver valuable information on what is gaining on him, but it does not tell the driver what is ahead. It has limited value as a predictor.
In less metaphorical terms. Loomis Sayles’ Harish Sundaresh writes, “macroeconomic data alone isn’t a prescient guide because it is lagged.” One can certainly learn from commonly available macroeconomic data that the crude oil (and refined gasoline) industry has been taking a beating of late. Saudi Arabia and Russia competed with each other earlier this year to push crude oil out into the markets at cheap prices, and then governments declared lock-downs, so highways emptied and the gasoline went unconsumed. With storage facilities full, the value of the May 2020 oil contract went negative on April 20.
All of this, though, is in that rearview mirror. No trees rise to the sky, no drills reach the center of the earth. There is always a reversal. This is true not only of the business of getting crude refined and getting it into cars, it is true of those businesses that may represent the directions of many of those cars: hotels, restaurant chains, and so forth.
Eyes Forward
What sorts of data or models might constitute the financial analog of looking through the windshield at the road ahead?
If we’re interested in the effects of the COVID-19 outbreak in particular, we can start where the virus did, in Wuhan, China. More generally, those interested in the US markets can and should track developments in countries that went through stages of this pandemic ahead of the US.
Wuhan spent the first week of April in a lockdown. People there have since been getting back to their pre-lockdown lives. Traffic patterns have returned in the manner one would expect: peaks in the morning and the late afternoon commuting hours. Still, the traffic congestion remains well below where it was in 2019. There has been no instant bounce such as one would expect for a ”V curve” to happen.
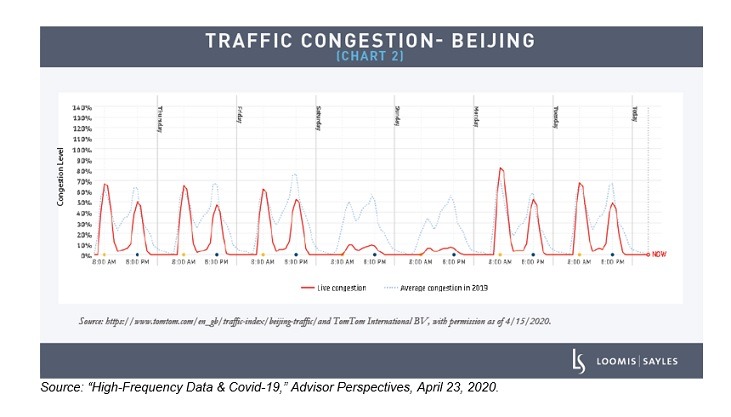
What about Beijing? There, too, restrictions have been lifted and there is some back-to-normal effect. But this point stands out from the chart Sundaresh presents: there is still no traffic in Beijing on weekends.

Last year, there was traffic in the capital all through the week. Now, there is back-to-normal traffic for five days then … flatlines for two. As Sundaresh puts it, people are not yet comfortable “stepping out for non-essential activities.” That does not “bode well” for businesses that sell entertainment or leisure activities. They are “likely to feel pain for a long time.”
If Not a V, Then What?
It seems very likely that New York City—a center for tourism and entertainment as well as for the ravages of COVID-19—will experience much the same phenomenon. When people do get back to work, the streets will be full again on the weekdays, yet there will be at the least some lag in getting the city back to its old weekend exuberance. And that will have consequences for industries sector-by-sector. There may well have to be a vaccine in widespread use before people feel enough confidence for that.
Sundaresh concludes that when the worst of the pandemics ravages do pass in the US and business picks up, alpha will go to those investors who make wise choices among sectors. “Systematic models and alternative data” will be key to the decision making of anyone who hopes and reasonably expects to stay ahead of the headlines, to keep eyes looking through the windshield rather than relying on that rearview mirror.
What about the petroleum industry? It has an obvious connection with real-time data on traffic congestion. Will it bounce back? Hedge fund managers have in recent days started to add to their long positions in that industry, which of course suggests that they believe it will. But the Loomis Sayles data suggests (only implicitly) that this will be a slow recovery: more a check mark or Nike swoosh than a V.


