


By Aswini Bajaj, CA, CS, CFA, FRM, CAIA, CIPM, CCRA, CIRA, CIIB, AIM & Team Leveraged Growth
Introduction
Since the mid-20th century, mankind has faced the problem of self-induced climate change which has caused ecological havoc and is now also impacting the economy.
The International Energy Agency (IEA) estimates that cumulative costs of approximately $50 trillion will be incurred through the end of 2035 to significantly lower CO2 emissions and meet the goals of the 2015 Paris Agreement.
As the world starts to acknowledge these problems, several green initiatives have been undertaken to tackle the issue from an economic perspective. In a capitalist society, we tend to recognize things only when there is an economic value attached to them. This has led to the creation of green bonds.
Definition
So, what are green bonds? A green bond is a fixed-income financial instrument like any other bond. However, these bonds are issued to raise financing for climate change solutions and are labeled as green by the issuer when they meet a certain benchmark. They can be issued by governments, banks, municipalities, or corporations in any debt format, such as private placement, securitization, and covered bonds.
Broad Categories of Green Bond Issuers
Each green bond issuer can be classified into one of three categories based on the revenue generated from the underlying climate-aligned assets and the business activities undertaken:
- Classic Green Bond Issuers: These include only those bond issuers who allocate at least 75% of the proceeds to green assets, are aligned with the Climate Bonds Taxonomy (the standards which are used to label a bond ‘Green’), and who provide sufficient information on the revenues used to finance these projects.
- Strongly Aligned Issuers: These include those bond issuers that derive 75%-95% of revenues from climate-aligned assets and green business lines.
- Fully Aligned Issuers: These include those bond issuers that derive over 95% of revenues from climate-aligned assets and green business lines.
Based on this categorization, the graph below represents the total amount of outstanding debt in the climate bond universe (despite the name, it includes all the three types: climate-aligned, fully aligned and stronglyaligned) over the years.
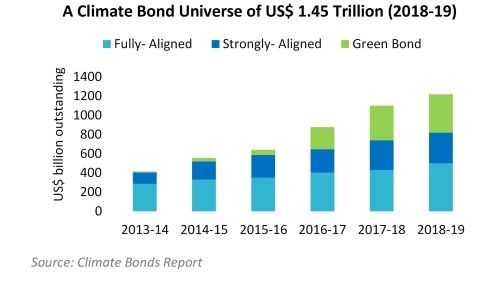
- 498 Classic Green Bond Issuers: These issuers account for $389 billion of outstanding bond volume, roughly translating to 32% of the climate-aligned bond universe. As a result of the record-breaking green bond issuance by China in 2017 to expand its green industry profile and a higher issuance in the UK and the US, there was a $72 billion increase in the total number of green bonds outstanding as compared to 2017.
- 82 Strongly Aligned Issuers: These account for $314 billion of outstanding bond volume, i.e., 26% of the climate-aligned bond universe. The outstanding debt of these issuers has been scaled down in proportion to the share of green revenues. Hence, if 80% of revenues are ‘green’, then 80% of their outstanding debt has been included.
- 342 Fully Aligned Issuers: These issuers account for $497 billion of outstanding bond volume. This represents 2,105 outstanding bonds issued between 2005 to the end of Q2 FY18. Fully aligned issuers account for 41% of the climate-aligned bond universe.
An increase in fully aligned and strongly aligned bond issuers indicates that there is enormous potential in the growth of the green bond market and to its commitment towards green projects. One can easily evaluate the market’s upside potential by considering the rising tensions of climate change, increasing sea levels, and global warming, all of which make green bonds crucial for a sustainable Earth.
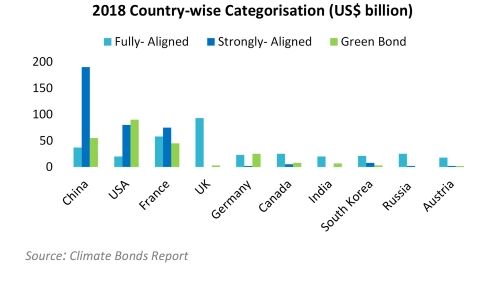
- Until 2017, the US, Chinese mainland, France, and the UK had been the primary issuers of green bonds. Today, however, China is the undisputed leader in global rankings of climate-aligned bonds, primarily due to high volumes in the strongly-aligned category. The fully aligned bonds’ volumes have been comparatively subdued due to higher regulatory standards and declarations required from the issuer.
- China has emerged as a key player in the sector because of the steps taken by the Chinese government. Their main aim is to achieve the long-term goal of becoming carbon-neutral in a relatively short period. This has attracted the attention of financial centers that are seeking to tap a growing However, there has been a drop in the proportion of bonds that are considered "green" in the local market, but not by foreign investors or the Climate Bonds Taxonomy. This has happened because China has allowed green bonds to be used to finance clean coal projects, which are excluded from other markets. This is a major concern for the investors since the fundamentals of green bonds are attached to the ‘Green Initiative’ underlying the issues.
- The UK has the highest volume of outstanding bonds from fully-aligned issuers, followed by France which reflects the higher liquidity of the bonds in these mature markets as compared to other emerging markets. The UK Government’s International Climate Fund (ICF), which increased from £3.87 billion to £5.8 billion from April 2016 to March 2020, has majorly contributed towards reducing the illiquidity risk associated with these bonds. Launched in 2011, the ICF supports low-carbon projects across diverse sectors and technologies, utilizes several financing mechanisms (including grants, loans, guarantees, and equity), and raises private sector investment at three levels: global, local, and project-centric. The support of the government and the application of clear standards has helped issuers in the UK to label these bonds as fully-aligned, providing confidence to the investors.
Global Green Bond Indices
A key challenge in constructing a green bond index is in setting specific, transparent, and objective rules to identify what investors generally define as ‘green’ (bonds whose proceeds have a clear net environmental benefit) and, therefore, consider part of their investment choice set.
Let’s understand the sector, green criteria, and credit quality of two of such indices –
Bloomberg Barclays MSCI Global Green Bond Index
This is a multi-currency benchmark that includes local currency debt markets tracked by the Barclays Global Aggregate Index.
Sector: Corporate, government-related, treasury, and securitized bonds
Credit Quality: Includes only Investment Grade (IG) bonds using the middle rating of Moody’s, S&P, and Fitch
Green Criteria: To be classified as a green bond, a security’s use of proceeds must first fall within at least one of six MSCI defined eligible environmental categories: alternative energy, energy efficiency, pollution prevention and control, sustainable water, green buildings, and climate adaptation
General-purpose bonds are eligible if 90% of the issuer’s activities (as measured by revenues) fall under one or more of the six eligible MSCI environmental categories. Furthermore, an eligible green bond’s prospectus or supporting documentation must clearly identify the specific criteria and process for determining eligible projects or investments.
S&P Green Bond Index and S&P Green Bond Select Index
The S&P Green Bond Index and the S&P Green Bond Select Index are also multi-currency benchmarks, wherein the former is market-value-weighted while the latter is modified market-value-weighted.
Sector: Corporate, government, and multilateral
Credit Quality: Must be rated by at least one agency (S&P, Moody’s, or Fitch), with minimums for IG and maximums for High Yield (HY)
Green Criteria: For a bond to be eligible, the issuer must clearly indicate the bond’s ‘green’ label and the rationale behind it, such as the intended use of proceeds
The above disclosure must be made in sources that are credible and related to the company. It may include the company’s website, sustainability report, legal disclosures, public filings, or independent second opinions.
Other Indices
Other important green bond indices to consider are –
- Solactive Green Bond Index
- ChinaBond China Green Bond Index
- ChinaBond China Green Bond Select Index
- BAML Green Bond Index
Does Index Level Performance Justify Greenium?
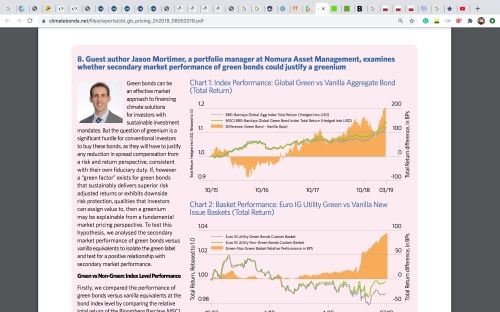
To answer the question, we compare the performance of green bonds versus vanilla equivalents at the bond index level, i.e. comparing the relative total return of the Bloomberg Barclays MSCI Global Green Bond versus the Bloomberg Barclays Global Aggregate Bond (USD hedged).
Both of these indices include IG bonds, denominated in USD or EUR, with a size >= $500 million, a minimum term to maturity of three years at issue, and features consistent with those laid down in the Climate Bonds Taxonomy.
Source: Climate Bonds Report
Since July 2016, the green bond index has consistently outperformed its non-green counterparts and the difference reached 201 basis points at the end of March 2019.
This data supports the view that green bonds have the potential to deliver superior risk-adjusted outperformance with additional qualities of downside risk protection over a short time horizon. This may be attributed to the "green factor" once the idiosyncratic variables are considered. The green factor, extended to all the issuers’ newly issued bonds, possibly implies that an issuer’s commitment to green bond issuance can itself be an indicator of superior sustainability and/or strategic governance. If true, we can postulate that the market may eventually come to justify some degree of greenium as a fundamental quality factor, like an ‘insurance premium’ with intrinsic value, thereby supporting the sustainable growth of the green bond market.
Although the index characteristics of the pair were generally comparable, the underlying issuers and other non-green factors (such as duration) varied greatly between indices and made a true comparison difficult over time.
Risk-Return Characteristics
Green Bond Ratings
Apart from the "green labels," these bonds are also differentiated in the segments of rating. These ratings are generally offered by ESG rating agencies or other business rating agencies.
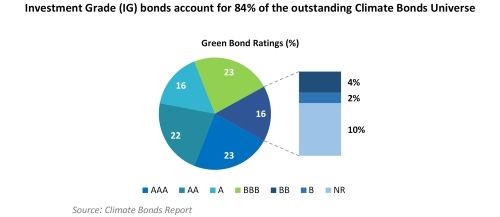
- Almost a quarter of the universe is AAA-rated by international and/or local credit rating agencies and 84% of the US$ 1.4 trillion climate bonds universe is investment grade
- Non-investment grade bonds make up only 5-6% and the remaining 10% are not rated
- Labeled green bonds have the most evenly distributed ratings with strongly-aligned issuers accounting for the largest proportion in the AAA rating class (63%) while bonds from fully-aligned issuers dominate the AA rating class (67%)
Government support plays a pivotal role in the high ratings of green bonds. Incentivizing big corporates with credit backing to undertake green projects at a lower cost of capital has given these bonds a major push, helping them earn a decent return on such greenfield projects.
Historical Performance of Green Bonds
To gain a better perspective, we will now benchmark the performance of the S&P Green Bond Index in relation to the S&P US Treasury Bond 7-10 Year Index, which represents a pure-play index of investment-grade bonds issued by the US Government.
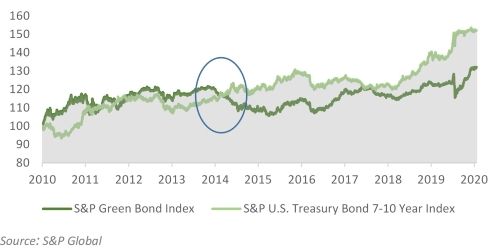
In the highlighted part above, we observe a reversal in the movement of the market price of green bonds as compared to treasury bonds in 2014. There are two reasons for the same –
- Fed Stimulus Program: From the fall of 2013, the Fed began its monthly bond purchases of $85 billion to push the economy by lowering the yields and by increasing the money supply in the markets. This was a very accommodative monetary policy stance after the bloodbath of 2008. The continuous demand from the Fed kept the yields in check and the bond prices high between 2013 and 2014.
- Exponential Increase in Green Bond Issues: Following a landmark green bond growth in 2013 due to the expansion of the green bond markets in China and the UK, the labeled green bond market once again experienced a year of incredible growth in 2014. By the end of 2014, the green bond market had almost tripled, wherein around $36.6 billion worth of green bonds were issued by 73 different issuers. This immense pressure from the supply side, accompanied by a lack of demand, subdued the price of green bonds as compared to T-Bonds.
Since then, the green bonds have been trading at a discount compared to U.S. Treasury bonds. On the other hand, studies of U.S. corporate and municipal bonds show that green bonds trade at a premium relative to non-green bonds. (Source: Enterprising Investor Blog, CFA Institute)
But what about the movement in the last one year when the governments of the world were battling a pandemic that tested the financial soundness of these instruments?
In the face of the COVID-19 pandemic, a major portion of the world has witnessed double-digit unemployment, cratering PMIs (Purchasing Managers' Index), unprecedented retail sales drops, and worse. With the increase in the number of coronavirus cases, the World Health Organization finally declared that the world was facing a pandemic on March 23, 2020. The aftermath was panic in the streets and resulted in a stock and bond market crash.
Some say that the bond market is "smarter" than the stock market. Bonds have been rallying hard this year, especially at the long end of the curve which is evident from the graph below.
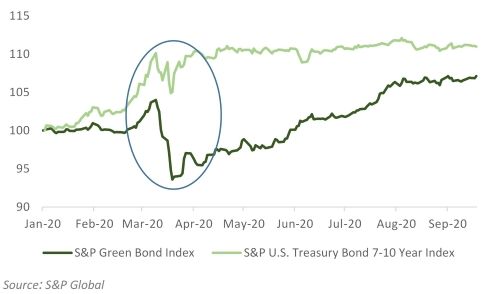
Bond markets saw a V-shaped recovery, and have consistently been on an upward trend since, with the S&P 7-10-year Treasury Bond ETF up over 9.6%. That's what happens when the Fed cuts rates to nothing – the world expects economic conditions to remain depressed for an extended period, further fueling the safe-haven bias and pressuring yields to the downside. While the pandemic should be deflationary due to supply shortages and falling demand, the amount of stimulus is more than putting the gas pedal on inflation. This is resulting in spiked yields.
However (and that’s a big however), green bonds have not seen a similar recovery in the last 6 months. Interestingly, if we look at the time interval between 14th February 2020 and 14th April 2020, we can analyze the sensitivity of green bond prices to the market crash.
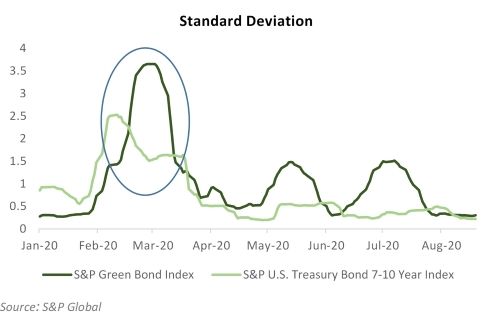
In the span of the two months highlighted above, the difference in the deviation in green bonds from the deviation in T-Bonds increased from an annual average of -0.191 to 0.422. This indicates a greater sensitivity of green bonds to the market crash of March 2020, likely due to the higher credit risk associated with green bonds.
Moreover, if we look at the correlation between asset classes, we will find that green bonds have a positive correlation of 0.304 with T-Bonds and 0.647 with the S&P 500. Hence, green bonds are affected more by movements in the stock market than treasury bonds due to the credit risk posed by these securities.
But what about the returns on green bonds?
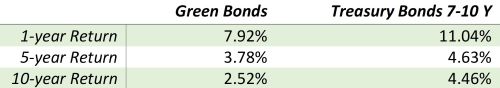
Green bonds have continuously underperformed treasury bonds in the last 10 years. These lower yields can be attributed to the long-term and strong demand for these bonds among green investors who are increasingly becoming enthusiastic about the ESG style of investing in this era of climate change. Hence, high demand has pushed prices higher and has further lowered yields (or the cost of raising debt) on these bonds.
The Future of Green Bonds
Green economies will need diverse issuers
While green bond issuance is accelerating quickly, a staggering $6.3 trillion is needed annually until 2030 to meet global climate goals, according to the OECD. Not all of this capital will come specifically from green bonds as other asset classes will have a role to play too. However, this sharp contrast implies that green bond issuance needs to grow exponentially within a few years.
Such substantial growth in green bonds will not occur if every issue follows the same structure or if every green bond originates from the same narrow group of issuers. Likewise, green bonds need to fund an abundant variety of innovative real-world investment opportunities which will not only attract the existing investors but will also generate new green investors.
Diversification cuts climate and investor risk
In the words of Harry Markowitz, “diversification is the only free lunch”. In the long struggle to save the planet, a free lunch should be taken willingly.
Diversification of all kinds of factors - from geography to technology or from investment strategy to new projects - is the best way to gain exposure to a wide range of successful opportunities.
Financial innovation necessary for better reach
Investors themselves are perhaps most vital to the growth of green bonds. Rapid understanding and uptake will depend on the right products and support being available. This brings a challenge to innovate and in being creative with new financial instruments. Customized and diverse portfolios are only possible when a sufficient choice of investment products is easily accessible, with an abundant variety of strategies.
Different kinds of investors will have particular preferences when considering green bond investments best-suited to their investment timeframe, risk appetite, and financial situations. Green bonds need to be studied and scrutinized by experts, then packaged into suitable, diversified, and accessible financial products.
There has been a particular interest in green bond ETFs for precisely this reason. Investors are drawn to a product that allows greater transparency, simplicity, more choice, control over the underlying investment, and lower fees – all the while channelling capital into vital projects supported by the underlying green bonds.
As investors are keen to follow the green bond trend, the financial community must provide a variety of products to tap investor enthusiasm.
Aswini Bajaj is a Commerce graduate from St. Xavier's College, Kolkata and is widely acclaimed as one of the leading finance trainers in India. He is a qualified CA, CS, CFA, FRM, CAIA, CIPM, CCRA, CIIB, CIRA and AIM. He has trained over 5000 professionals globally for CFA, FRM and Financial Modeling. He is a Guest Lecturer at various stock exchanges, B-schools and colleges across the country including NSE, BSE and IIMs & IITs. He also conducts training for corporates like Tata, Barclays, Volvo-Eicher, Grasim, GRSE, Quaker Chemicals, Genpact, etc. and has received the award for the Best Finance Trainer in India at the India Education Awards, 2019.
Today, at the age of just 29, he has been able to establish a global online presence. His YouTube channel has reached over 63k subscribers over a short span of time. He has been felicitated by numerous institutions for his speaker sessions and has moderated/judged several of their debates & management competitions.