

By Alex Botte, CFA, CAIA, Vice President at Two Sigma Advisers LLC.
One way market participants can improve their inflation forecasts is to analyze it from many perspectives, just as a data scientist would. Below, we use that approach to analyze both historical inflation and forward-looking U.S. inflation forecasts.
Inflation has been an important driver of macroeconomic markets recently and a hot topic of conversation among market participants. Governments and central banks around the world are deploying trillions of dollars worth of fiscal and monetary stimulus to battle the economic effects of COVID-19. This stimulus activity, combined with the gradual reopening of economies (that has created spikes in demand for goods and services), has piqued market participants’ focus on inflation. Some believe that the high inflation prints we’ve seen recently are transitory, while others think the price increases could persist for a longer period of time.
Unfortunately, both defining and measuring inflation accurately remain difficult. In this Street View, we’ll refresh a prior Street View from 2017 called Forecasting Inflation like a Data Scientist. We’ll summarize some of the challenges in forecasting inflation that we covered previously and provide a potential solution: analyzing inflation from many perspectives, just as a data scientist would.
Challenges of Forecasting Inflation
Data scientists often gather as much data as possible to extract new insights on the problem or question at hand. Taking a data-science approach to forecasting inflation then might involve combining many forecasts, perhaps with various conviction levels, to form one, consolidated view. While that might sound fairly straightforward (e.g., calculate the conviction-weighted average of many forecasts), it does come with several non-trivial challenges. This Street View will first summarize those challenges and then suggest ways to seek to mitigate some of their effects.
- Definition: One challenge is the definition of inflation itself, as there are many different types of inflation. For example, the U.S. Bureau of Labor Statistics publishes both the Consumer Price Index (CPI) and the Producer Price Index (PPI), which include different baskets of products and contain various subcategories (e.g., goods vs. services, core vs. non-core). Another metric is the Personal Consumption Expenditure (PCE) Index, which is a measure of actual and imputed household expenditures. It is published by the Bureau of Economic Analysis, is used by the U.S. Federal Reserve, and serves as a component of the U.S. GDP figure. PCE also has different versions (e.g., core PCE excludes food and energy prices to reduce volatility).
- Data proliferation: The increasing volume of data can present comparability issues. For example, it is critical to align the time stamps of prices of goods available online (which are frequently updating) with equivalent goods offered in brick-and-mortar stores (which are slower moving).
- Historical comparability: Product specifications and capabilities change over time, complicating the comparability of historical prices. For example, a smartphone today offers different functionality than it did one, three, five, or 10 years ago.
- Forecast horizon: Inflation estimates can vary in terms of their forecast horizons. Market-implied forecasts using instruments like the U.S. Treasury’s Inflation-Protected Securities (TIPS) can present issues because of their varying maturities and liquidities. Surveys and economist forecasts can also be conducted at different horizons.
A Potential Solution: Data-Scientist Approach
Because of these challenges, it’s difficult, if not impossible, for a single metric to comprehensively describe or measure all aspects of inflation. How then might a market participant come up with a well-rounded, more accurate inflation input to their asset allocation decisions? One potential solution is to study forecasts from many angles by aggregating and normalizing forecasts of different types.
In the 2017 Street View, we plotted publicly-available forecasts of U.S. inflation. We’ll update that study with currently available information and discuss implications we can draw from it.
As a reminder of the methodology, we gathered U.S. inflation forecasts from a variety of sources, including market-based measures, forecasts by economists at banks and other financial institutions, and survey data. Included in this cross-section are forecasts of different definitions of inflation, including expectations for CPI as well as PCE, and at different horizons (e.g., inflation expectations for the next year, five years, 10 years). In effect, we are mixing and matching many different forecasts for U.S. inflation. For example, one forecast might be based on a survey of where people think prices will be over the next year, and another forecast might be a market-implied five year inflation forecast for the period beginning five years from now (i.e., five year, five year breakevens). In order to reconcile these proverbial apples and oranges, we normalize each forecast relative to its own time series by using its historical mean and standard deviation from 2016 to present. We then display a time series of vertically oriented distributions that helps visualize tails, skewness, and ranges of forecasts. The blue line connects the median forecasts each month. The light cyan shading captures the distributions in 2020; the light gray shading captures 2021 distributions.
Exhibit 1: Normalized Aggregate of Publicly-Available U.S. Inflation Forecasts
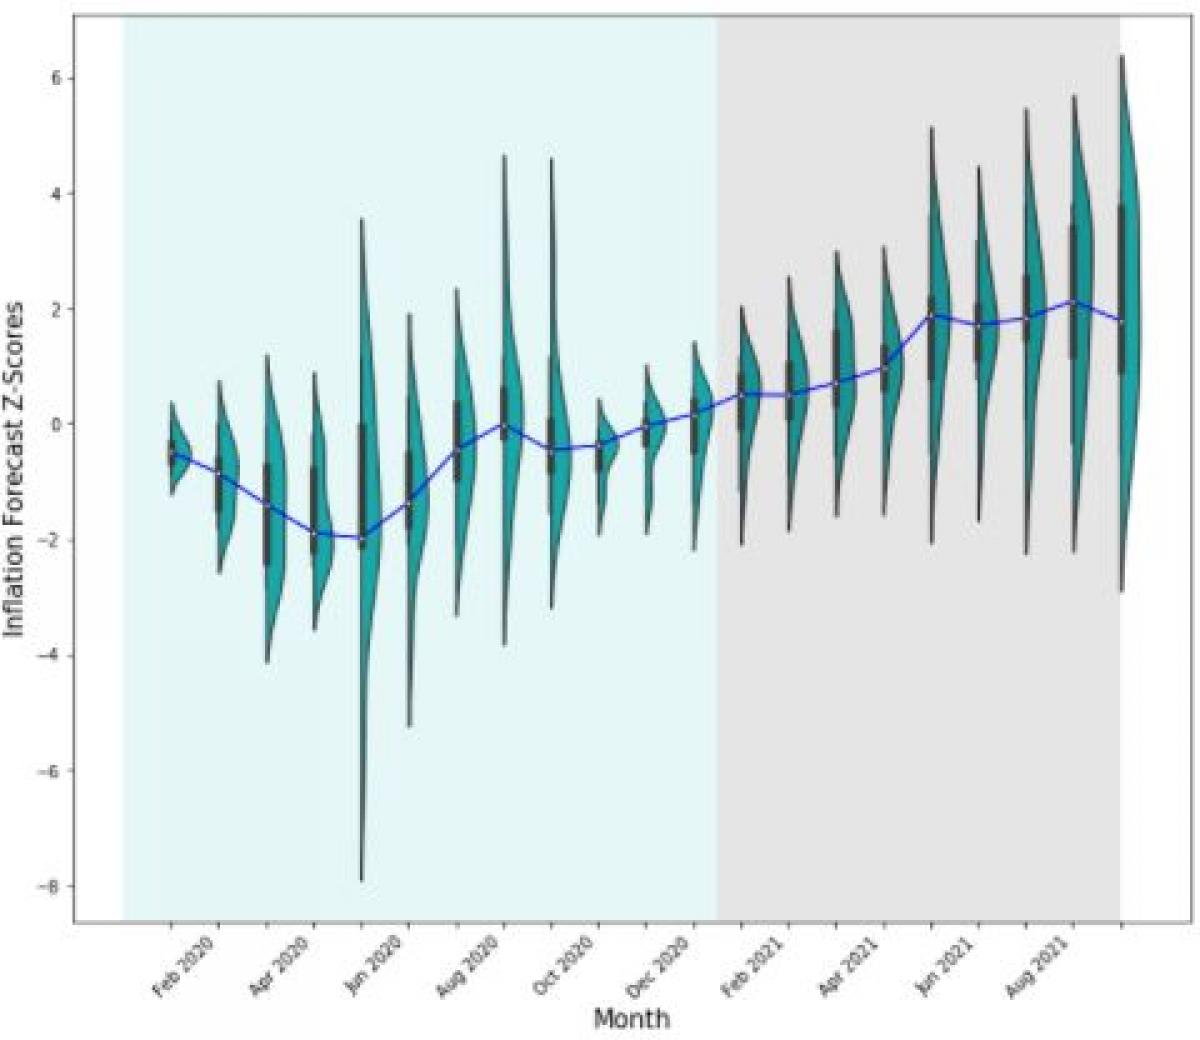
Sources: Bloomberg; FRED Economic Data; Federal Reserve Bank of Cleveland; Federal Reserve Bank of New York; and University of Michigan, Survey Research Center, Surveys of Consumers as of October 18, 2021. Z-scores are standardized scores that convey how far away the forecasts were from their respective historical means, measured in standard deviations. A z-score is calculated by subtracting the mean from the observed forecast and dividing by the standard deviation. Again, means and standard deviations are calculated using data dating back to 2016.
A few observations on these distributions:
Medians
- The median forecast started and ended 2020 near zero (i.e., it was in line with historical inflation forecasts) but certainly moved around intra-year. In particular, the median forecast dropped following the COVID market crisis in Q1, suggesting that, at the time, forecasters generally viewed the effects of the pandemic as deflationary (at least compared to historical standards).
- Then, in 2021 (through September), we see that the median forecast rose, reaching a high in May and staying elevated through September. The most recent median sat near two standard deviations (relative to historical averages). This means that inflation expectations rose fairly dramatically (again, compared to their five-year historical averages).
Ranges
- The distributions mostly fell within two standard deviations from their longer-term forecast means, except for two sub-periods:
- The first sub-period was following the COVID market crisis in Q1 2020 in which distributions were both wider (more uncertainty) and generally negative (indicating, as we mentioned earlier, the general take that the pandemic was deflationary).
- The second sub-period was when distributions became meaningfully wider in May through September 2021, again indicating greater dispersion from historical inflation forecasts.
- These relatively large ranges emphasize the idea that putting undue weight on single point estimates risks confusing rather than illuminating the inflation picture.
One Step Further: Forward-Looking Inflation Forecasts as of October 2021
Exhibit 1 painted a picture of historical inflation forecasts from 2020 to September 2021. As we saw in the final distribution, September 2021 saw one of the highest normalized median U.S. inflation forecasts since 2020. Let’s take this analysis a step further by exploring what the forward-looking, raw inflation forecasts were as of the middle of October (i.e., the actual inflation numbers that forecasters are expecting in the future). To do this, we’ll narrow in on a very “apples-to-apples” subset of Exhibit 1 forecasts: what economists at banks and other financial institutions believe year-over-year (YoY) CPI will look like in the next several quarters through the end of 2022. We are comparing forecasts of the same type of inflation at the same horizon over time, and the sample size is still fairly large (the number of forecasts is 45).
Exhibit 2 plots the distributions of these raw YoY CPI forecasts for future quarters through the end of next year. That is, these are the forecasts made as of mid-October for reported YoY CPI in Q4 2021, Q1 2022, etc. from 45 different banks and other financial institutions. We use a similar visualization to Exhibit 1, with the blue line connecting the medians.1 Finally, the horizontal red line plots the latest 5.4% CPI print reported on October 13, 2021 as a point of comparison.
Exhibit 2: Aggregated Year-Over-Year U.S. CPI Forecasts From 45 Economists
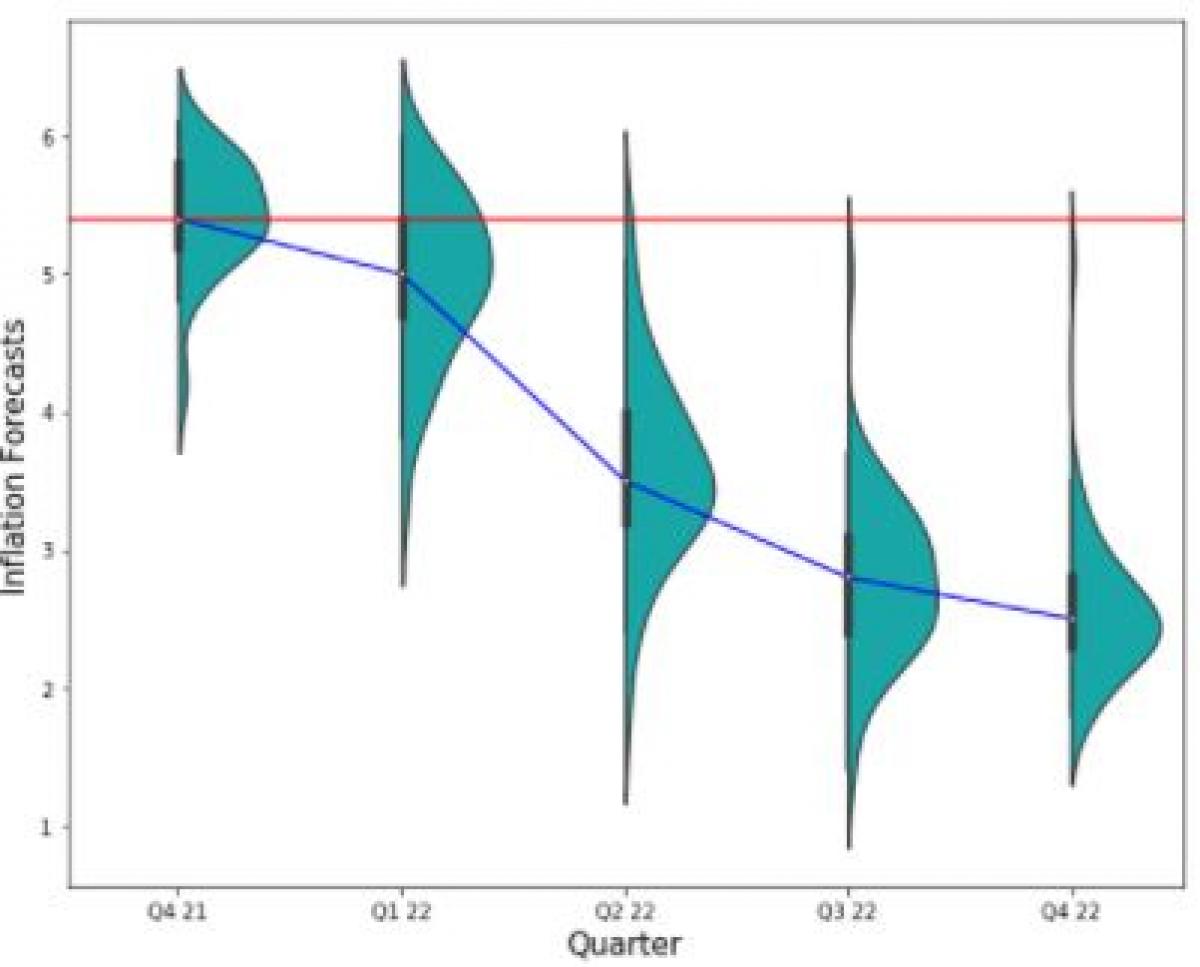
Source: Economic Forecasts (ECFC) in Bloomberg as of October 19, 2021. Period: Q4 2021 – Q4 2022, quarterly data.
Here we see the median forecasts are mostly lower than the most recent print, but still relatively high for the next couple quarters, and then drop as we move further into next year. Additionally, there is a notable skew shift: the distribution of inflation forecasts in the nearer-term exhibits negative skew (i.e., more forecasts in the low inflation tail than a normal distribution), while we observe positive skew further out (i.e., more forecasts in the high inflation tail than a normal distribution).
From this view, it seems like the majority agree with the Federal Reserve that U.S. inflation is transitory and will normalize in 2022. However, there are a select few contributors that forecast inflation staying at relatively elevated levels in 2022 (as evidenced by the elongated tails in the top right of the chart).
Conclusion
To wrap up, there are many challenges to overcome when analyzing forward-looking inflation, which is a key component of asset allocation decisions. In this Street View, we presented a couple of ways in which market participants can potentially construct a multi-angle picture of how inflation may change in the future.
The first was a refresh of our 2017 Street View, in which we gathered many future inflation views to understand how inflation forecasts have changed relative to history. We found that inflation forecasts are generally higher than where they’ve been over the last five years, but there’s a meaningful amount of dispersion.
The second analysis focused on forecasts for a particular definition of inflation (i.e., expected CPI YoY changes by economists) to understand the cross-section of inflation views for the coming quarters. It appears that most (although not all) believe that inflation will decrease next year, with the average Q4 2022 forecast sitting close to 2% (the Federal Reserve’s long-term inflation target).
Footnotes
- Note that the axes of Exhibit 2 are different from Exhibit 1 — the distributions consist of un-standardized, raw inflation forecasts at a quarterly frequency from Q4 2021 through Q4 2022.
About the Author:
Alex Botte, CFA, CAIA is a Vice President on the Client Portfolio Management team at Two Sigma Advisers LLC. She was previously at AQR Capital Management, where she most recently served as a Product Specialist for the firm’s Global Asset Allocation strategies. Prior to AQR, she worked in Prime Services at Barclays. Alex holds a Bachelors of Science in Applied Economics and Management from Cornell University.

This article is not an endorsement by Two Sigma of the papers discussed, their viewpoints or the companies discussed. The views expressed above reflect those of the authors and are not necessarily the views of Two Sigma Investments, LP or any of its affiliates (collectively, “Two Sigma”). The information presented above is only for informational and educational purposes and is not an offer to sell or the solicitation of an offer to buy any securities or other instruments. Additionally, the above information is not intended to provide, and should not be relied upon for investment, accounting, legal or tax advice. Two Sigma makes no representations, express or implied, regarding the accuracy or completeness of this information, and the reader accepts all risks in relying on the above information for any purpose whatsoever. Click here for other important disclaimers and disclosures.