


By David Donahue, CFA, Partner at Mbuyu Capital Partners, and Michiel Timmerman, Managing Partner, Mbuyu Capital Partners.
Part I of this two-part coverage of private equity in Africa provides background on the investment opportunity that Africa presents. Part II will cover differences between this and developed market private equity and key considerations required to deploy a successful investment strategy targeting the region.
Summary
Africa’s large 1.3 billion population is forecast to almost double to 2.5 billion between now and 2050, to account for 25 percent of the global population. The African continent is also forecast to have the largest urban population, 37 percent higher than China’s.
The African continent is expected to have the largest labour force, 83 percent higher than China’s, and the only labour force still expanding, owing to the young age demographic, with the potential to throw off significant dividends in terms of growth and GDP.
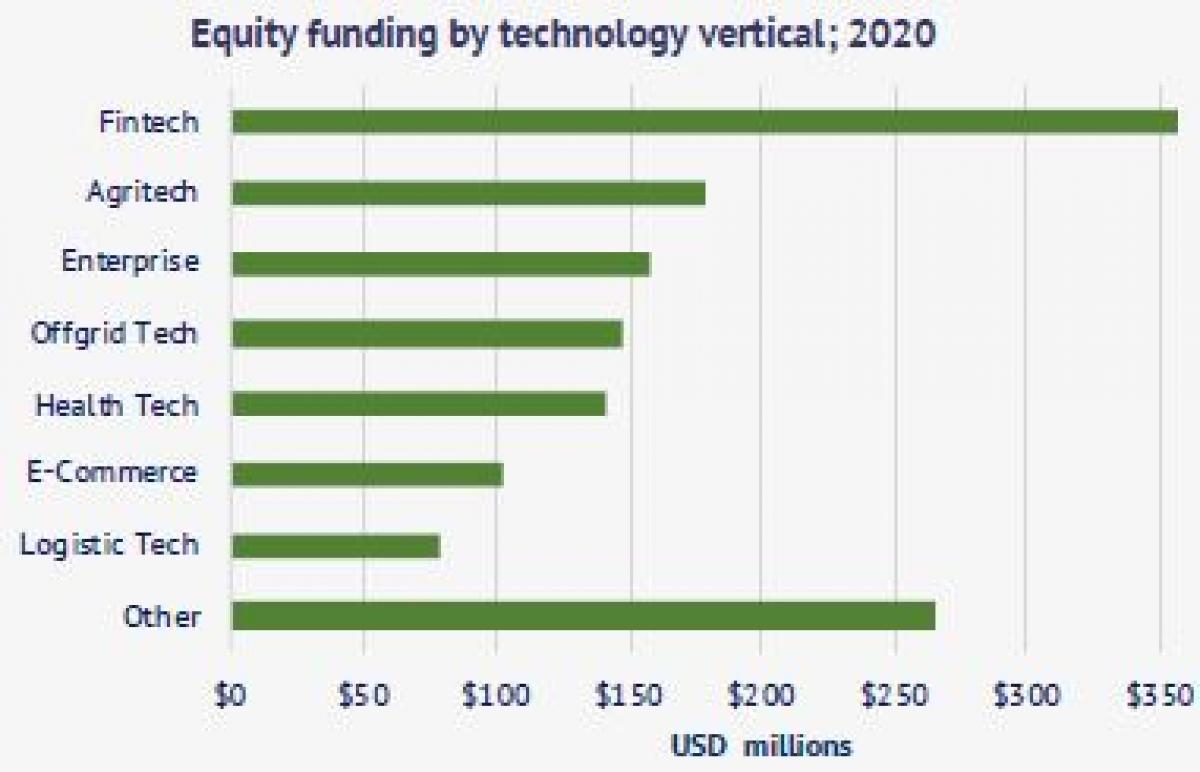
There is increasing foreign direct investment into Africa, from a low base, and focused on key economies. Africa’s mobile infrastructure and innovative companies have made it a global leader in mobile payments. These opportunities are reflected in the strong venture capital flows into Africa over the past few years, with fintech and agritech the two leading verticals.
Developed market private equity returns have been declining while funds raised have increased, as have entry valuations and the use of leverage. Despite much lower leverage and valuations, and comparable risk, African private equity flows are a fraction of global flows and below relative GDP.
Median gross of fee returns from African private equity investment are comparable to those from developed markets, but for private equity funds African median net IRRs are closer to 5 percent, compared to 14 percent for developed market private equity funds net IRRs over the last 10 years (although future expectations are nearer 8 percent). However, as developed market private equity returns continue to decline and risks increase, African private equity should warrant attention if the gap between gross and net returns can be addressed. Part II will highlight a number of ways of achieving this, which could result in a more than 4 percent improvement in net returns, putting median African private equity performance ahead of expected global private equity median returns. Tools currently not used or under-used by African private equity managers include the use of capital call facilities and recycling of proceeds. General Partners (GPs) also need to focus more on shortening investment holding periods to below five years, from a median of over six years currently. Further development of intermediaries and platforms to present investment-ready opportunities is also required to increase speed and efficiency of capital deployment.
The predominance of international development finance institutions (DFIs) in the African private equity investor base dampens median returns through a “strategy effect”. DFIs focus (understandably) on the developmental aspects of investments which results in a higher tolerance for investments with unproven managers and less focus on IRR.
Africa also offers significant opportunities to contribute to the UN’s Sustainable Development Goals as part of a responsible investment strategy.
Growth and trade
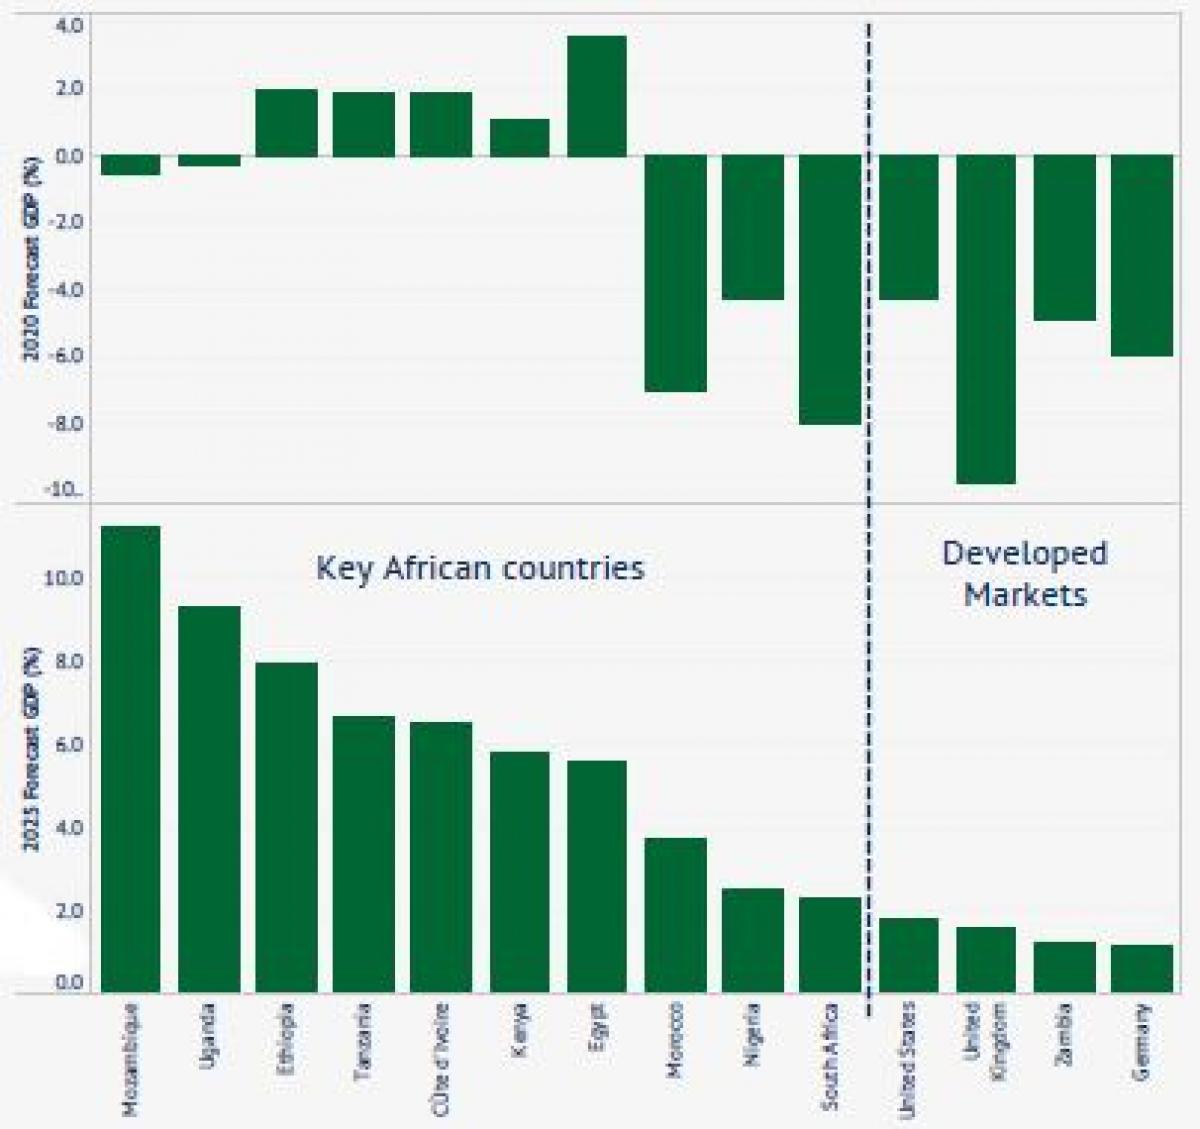
Africa continues to show strong growth prospects, with an expectation of a significant rebound from COVID, which has also affected African growth less than in developed markets.
Forecast GDP at constant prices[1]
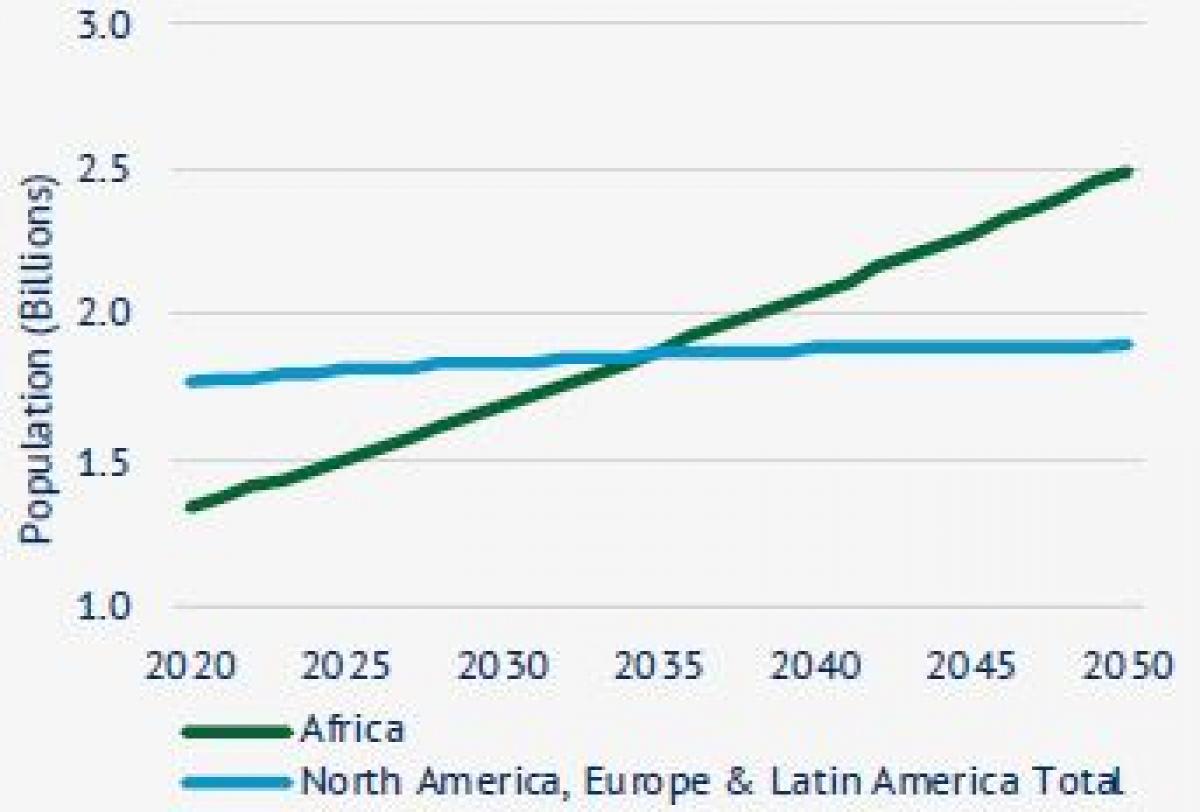
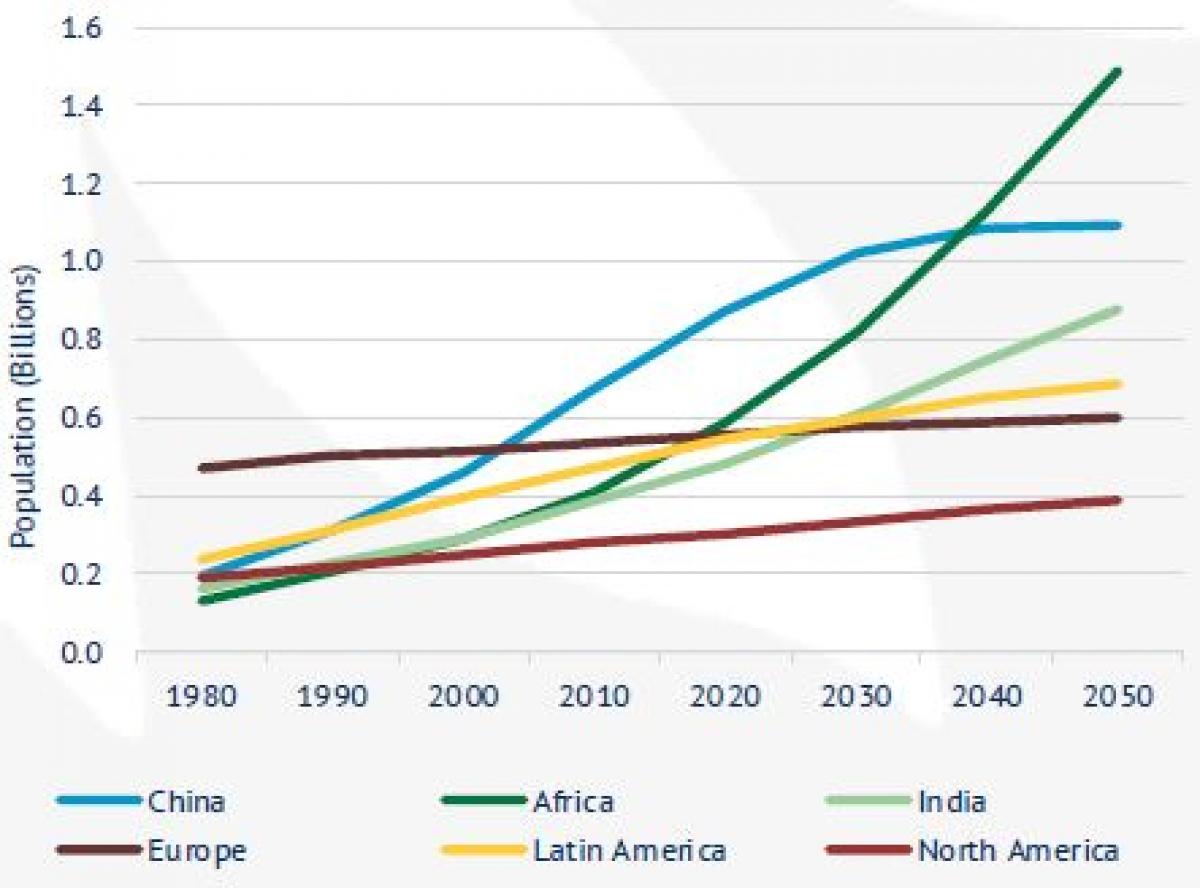
Africa’s population is also expected to exceed that of North America, Europe and Latin America combined, at 2.5 billion by 2050 and a 25 percent share of the global population.
African population projection vs North America, Europe and Latin America[2]
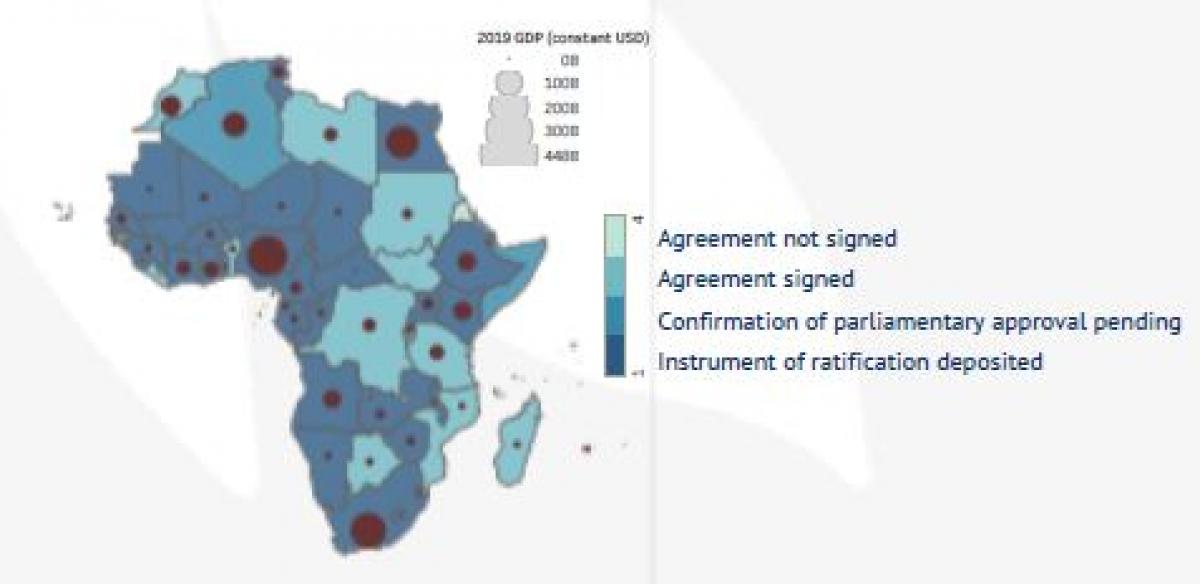
The landmark African Continental Free Trade Area (ACFTA) agreement among 49 countries came into effect on 1 January 2021 and should further support growth. The free trade area will create a single market for trade in goods and services among the African countries. This is expected to be accompanied by co-operation on investment measures, intellectual property rights and competition policies, to support innovation, competitiveness, and trade diversification. The largest economies by GDP have ratified the agreement. It has been estimated by United Nations Conference on Trade and Development that full liberalisation will lead to a 1-3 percent increase in GDP and a 33 percent increase in the value of intra-African trade.
Status of ratification of the African Continental Free Trade Area Agreement[3]
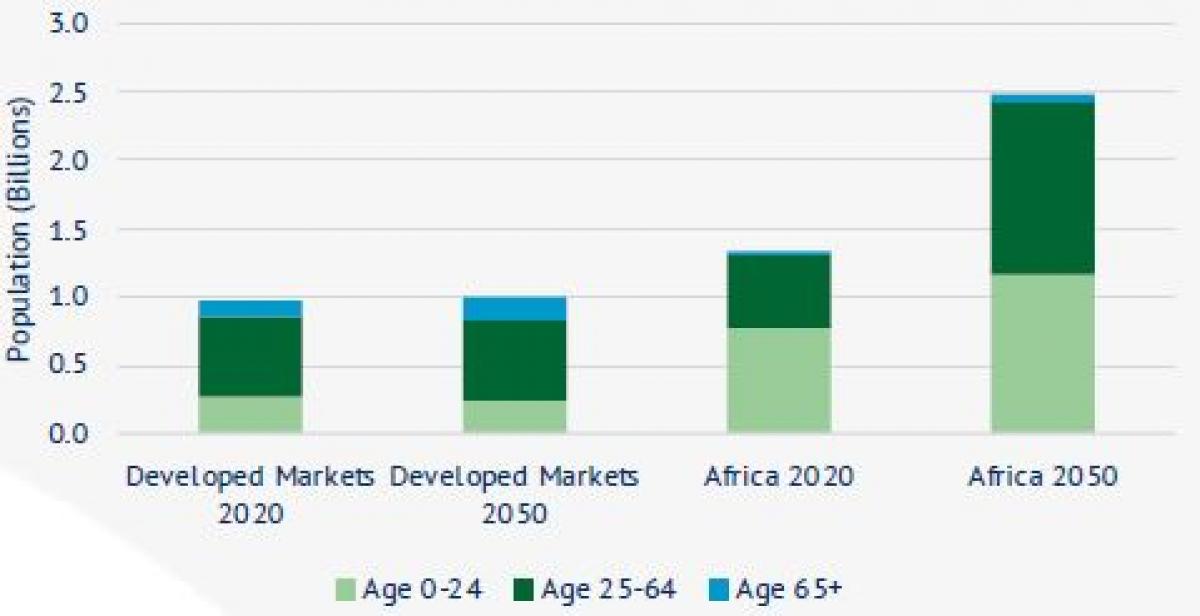
Africa’s population will also be young and the corresponding workforce growth could lead to dividends for African economies:
- Boosting economic growth by increasing the effective labour supply, improving the annual growth of GDP per capita by up to half a percentage point at constant output per worker;
- Increased activity ratio (proportion of the working-age (15-64 years) population relative to the dependent-age population (under 15 and over 65 years). A favourable change in activity ratio can accumulate savings, investments in physical and human capital, and productivity gains;
- Associated urbanisation can increase these effects on economic growth. Rapid urbanisation brings opportunities to create new markets and improve productivity.
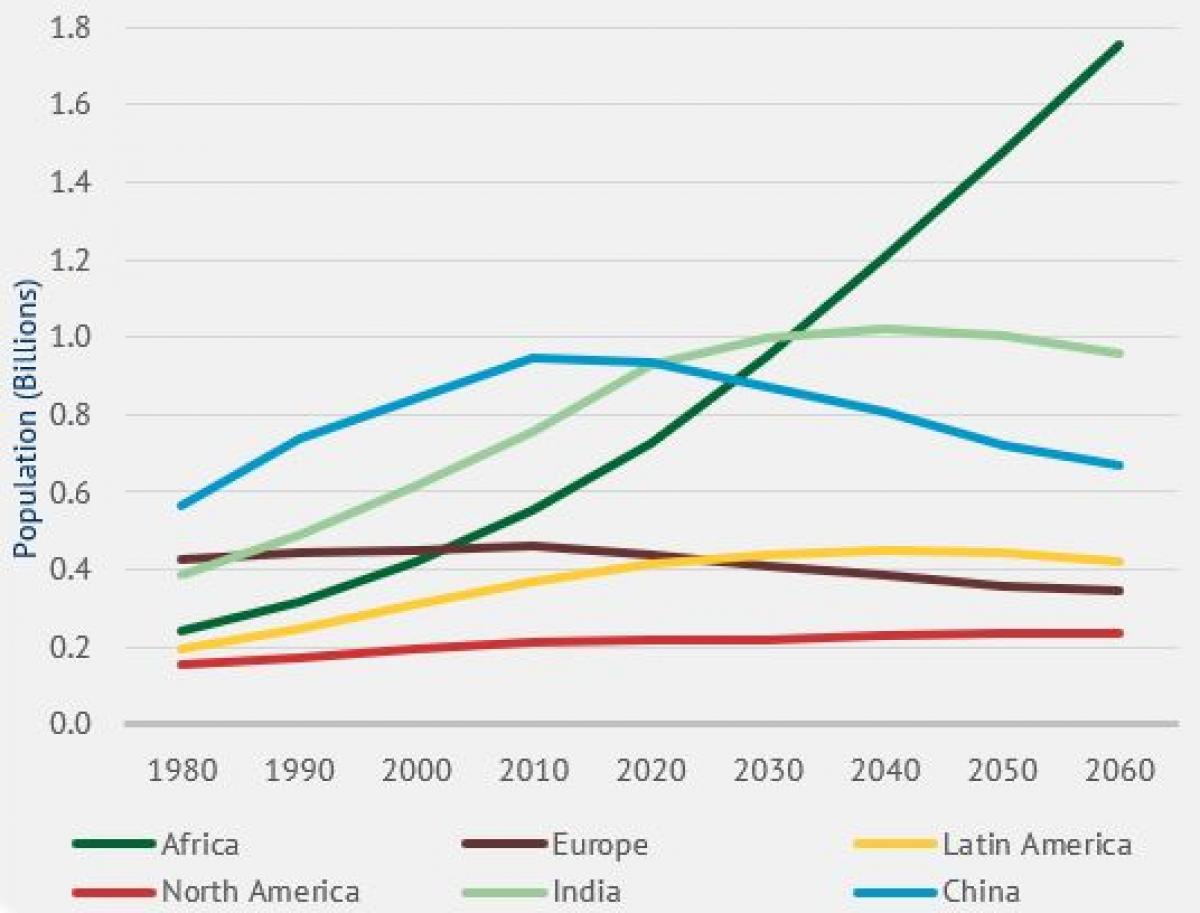
Urban population growth forecast[5]
Africa’s labour force is expected to exceed China’s during this decade and Africa’s urban population is forecast to exceed China’s in the next decade.
Investment
Foreign direct investment (FDI) to top African urban markets is also increasing. An estimated 83 percent of all jobs directly created by FDI between 2003 and 2014 were located in cities.
Africa inward FDI Flow; 2019 (USD millions, current prices)[6]

Note: FDI flow of -1 equals -100 percent p.a. and flow od 1.0 equals +100 percent p.a.
International investment plans and programmes to promote investment in Africa support growth potential given the link between FDI and GDP. The 2019 G7 Summit agenda highlighted the importance of developments in Africa as a global priority.
Recently announced and renewed country initiatives include:
- United States - Prosper Africa initiative
- France - Choose Africa programme
- Germany - Africa Connect
- India - Longstanding trade/investment with new free trade agreement being considered
- China - Belt and Road initiative
- Japan - 2019 Tokyo International Conference on African Development and related plans
- United Kingdom - Partnership for Investment and Growth in Africa.
Africa represents an immense opportunity to invest and promote the achievement of the United Nations Sustainable Development Goals. Although approximately 12 percent of the USD 12 trillion of global investment opportunity available to target advancement toward the Goals is based in Africa, given the continent’s earlier stage of development, there is significant low-hanging fruit across many Goals. Of the global job creation potential, estimated at 380 million jobs before 2030, 21 percent could be achieved in Africa. Africa also possesses great potential for increased food production, possibly by 65 percent by 2050, to feed the rapidly growing population worldwide. Improving agriculture-related logistics could reduce food waste in Africa, estimated at as much as 40 percent of production, through basic storage and logistics.
Currently the majority of private equity investment in Sub-Saharan Africa ex-South Africa is from outside the Continent and represents only a fraction of the capital required.
Africa private equity fundraising 2014-20[7]
Opportunities for innovation and disruption
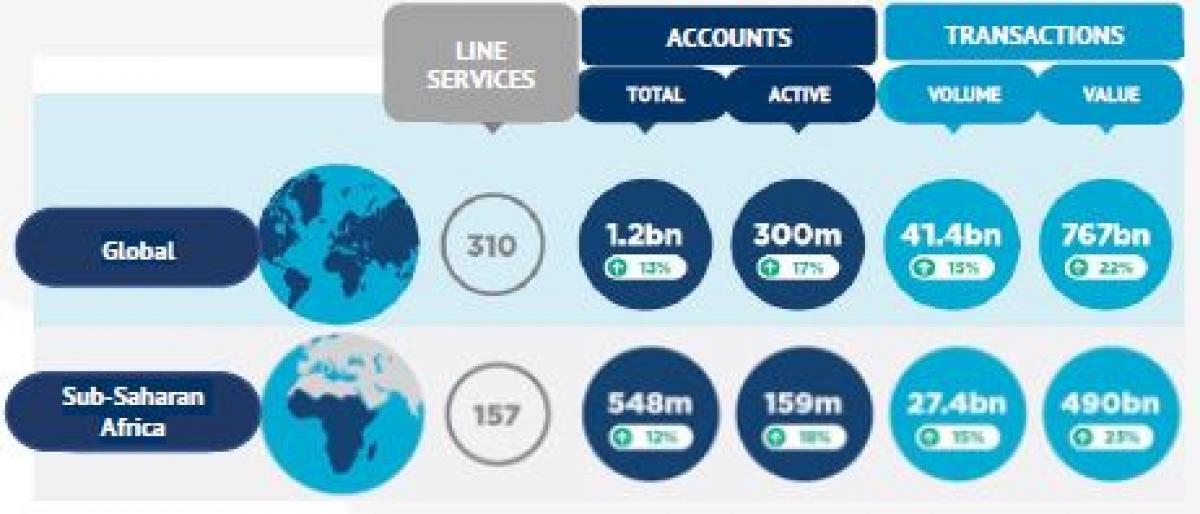
Sub-Saharan Africa leads the world in access and use of mobile payments platforms. North Africa is seeing a large increase in registered accounts in absolute terms as a result of new and renewed efforts by industry players and government support. Access enables opportunities to provide additional information and financial services.
Regional mobile payments growth; 2020[8]
This has enabled the development of an active venture capital sector in Africa, much of which is driven by mobile phone and other digital infrastructure.
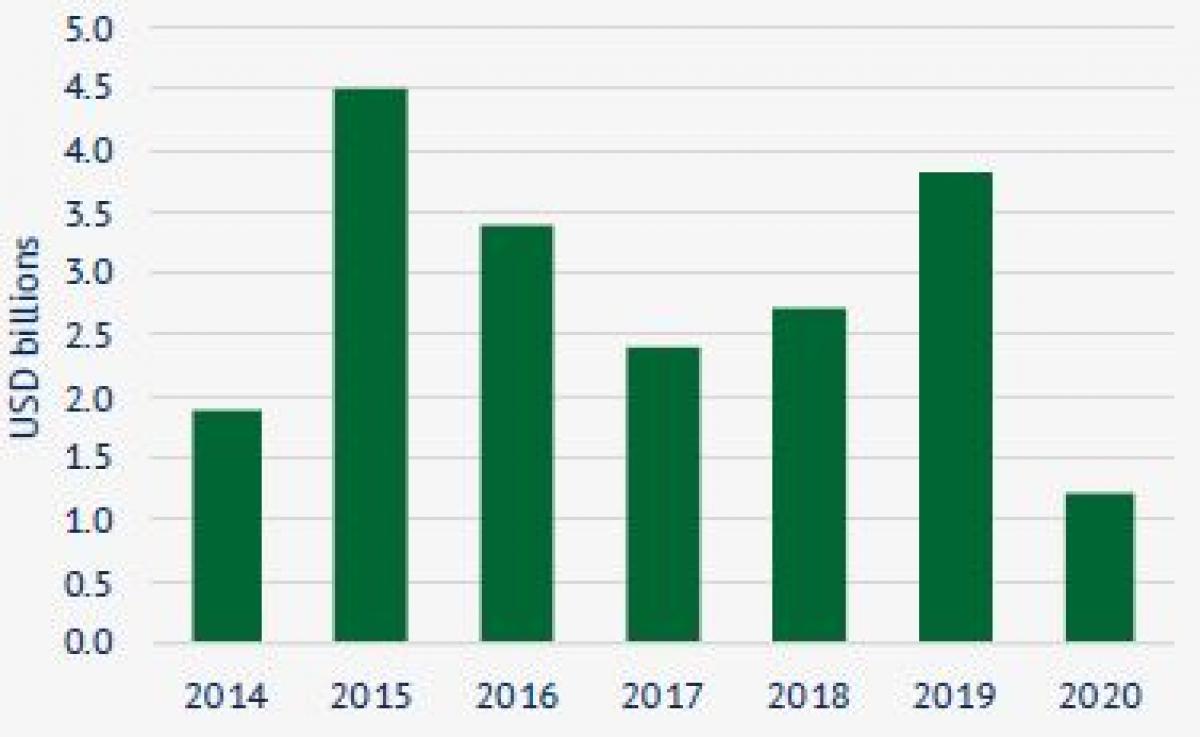
Total equity funding of venture companies in Africa; 2015 – 2020[9]
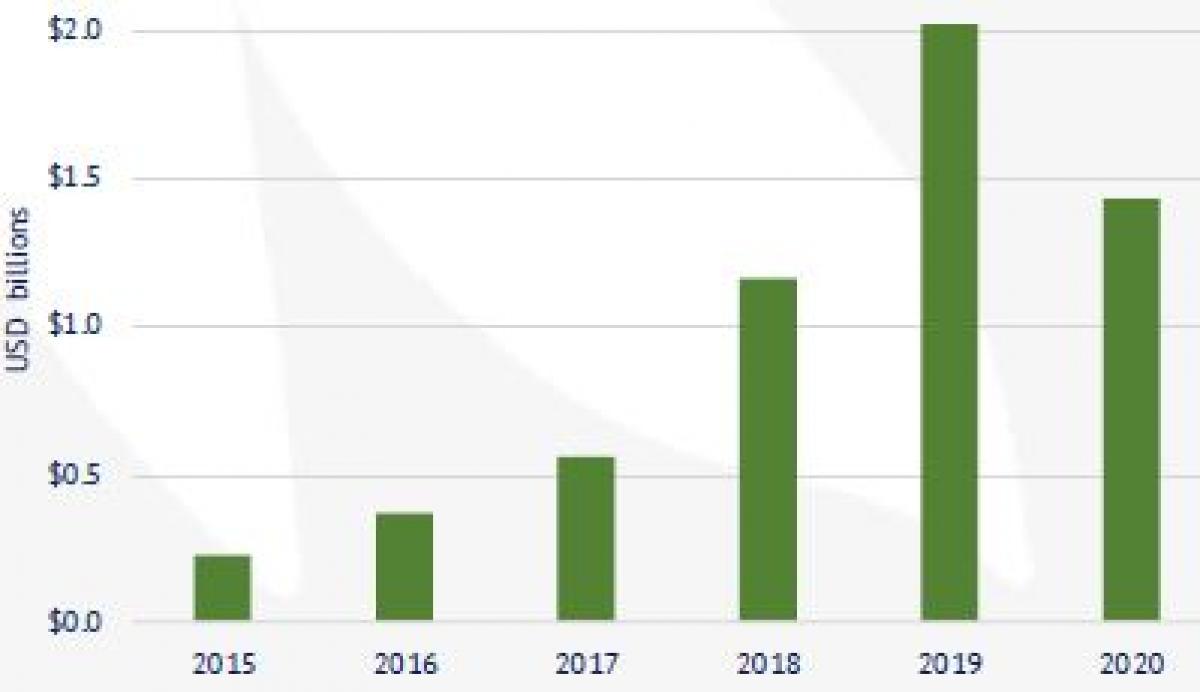
Investment into the venture capital sector exceeded private equity fund investment in 2020 and was c. 50 percent of USD 3.8 billion private equity fundraising for all of Africa in 2019. [10]
Developed market private equity returns and expectations have been declining
Investors have been reducing their return expectations for developed market private equity:
- Preqin (2018) reports that investors interviewed expect average annual private equity returns of 11.6 percent versus 14.1 percent in 2015, with most investors considering that the equity cycle peak had been reached;
- 2021 eVestment, Nasdaq Investment Intelligence Consultant Outlooks (https://www.evestment.com/landing-pages/consultant-outlooks-2021/, Aggregated capital markets assumptions from Aon, Callan, Meketa, NEPC, Verus and Wilshire) reports a more recent expected return decline to 8.4 percent;
- Lower expectations result from factors including high valuations being paid for new investments and competition for assets, given abundant capital available from strategic and private fund investors, in particular for growth equity investments;
- Although most investors believe the market cycle is at its peak, few are adjusting their investment strategy.
Competition for new investments is strong and increasing in developed markets.
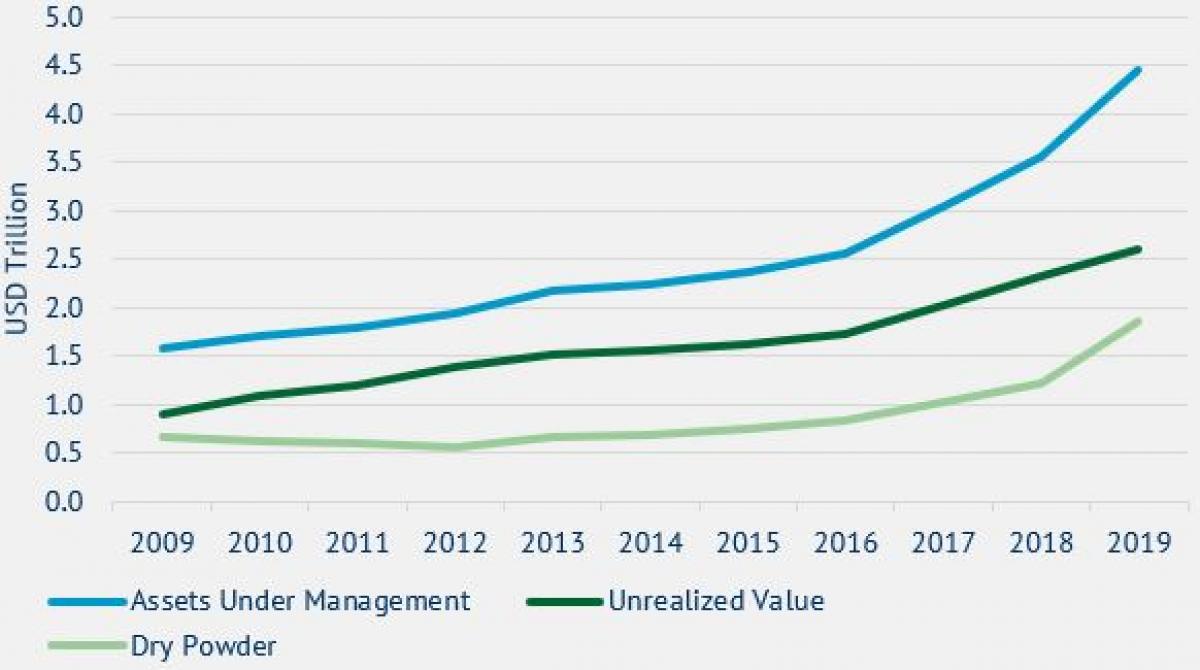
- The opportunity set is being pursued by ever-greater volumes of capital with growing private equity assets under management. Dry powder is rising to record levels (https://docs.preqin.com/quarterly/pe/Preqin-Quarterly-Update-Private-Equity-and-Venture-Capital-Q3-2019.pdf).
Global private equity assets under management[11]
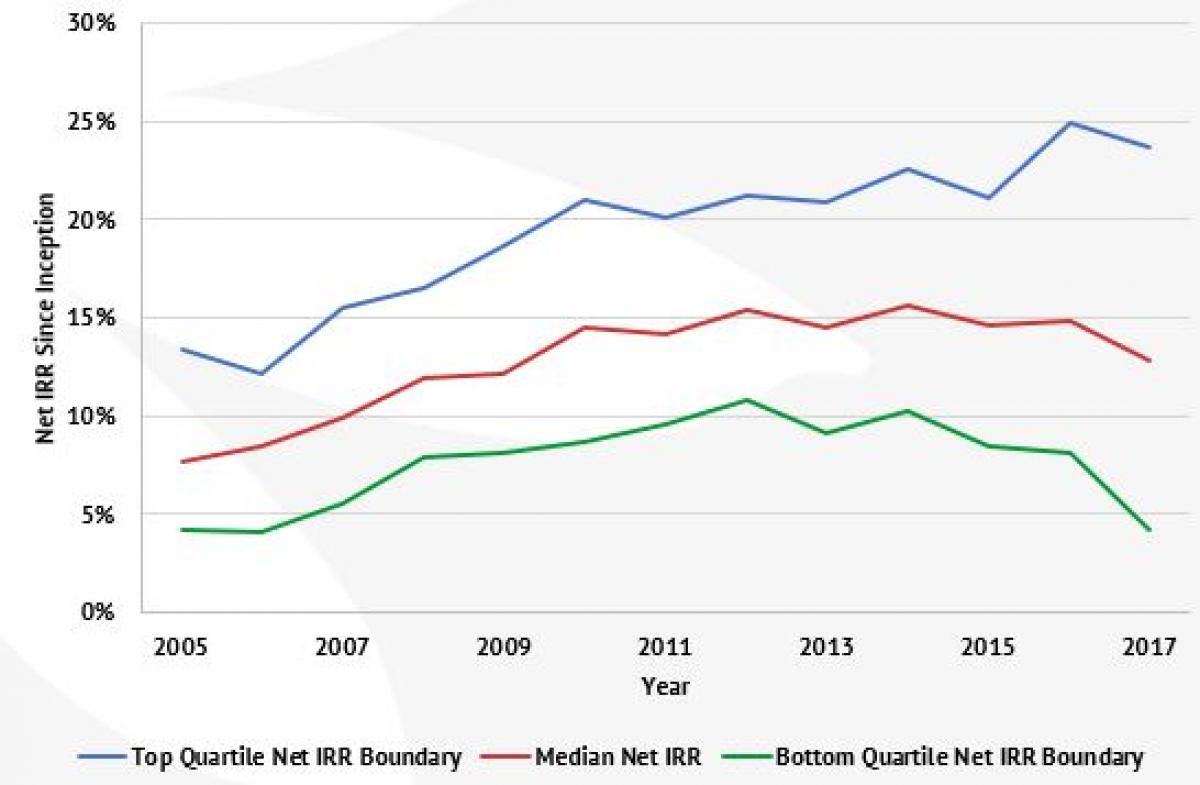
Manager return dispersion is an important consideration given the increasingly wide range of top quartile vs bottom quartile average fund returns of c. 20 percent dispersion of net IRR, according to recent CAIA analysis (https://caia.org/next-decade).
Median net IRRs & quartile boundaries by vintage year[12]
Supporting the extension of the trend, fundraising efforts in the United States, for example, reached an all-time high with USD 350 billion raised in 2019 (https://www.mckinsey.com/industries/private-equity-and-principal-investors/our-insights/mckinseys-private-markets-annual-review).
Competition for transactions from corporate acquirers in developed markets has also increased over the past ten years contributing to global merger and acquisition volume exceeding USD 3 trillion to September 2019, according to Dealogic (https://dealogic.com/insight/ma-highlights-first-9-months-2019/).
Private equity investment flows into Africa have been a fraction of those in developed markets and are not consistent with the relative opportunities ...
Private equity fundraising in 2020 for global private equity was USD 989 billion, compared to USD 1.2 billion for African private equity. While African GDP is only 2.6 percent of global GDP, there is nevertheless a significant mismatch between private equity funds raised and opportunity, as measured by GDP.
Gross pooled returns of realised deals from African private equity transactions are comparable to those in global markets. African pooled returns are from Mbuyu Capital’s African private equity deal database, limited to investment size of USD 10 million and above, estimated to represent enterprise value of USD 50 million and above. This compares to an investment size of USD 50 million and above for deals in the Bain & Company analysis. Both would represent mid to larger-sized deals in their respective universes. There is a general perception that African private equity deals perform substantially worse than developed market deals. The data suggests otherwise.
Gross pooled returns for global private equity and African private equity[14]
... or risks
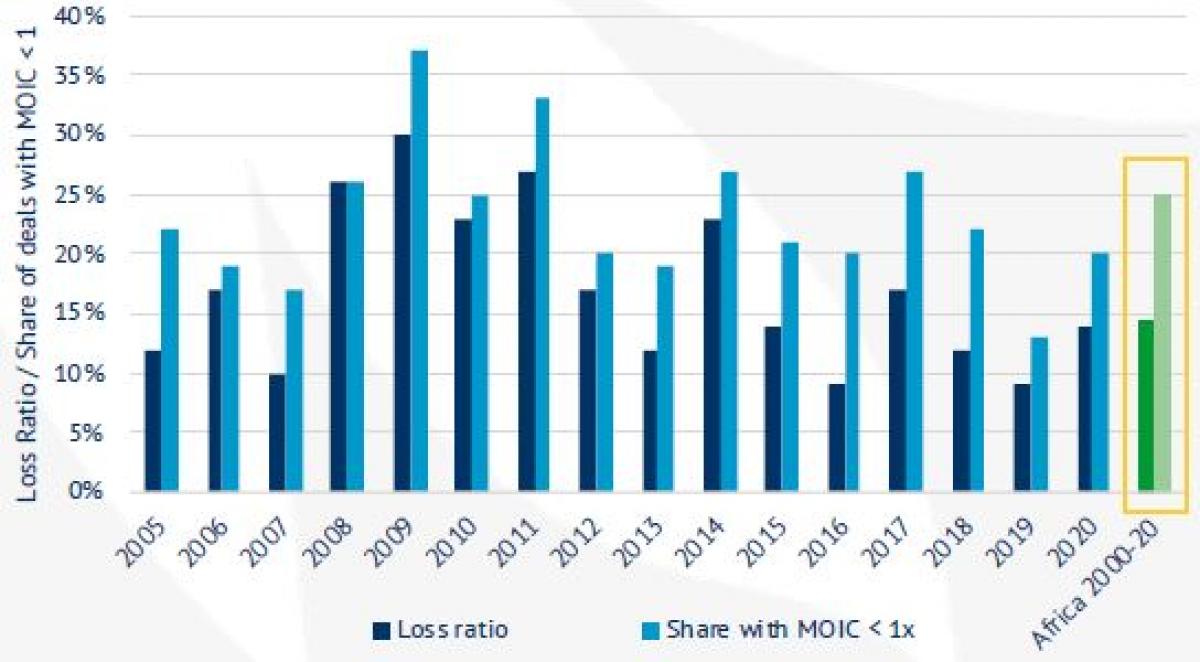
Loss ratios (the capital-weighted ratio between realised deals below 1x divided by the investment amount) for African private equity are comparable to global buy-out loss ratios. African loss ratios are based on Mbuyu Capital’s African private equity deal database, limited to investment size of USD 10 million and above, estimated to represent enterprise value of USD 50 million and above. This compares to an investment size of USD 50 million and above for deals in the Bain & Company analysis. Both would represent mid to larger-sized deals in their respective universes.
There is a general perception that African private equity deals are substantially riskier than developed market deals. This is not borne out by the data.
Loss Ratio and Share of Deals with Multiple of Invested Capital (MOIC) < 1 in Global Buy-outs and Africa[15]
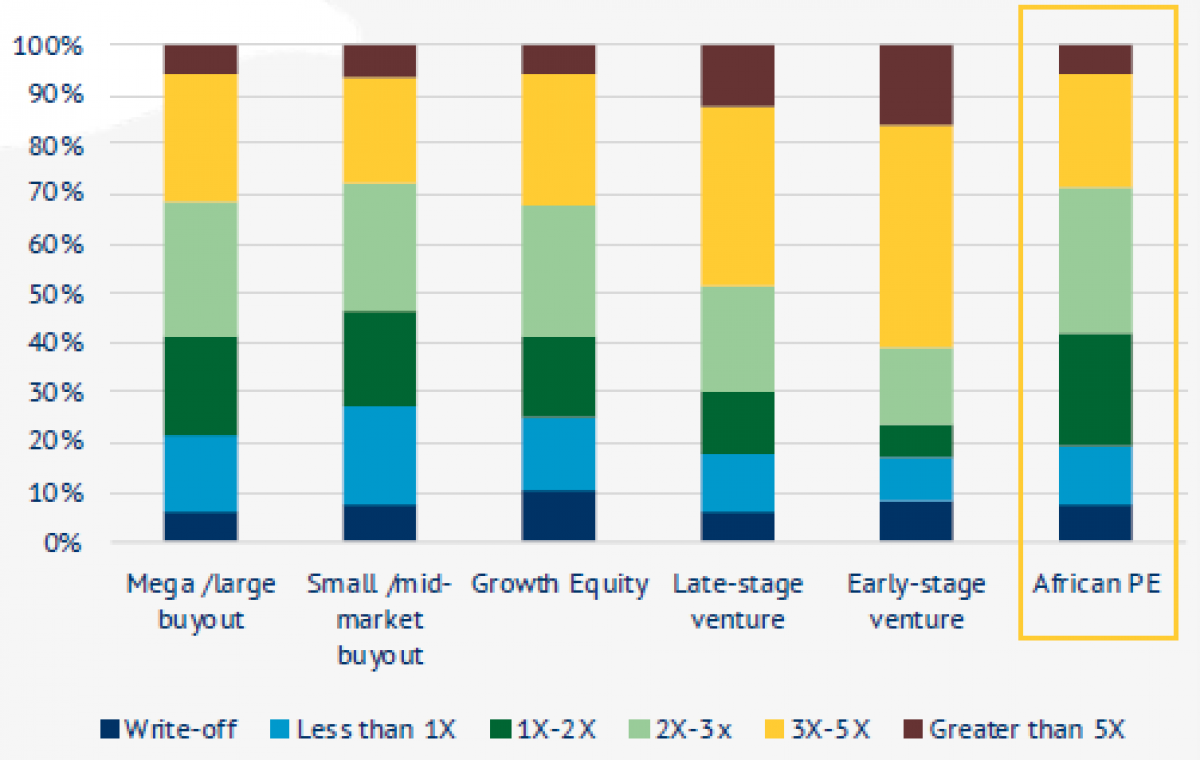
Deal MOIC comparison, US private equity by type vs African PE[16]
Increases in developed market valuations have exceeded those in Africa and are twice African valuations in absolute terms
US buy-out valuation multiples increased 25 percent (2.3 percent p.a.) between 2010 and 2020, European buy-outs increased 64 percent (5.1 percent p.a.), while Sub-Saharan African valuation multiples fell 50 percent (-6.7 percent p.a.) over the same period. Taking data for nine years to 2019, relative increases were 2.6 percent, 2.9 percent and 1.3 percent p.a. respectively. This means that if a company was purchased in the US and the GP added no value over the ten years to 2020, the sale price of a US PE-owned company would have been 75 percent higher than for an African company (or 14 percent over nine years to 2019). This clearly creates a following wind for US and European PE performance.
The very substantial increase in US and European valuations is likely the result of prolonged Quantitative Easing and low interest rates in the developed world, which has driven up listed equity valuations (e.g. the S&P 500 by 190 percent, 2010-20) and increased capital allocations to private equity.
In absolute terms average EBITDA purchase price multiples for Leverage Buyout (LBO) transactions during 2020 approached 11.4x in the US and a similar record level in Europe at 12.6x. In the US more than 55 percent of transactions were completed at multiples above 11x EBITDA (https://www.bain.com/globalassets/noindex/2020/bain_report_private_equity_report_2020.pdf).
While most investors consider developed markets to provide the best private equity opportunities, almost all believe high asset valuations to be the most concerning challenge[17].
In contrast, valuations in Africa remain reasonable on an absolute basis at four to eight times enterprise value (EV) to EBITDA for companies expected to deliver double-digit growth (https://brightafrica.riscura.com/downloads/dowload-the-bright-africa-20…). US growth private equity transactions are typically valued at 50 percent+ the EV/EBITDA multiple of buy-outs, making US growth transactions three to four times more expensive than their African equivalents.
Valuations, US & Europe compared to Africa[18]
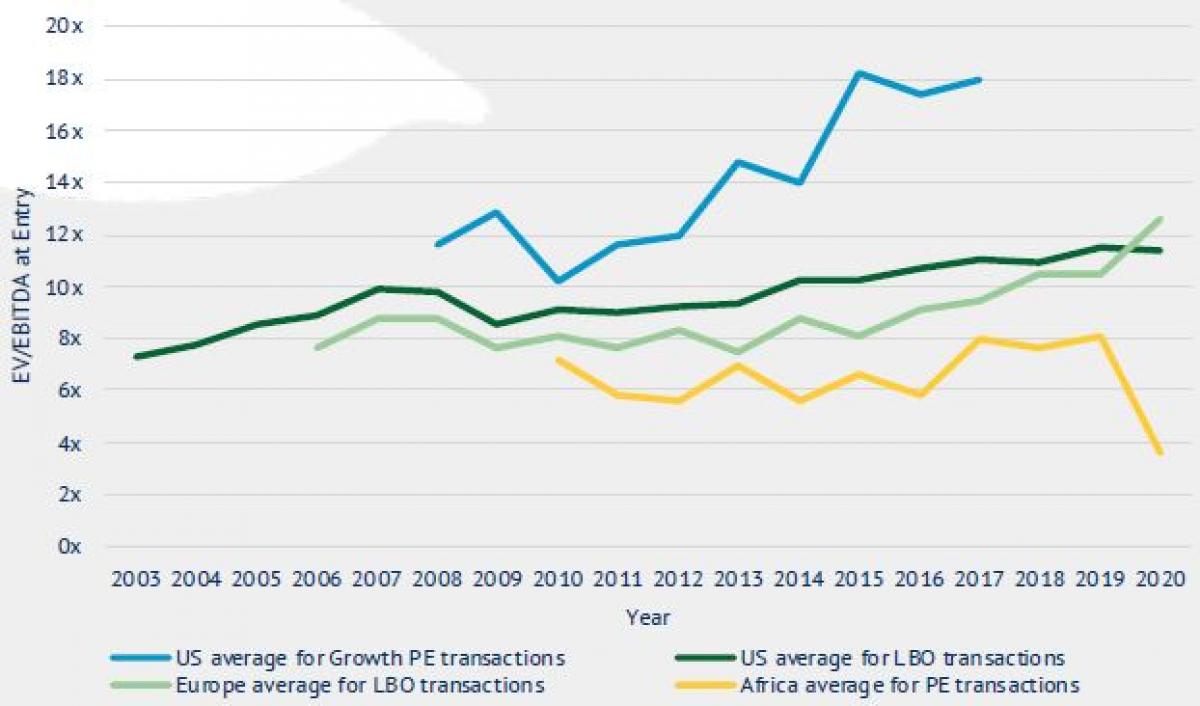
We estimate that higher growth in valuation multiples contributed c. 2 percent performance p.a. for US and European private equity compared to sub-Saharan Africa private equity. The strong growth in valuations of developed market private equity adds significant risk of a correction when growth disappoints.
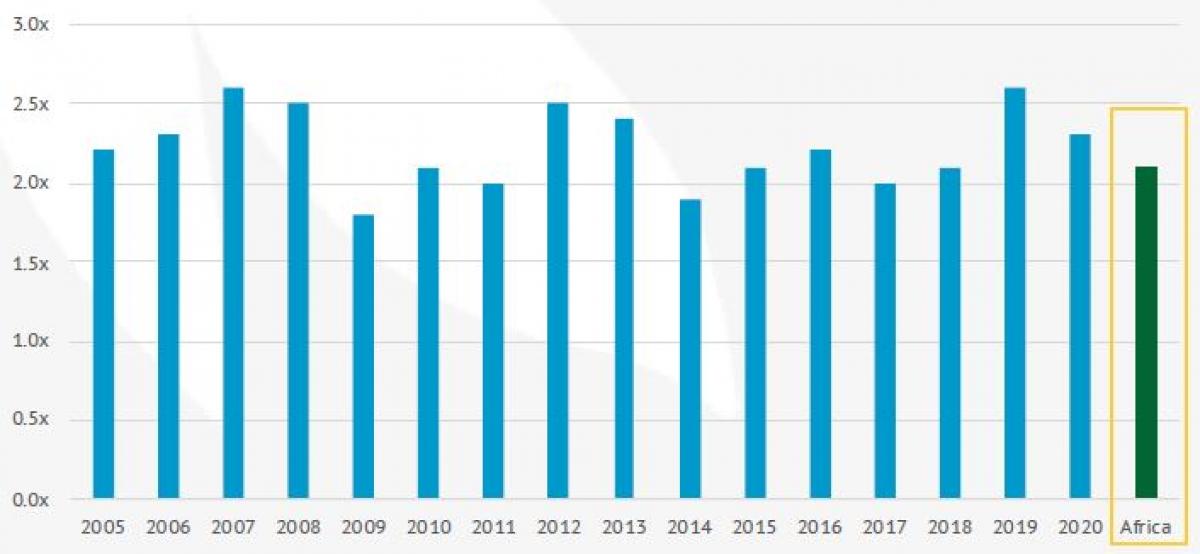
African private equity employs less leverage than developed markets
In addition to current valuations, investors in developed markets are increasingly concerned about the high levels of leverage applied to buyout transactions[19] and the increasing use of floating interest rate debt. Although overall portfolio company leverage levels increased, of specific concern is the recent increase in highly leveraged buyout transactions where debt is applied at greater than six times EBITDA. After the global financial crisis, regulators discouraged acquisitions utilising higher than six times leverage multiples, but restraint has been relaxed in recent history, particularly in the United States. Average debt to EBITDA levels over the past ten years were 5.0x. This puts US buy-outs at greater risk of rising interest rates (associated with inflation) or an economic downturn.
In contrast, the application of leverage in Africa is limited, with average debt to EBITDA multiples of 1.6x over the past ten years and falling for the past five years, three times lower than US or European buy-outs.
US & Europe vs African leverage used in private equity deals, 2010-20[20]

We estimate that higher use of leverage accounts for a c. 6 percent outperformance p.a. for US and European buy-outs compared to Sub-Saharan African private equity. The use of high leverage in buy-outs clearly represents a significant risk to transactions, which is not currently reflected in performance numbers.
Leverage performance impact example: standard buyout model[21]
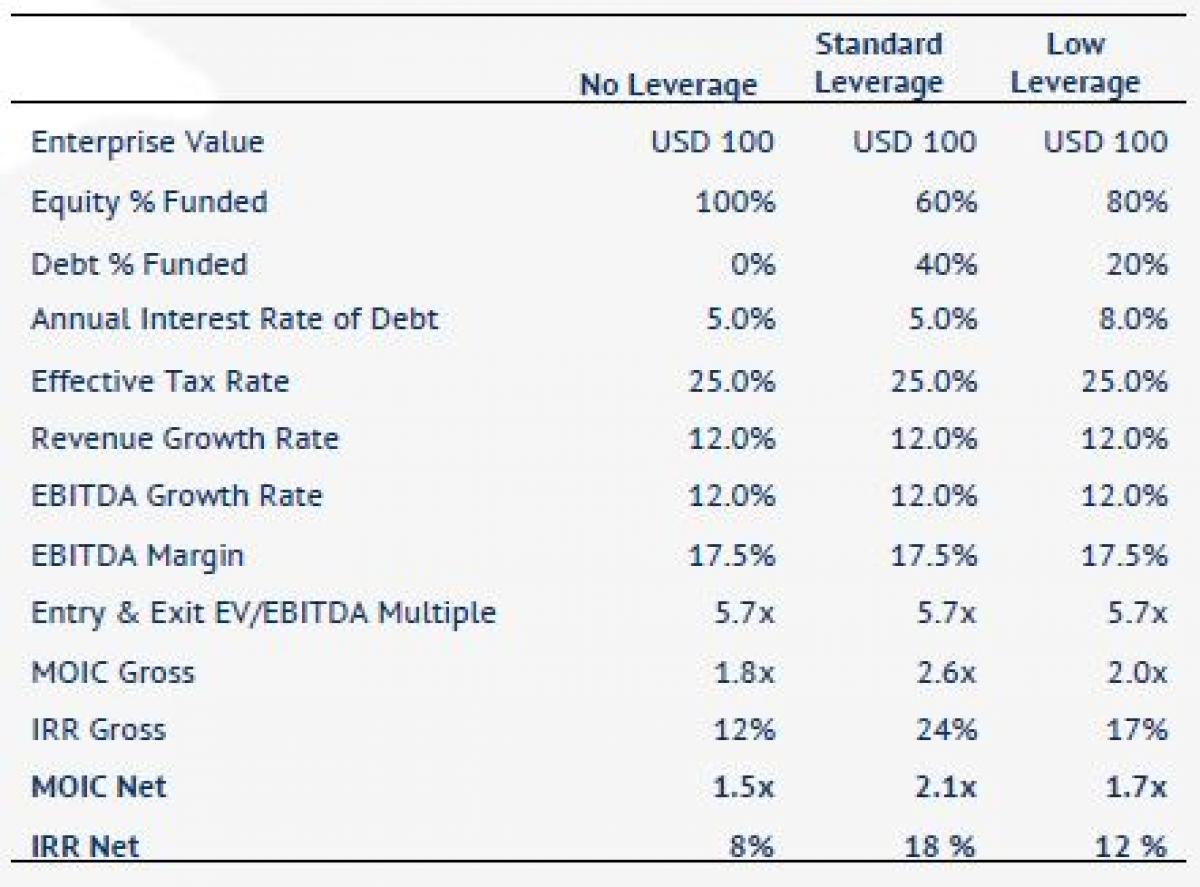
Note: The Low Leverage scenario is a level applied more typically, if at all, in Africa and uses a somewhat higher interest rate, required in the region. Model assumes similar EV/EBITDA multiples paid for purposes of comparison.
Summary
Private equity in Africa represents access to a differentiated source of investment returns for the reasons discussed including growth, growing interest the region and more attractive entry valuations with less risk imposed by leverage. Further detail is included in the recent presentation found here: https://www.mbuyucapital.com/ . Part II of this discussion will cover key considerations required to deploy a successful investment strategy targeting the region.
Footnotes:
[1] IMF October 2020 Dataset; Mbuyu Capital Analysis.
[2] United Nations, Department of Economic and Social Affairs, Population Division (2019).
[3] TRALAC, as at 15/3/2021 (ACFTA status); World Bank Databank (GDP data).
[4] United Nations, Department of Economic and Social Affairs, Population Division (2019).
[5] United Nations, Department of Economic and Social Affairs, Population Division (2019).
[6] United Nations, Department of Economic and Social Affairs, Population Division (2019).
[7] UNCTADSTAT, Mbuyu Capital analysis.
[8] African Private Equity and Venture Capital Association, 2020 Annual African Private Equity Data Tracker, March 2021.
[9] GSMA; ‘State of the Industry Report on Mobile Money 2021’, March 2021.
[10] Partech Africa Report 2020.
[11] Partech Africa Report 2020.
[12] Preqin; ‘Quarterly Update Private Equity & Venture Capital’, Q3 2020.
[13] Preqin; ‘Investor Update: Alternative Assets’, H1 2020.
[14] Bain & Company Global Private Equity Report 2021 (Global Buy-out); Mbuyu Capital Akili database (116 deals of USD 10m+, realised or held for >9 years, excluding natural resources deals, invested in 2000 or after)
[15] Bain & Company Global Private Equity Report 2021 (Global Buy-out); Mbuyu Capital Alkili database (116 deals of USD 10m+, realised or held for >9 years, excluding natural resources deals, invested in 2000 or after).
[16] Source: P. Mooradian et al., “Growth Equity: Turns Out, It’s All About the Growth.” Cambridge Associates Research Publications. Accessed January 2019. Mbuyu Capital Alkili Database (realised deals and deals held for >9 years since 2000, excluding natural resources).
[17] Preqin 2020. “Investor Update Alternative Assets, H2 2020.” Preqin Insights.
[18] Sources: 1) US & Europe LBO: Bain & Company, Global Private Equity Report 2021 (S&P LCD); 2) US Growth: Cambridge Associates LLC Private Investments Database (as reported by investment managers, FactSet Research Systems, and Frank Russell Company); and 3) Africa: Riscura, ‘Bright Africa Report’, 2020 (RisCura analysis, S&P Capital IQ, Pitchbook).
[19] Harrington, S., D. S. Bakewell, C. Cannon, and M. Benhamou. “Titans of Junk: Behind the Debt Binge That Now Threatens Markets.” Bloomberg. July 11, 2018. https://www.bloomberg.com/graphics/2018-corporate-debt/.
[20] Riscura, ‘Bright Africa Report’, 2020 (US & Africa) and Pitchbook (Europe).
[21] Mbuyu Capital Partners Analysis.
About the Authors:
David Donahue, CFA, joined Mbuyu Capital Limited in 2015 as a partner. Mbuyu Capital brings the unique investment opportunities offered by African private markets to institutional investors. Africa is a market neglected by commercial investors where we invest in exceptional, profitable, and uncorrelated opportunities in private equity and credit. We bring 50+ years' experience in developed market and African investing, local networks in all investable African countries and a thoughtful, analytical, and risk-aware approach to our investments. We have the confidence of one of the UK's leading pension funds, for whom we manage a large discretionary portfolio focused on Africa. Any well-managed African investment creates meaningful ESG impact and advances the UN's Sustainable Development Goals. Africa also presents an exceptional opportunity to create real impact-led portfolios. Our impact strategies focus on delivering targeted impact with attractive financial returns.
Before joining Mbuyu, David was Head of PE and RE at Ignis Advisors, responsible for a $1bn portfolio. Previously, he was responsible for a $2bn global equity sector portfolio at the Dutch pension fund APG as well as $2.5bn US equity portfolio manager at a Dutch insurer. David holds bachelor’s degree in Economics from Boston College, Massachusetts and an MBA, Finance from the Isenberg School of Management at the University of Massachusetts. He also holds the CFA qualification.

Michiel Timmerman is a Managing Partner at Mbuyu Capital Partners, London, UK. https://www.linkedin.com/company/mbuyu-capital-partners-ltd/ . Mbuyu Capital Partners is an investment company focusing exclusively on Africa, managing portfolios of funds and direct investments for institutional clients and impact investors.