


By Paul R. Kenney, Jr., CFA Managing Director, Syntax Advisors.
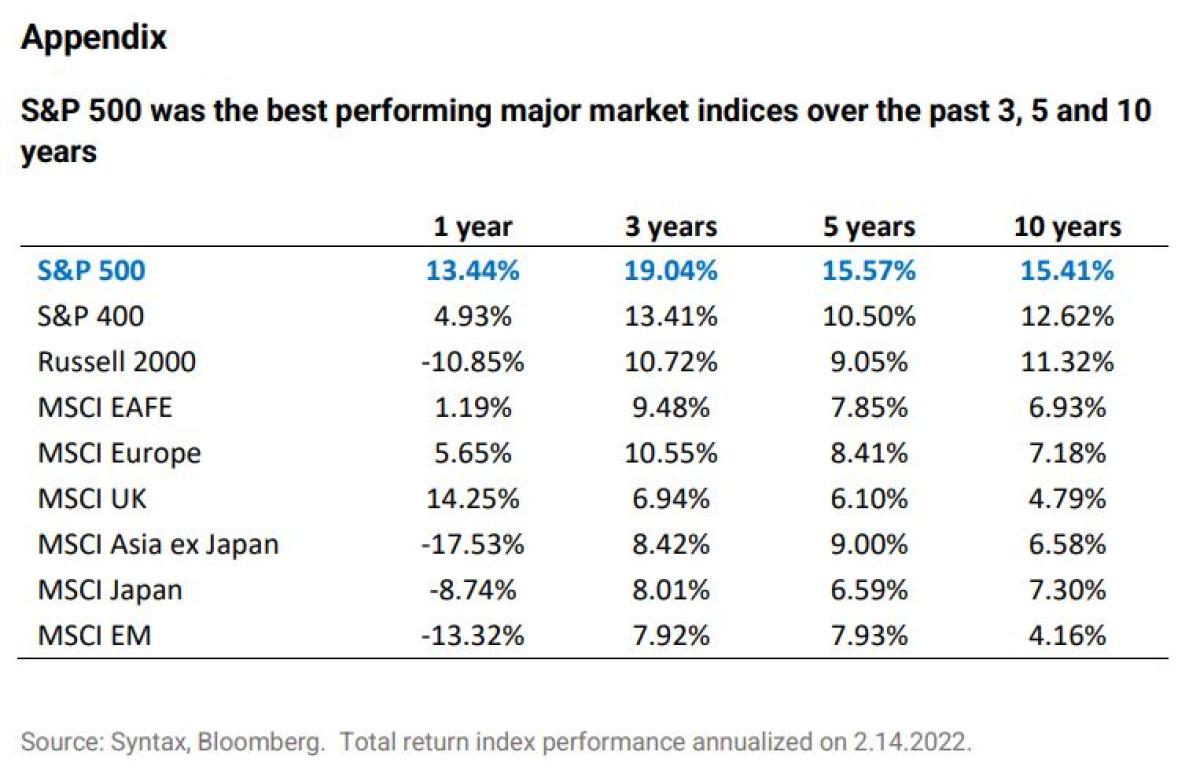
The largest three passive S&P 500 ETFs have a combined AUM of over a trillion dollars1 and have not only risen 130% over the past five years but have outperformed 73% of all active managers2 . A confluence of factors saw technology stocks deliver double the market return over the period, including cheap valuations (Apple was on a P/E of 10x in 2017), Amazon’s dominance over brick-and-mortar retailers and the Pandemic catalyzing a digital revolution. As technology outperformed, the S&P 500 became the best performing major market index in the world (see Appendix).
Following its persistent outperformance, the risks are now higher than ever that the S&P 500 will underperform if the investment regime changes. Its main holding, large cap technology (which now accounts for 42% of the index3 ) is highly exposed to several potential headwinds in 2022, including interest rate hikes, rising vaccination rates, increased regulation, and overly optimistic valuations. A change in the prevailing market dynamic could cause one (or more) of these headwinds to reverse the long-run market trends and see cap weighted products underperform their alternatively weighted counterparts.
In general, investment regimes are a significant driver of the relative performance between cap weighted strategies and alternative weighted strategies. This report explores the different types of regime shifts (Exhibit 1), explaining how and when they occur and their impact on index performance.
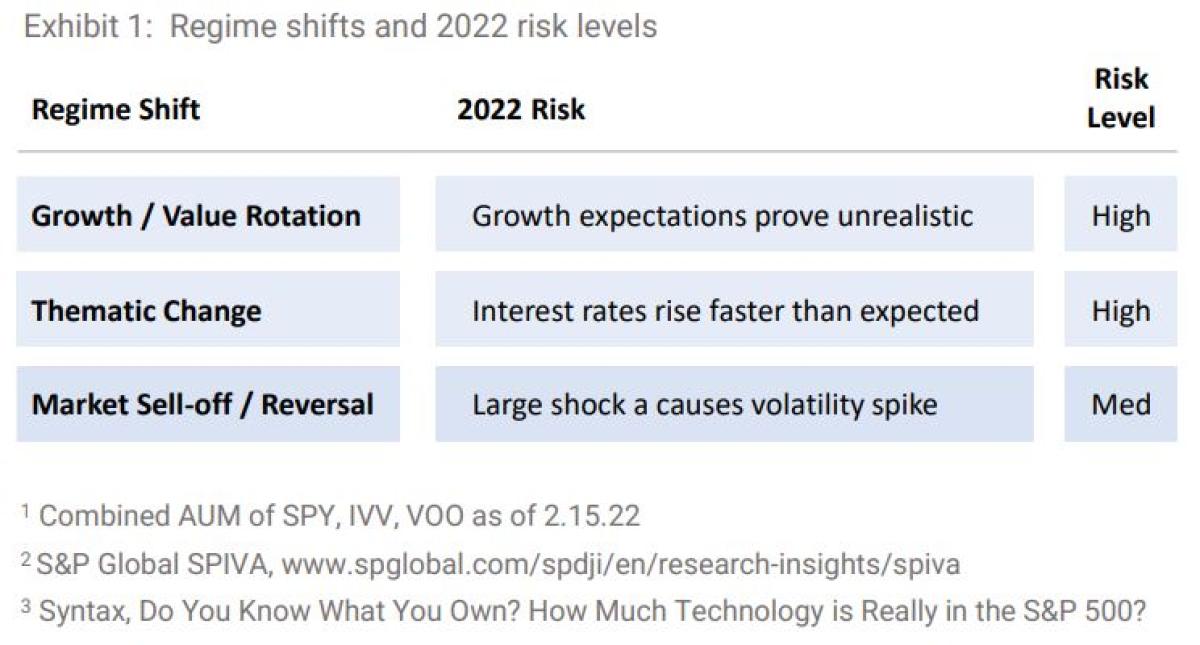
Regime Shifts and Cap Weighted Benchmarks. A regime shift is a change in market dynamics, usually brought on by a change in economic conditions. In this note we distinguish between three types of regime shifts:
- Sell-offs and Reversals. Large market moves that are driven by behavioral factors (such as fear and greed) which manifest as changes in discount rate assumptions, causing the market to sharply sell-off and then dramatically reverse as confidence returns and investors scramble to reenter the market in search of a quick profit. Cap weighted strategies usually underperform due to their low weightings in the most sold-off stocks at the trough, which often outperform the most in a recovery.
- Growth and Value Rotations. Changes in investment style can significantly impact portfolio performance. The two most widely followed investment styles are Value (low multiple stocks) and Growth (stocks with high future earnings growth). At the tail-end of a bubble, a realization that growth expectations will not be met causes a crowded exit from popular growth names (as seen recently with Netflix and Facebook). Cap weighted strategies underperform due to their oversized exposures in high multiple, large cap growth stocks.
- Thematic Changes. Secular changes in market conditions that often last for many years, Cap weighted strategies underperform due to their overweight positions in themes that have already prevailed and have become dominant weights in the index. Such positions are at risk of underperforming when the theme reverses. e.g., interest rates normalizing faster than the market anticipates, causing high growth and over-leveraged stocks to underperform.
Major regime changes can, and often do, involve a combination of these market forces. For example, the Coronavirus Pandemic caused investor panic and a fearbased sell-off in February and early March 2020, when all risk assets declined. As the Fed stepped in and injected unprecedented liquidity a reversal ensued and all risk assets recovered. As the Pandemic progressed, the overarching theme was “stay at home” stocks outperformed and “reopening” stocks underperformed. When the majority of the population became vaccinated, investor confidence returned and a broader move into value stocks occurred.
We now explore each type of regime shift in the context of market cap vs alternative weighted indices.
Regime Shift #1: Sell-offs and Reversals
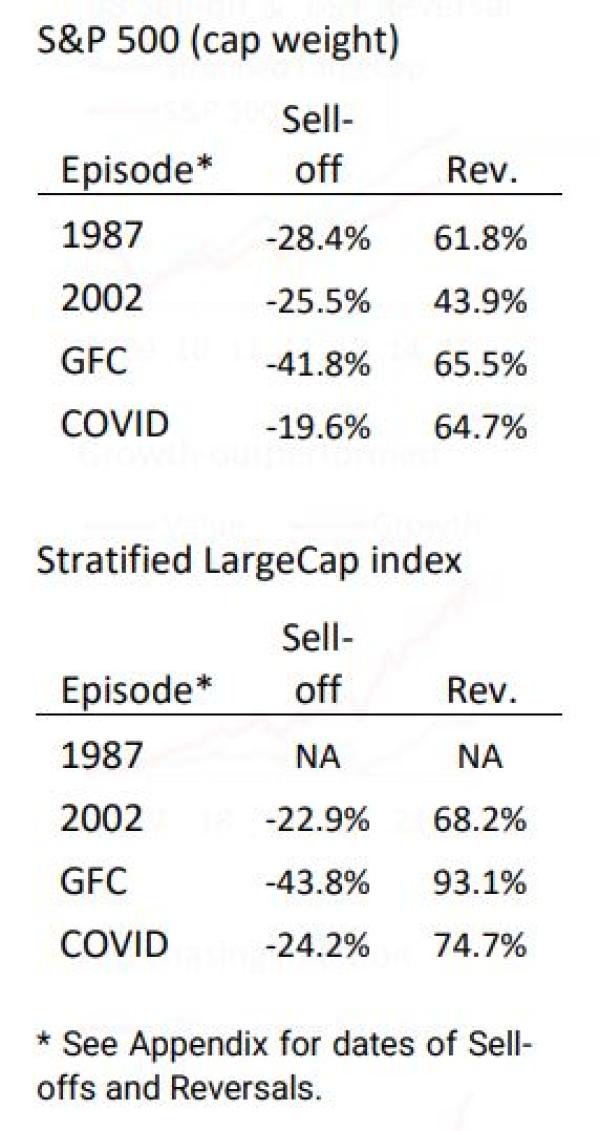
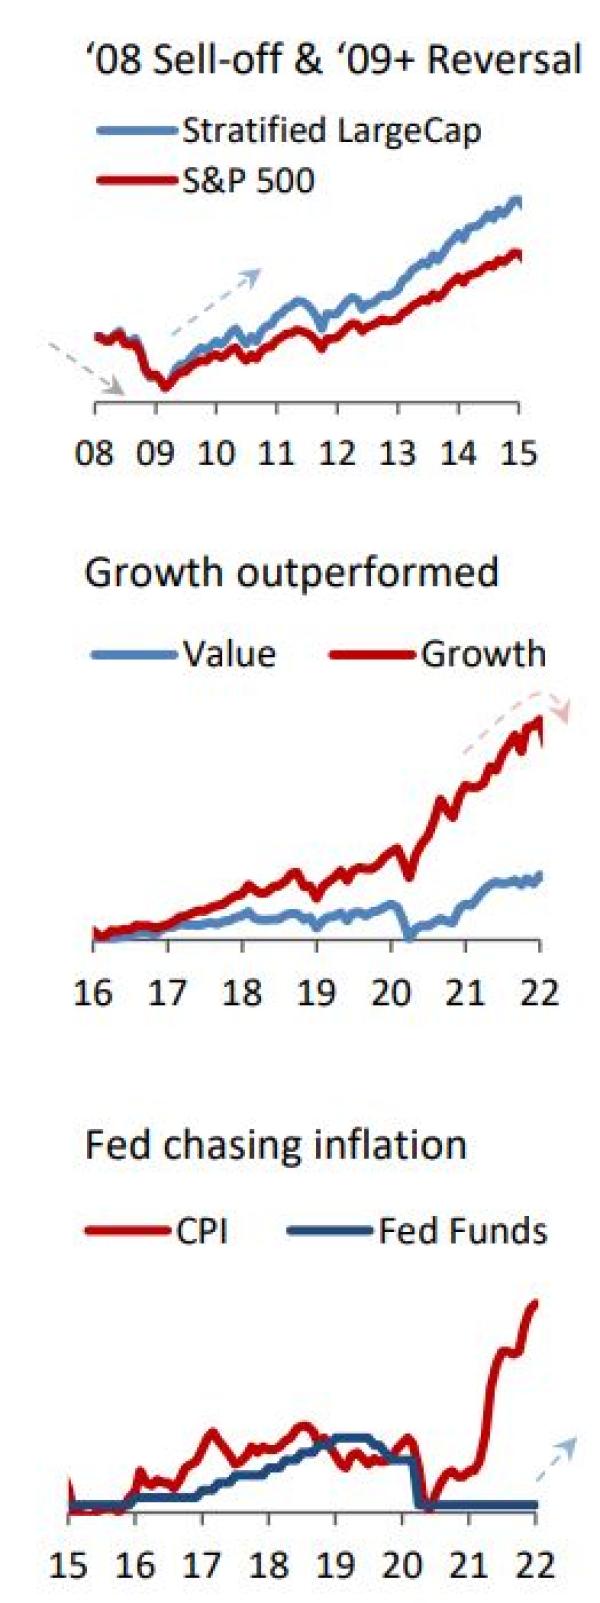
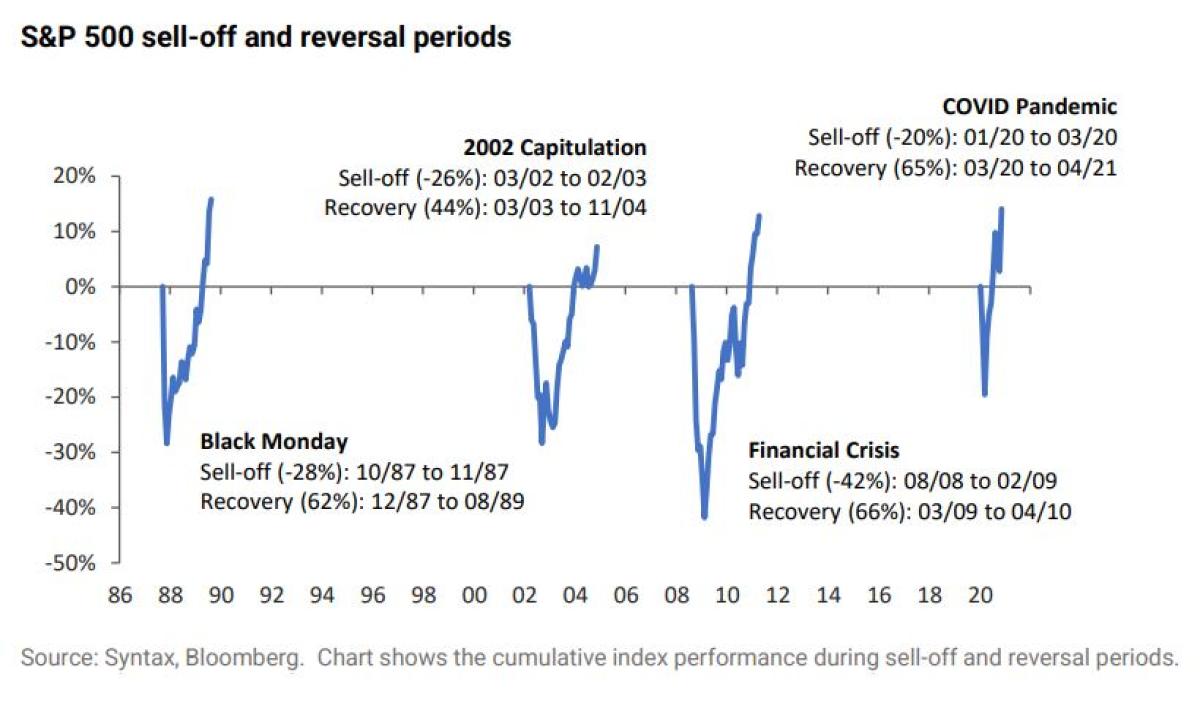
The last two major market shocks, the 2008/9 Global Financial Crisis (GFC) and the COVID pandemic, despite having completely different underlying factors were unified by similar human behaviors, namely fear and greed. While we have seen this behavior replay time and time again for different reasons, the magnitude of loss aversion by investors is often very similar. These two selloffs, despite having different root causes, later caused strong headwinds for cap-weighted indices. As a result, during the subsequent recovery, Cap Weight significantly underperformed many alternative weight strategies, such as Stratified Weight, over the entire sell-off and recovery episode (see sidebar).
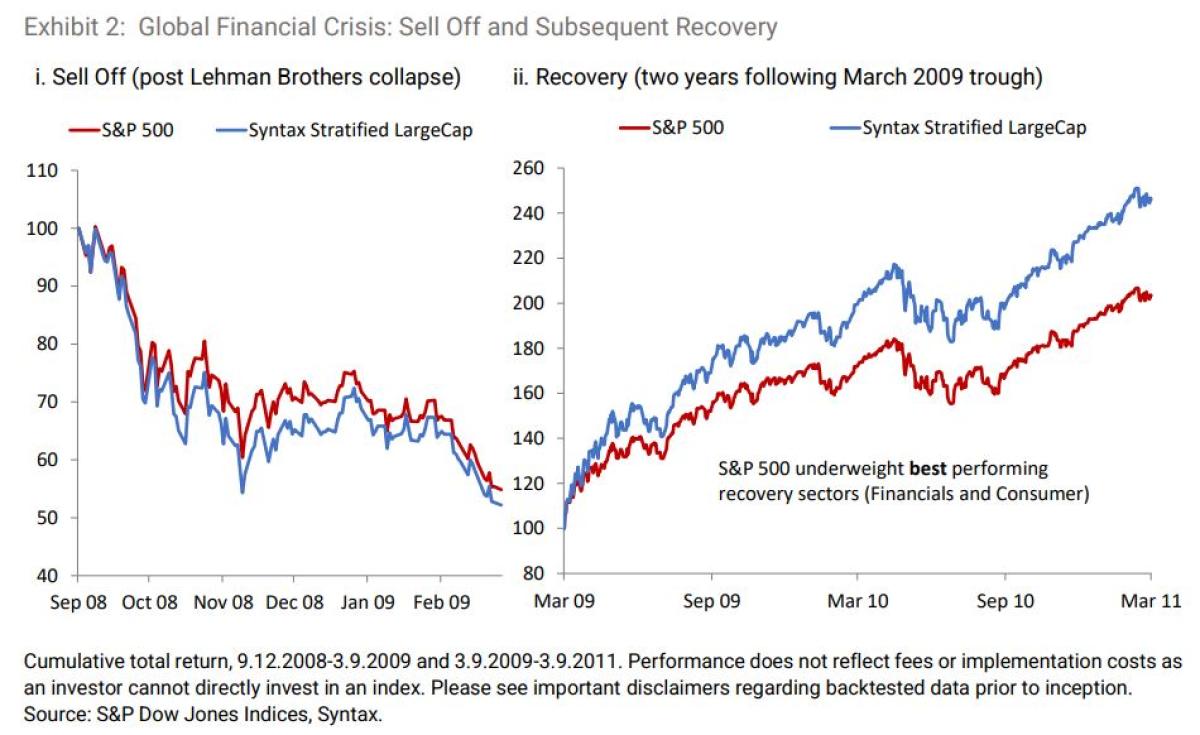
There were two regimes in 2008 and 2009: (i) a sharp sell-off, which picked up steam when Lehman Brothers collapsed on September 15th, 2008, and bottomed out almost six months later on March 9th, 2009; and (ii) a sharp recovery when the Fed intervened, and confidence ultimately returned (Exhibit 2).
Cap weighted strategies often underperform stratified weight during the recovery phase due to their low weightings in the most sold-off sectors. For example, in March 2009, the S&P 500 had only 8.9% in Financials, down from 20% at the start of 2007. The Financial sector subsequently recovered 143% over the next two years. Cap weight’s dynamic of underweighting the worst performers, only to see them revert the most during a recovery is a key driver of the relative performance of alternative weighted indices, especially those which frequently rebalance.
Regime Shift #2. Growth and Value Rotation
Our second regime shift relates to the style rotation between Value and Growth. Value investors are driven by the belief that stocks whose fundamentals are undervalued by the market will eventually benefit from multiple expansion (or those which are expensive will see multiple contraction). Such opportunities are greatest when relative valuations are widest. Growth stocks on the other hand attract investors looking for stocks where the market is underestimating the future earnings growth of a company.
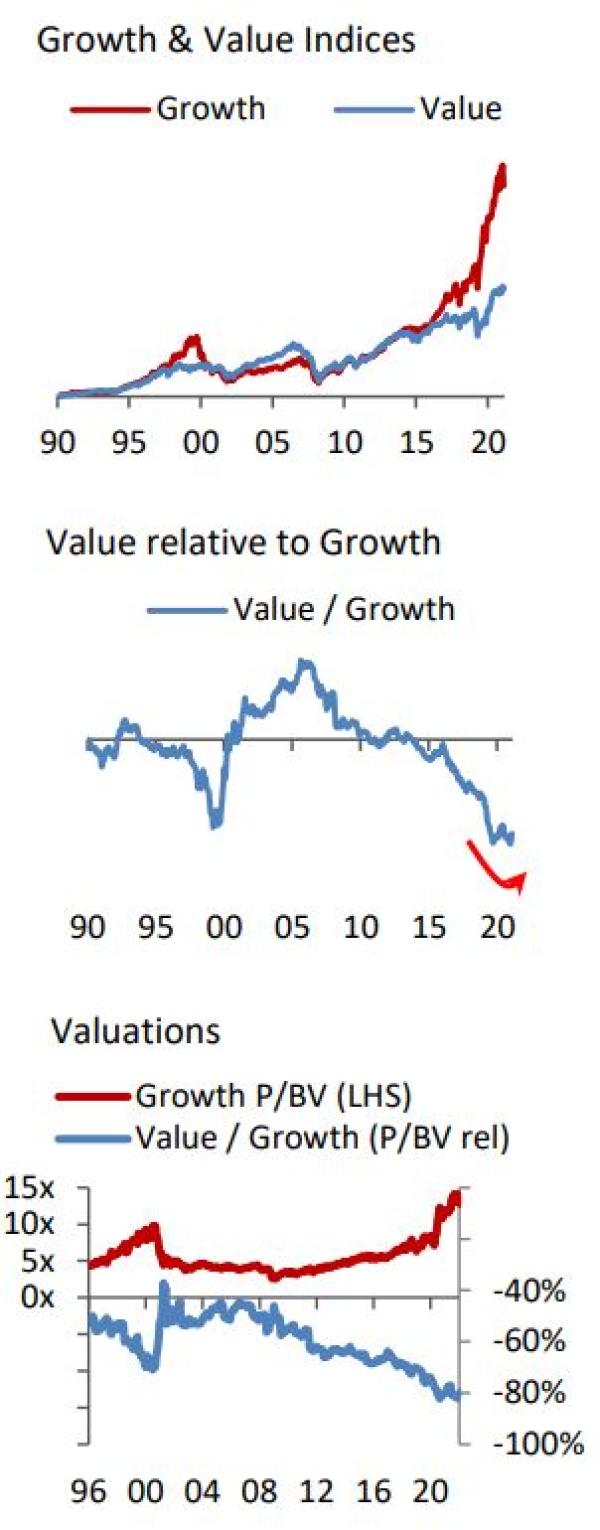
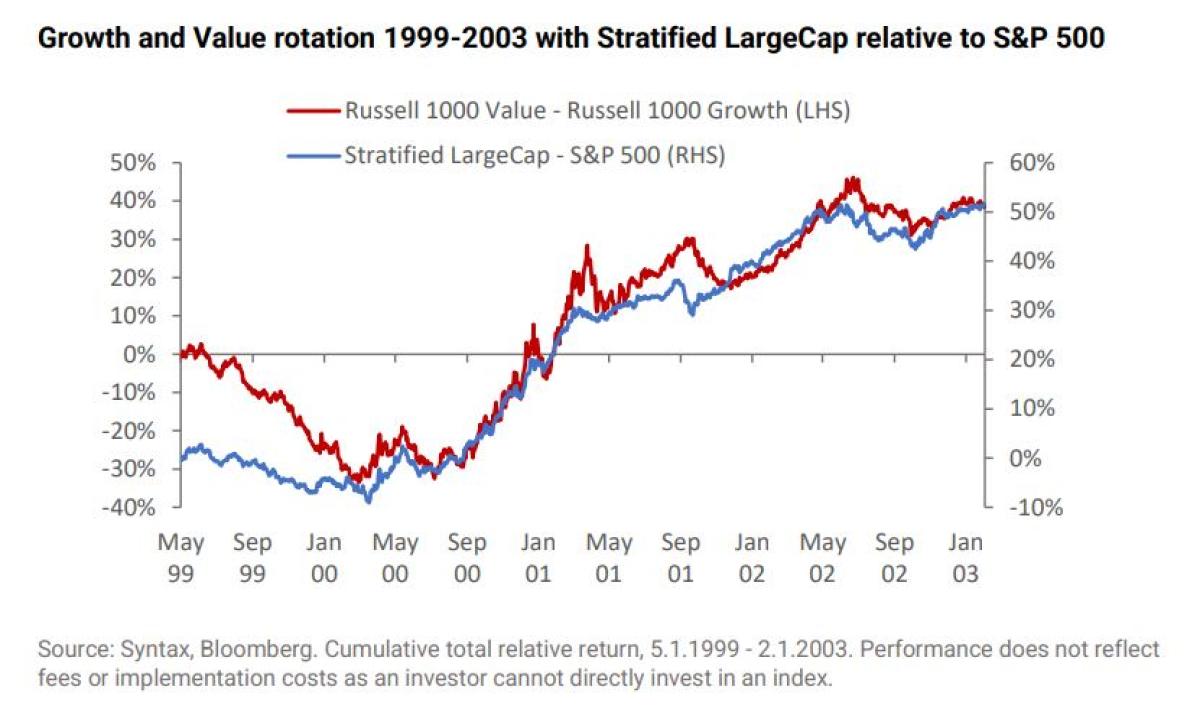
When earnings expectations are at historical highs, which happens after a protracted rally (such as the one seen since 2016), many stocks become “priced to perfection” and the likelihood for future earnings upgrades is low and the potential for disappointment is high. This was the case at the end of the Dotcom bubble when Growth companies were trading at extreme valuations (10x book value or 44x forward earnings) and when earnings eventually disappointed, investors raced to sell Growth stocks and buy Value. This caused Value to outperform Growth for five years following the bursting of the Dotcom bubble.
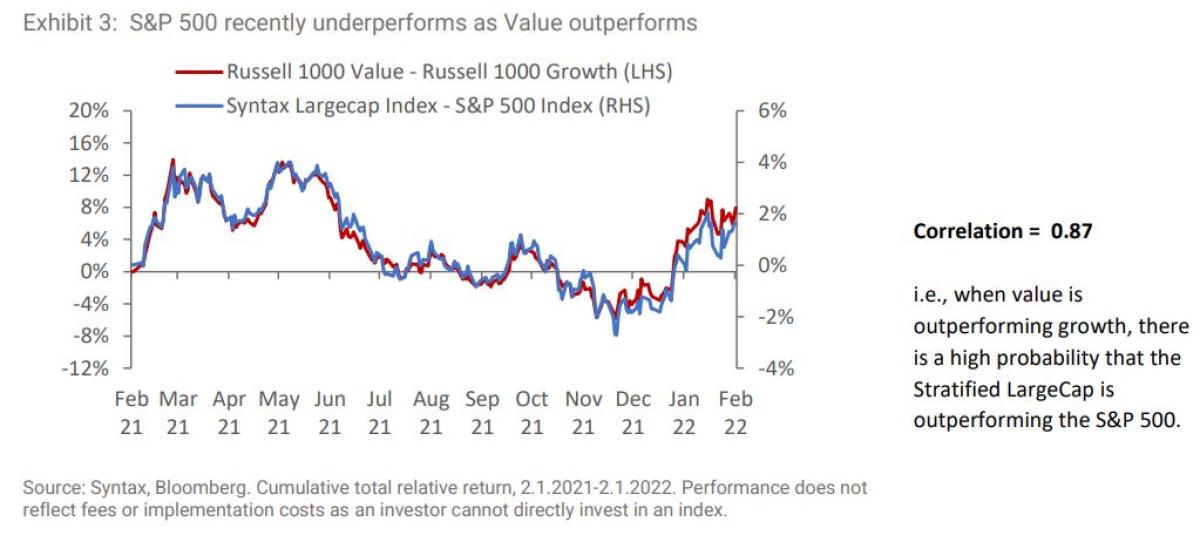
The switch from Growth to Value is likely a headwind for market cap weighted strategies since cap weight is usually overweight in growth stocks. In a bubble, price growth outstrips earnings growth, especially in growth companies which become relatively more expensive. Alternative weighted strategies frequently rebalance their weights and by doing so sell the outperforming growth stocks and move their weights back to their target, thereby injecting a relative value bias. This was also the case for the Growth / Value rotation following the DotCom bubble (see Appendix). We are beginning to see Value outperform Growth this year and with-it Stratified Weight outperform Cap Weight (Exhibit 3).
Regime Shift #3: Thematic Changes
The third type of regime shift is driven by a change in market theme. A theme is a persistent trend which impacts a group of companies simultaneously. Themes often span several different sectors and may persist for a few months (e.g., the supply chain shock in September 2021) or several years (like the outperformance of Technology-related companies). Themes are often driven by commodity prices (e.g., oil), economic trends (e.g., inflation), politics (e.g., infrastructure spending), as well as innovation (e.g., electric vehicles or Artificial Intelligence).
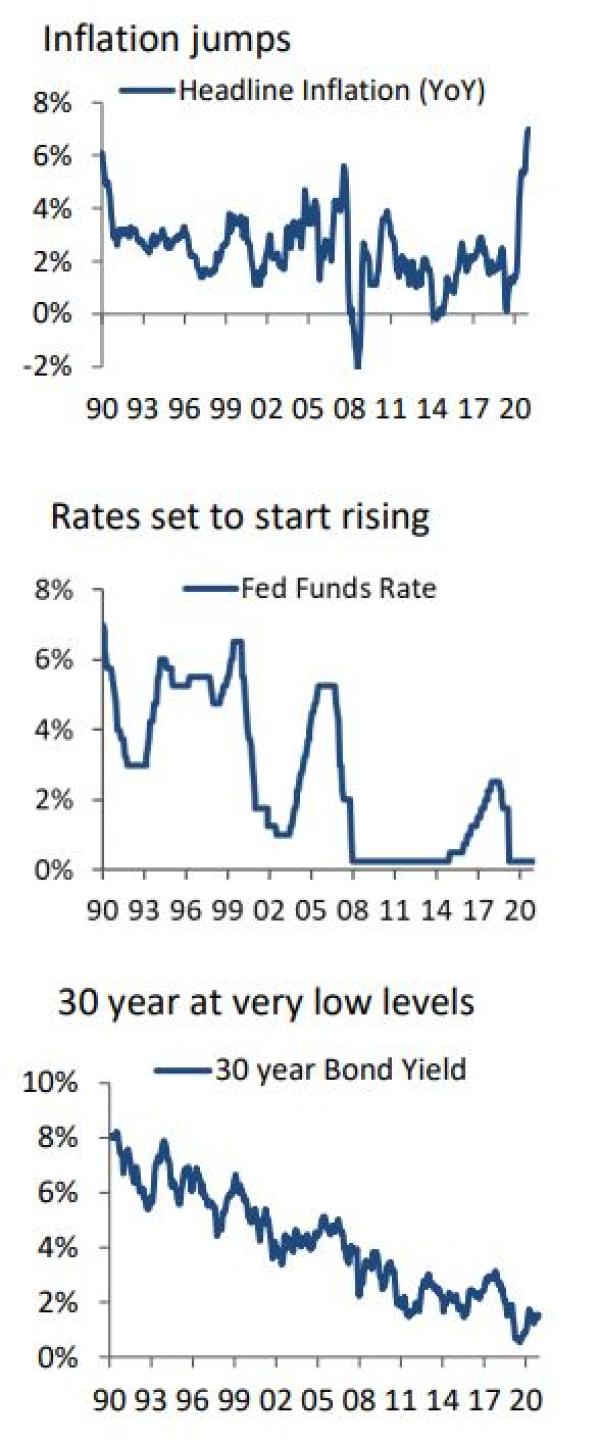
The most dominant theme so far in 2022 has been high inflation. The Headline CPI rate has risen over two percentage points since September 2021 (from 5.4% to 7.5% in January). This rise has been attributed to the unprecedented amount of stimulus injected by the Federal Reserve since 2008, which has sent the US long bond falling to roughly 2%. As the Fed gradually removes its stimulus over the coming years, the risk of an inflation driven regime shift is rising and with it another risk to the relative performance of the S&P 500.
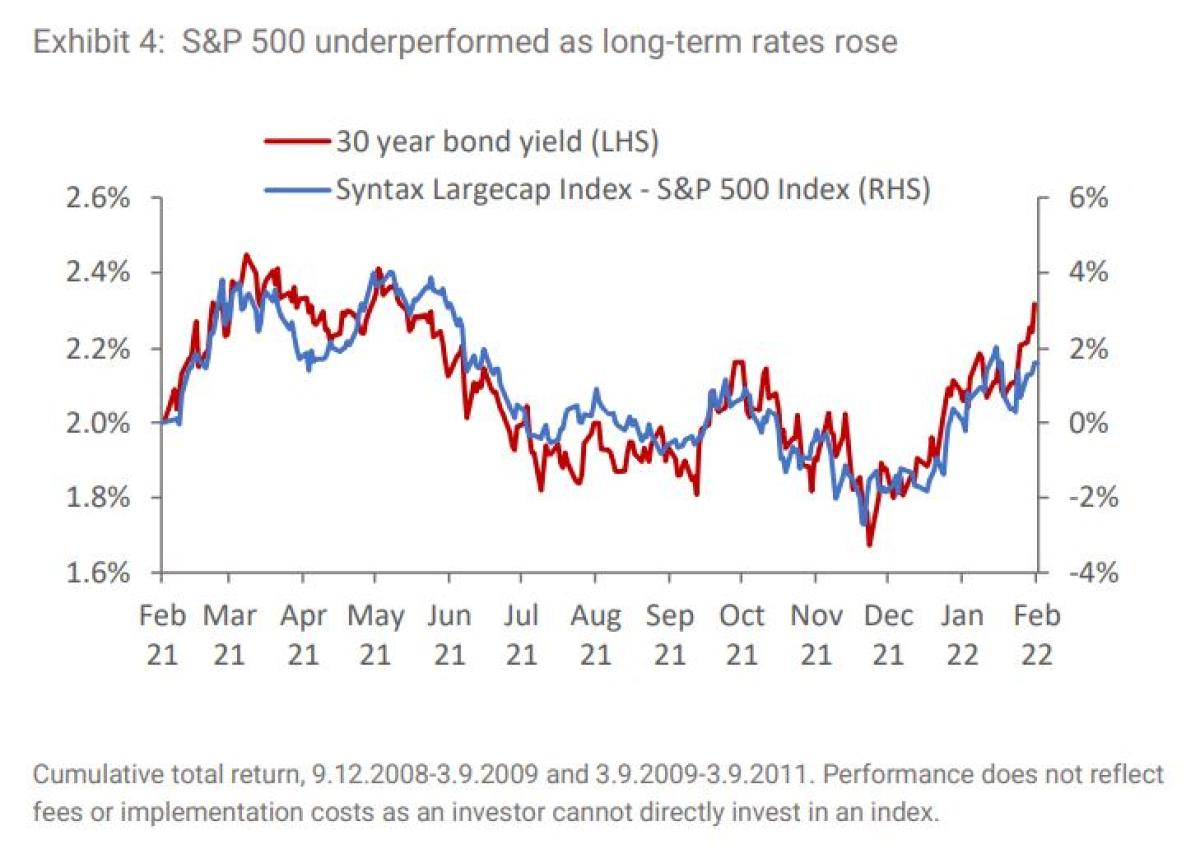
Over the past year, the relative return of the S&P 500 versus the Stratified Large Cap index has been consistent with the rise and fall of the US long bond yield. A 20bps rise in the US long bond yield has been consistent with 2% outperformance of the Syntax Stratified Large Cap index over the S&P 500 (Exhibit 4). The US 30-year yields roughly 2.35% at the time of writing, which is significantly lower than its average over the last ten years of 2.7% and twenty year average of 3.6%, leaving significant scope for it to normalize and with it Value to outperform Growth.
Conclusion
Since 2016, the S&P 500 has performed very strongly, supported by a favorable interest rate environment and the widespread adoption of technology. The S&P 500 index is now more concentrated in mega-cap technology stocks than it was at the height of the DotCom Bubble, leaving it highly exposed to changes in the long-term investment regime.
In 2022, it’s likely that the Fed will attempt to tread the tightrope of raising interest rates to combat high inflation, without damaging economic growth. If inflation continues to rise and breaches 8% (a level not seen since the 70s), then it is highly likely that the Fed will have to raise rates faster than anticipated and technology will underperform. Furthermore, with valuations at historical highs, disappointing quarterly earnings, could manifest as a crowded exit out of technology into some of the underserved sectors in the S&P 500, such as Energy, the Consumer or Food.
This shift would see the S&P 500 significantly underperform alternatively weighted products such as the Syntax Stratified Large Cap index, which reweights the same stocks as the S&P 500, but with diversified exposures that allocate equally across all major sectors and is therefore not overweight in technology or any other business risk.
About the Author:
Paul joined Syntax Advisors in 2021 as a Managing Director focusing on product development and client solutions for the institutional market. In this role, he works closely with the firm’s Research and Data Science teams on the design of the company’s Stratified index products and the functionality of the firm’s Affinity software.

Affinity is designed to help plan sponsors, investment managers, and fiduciaries better understand the business risks embedded in their portfolios. Prior to joining Syntax, Paul worked at NEPC for nearly 20 years where he held leadership positions overseeing NEPC’s Detroit office and serving as the consulting team leader for both the Corporate Defined Benefit and Healthcare teams. Paul’s experience also includes his role at Ford Motor Company where his responsibilities included overseeing the company’s $37 billion defined benefit pension plan and a $15 billion fixed income operating portfolio.