


Jason Hill, Senior Vice President, Co-Portfolio Manager and Jimmy Young, CFA, VP, Co-Portfolio Manager at Calamos Investments.
If you asked most people to draw a picture of this year’s markets, many would likely try to capture volatility that stocks have delivered—like a jagged saw-toothed line. But option skew, or S&P 500 volatility skew, is at its flattest level in 10 years. Option skew is the difference in implied volatility (the market's forecast of a likely movement in a security’s price) between out-of-the-money options, at-the-money options, and in-the-money options. Option skew provides information on whether fund managers prefer to be buyers or sellers and which options they prefer (calls or puts). This flattening process can create its own set of challenges for hedged equity strategies. Spoiler alert: We see this most likely as a short-term anomaly and maintain high conviction in our hedging approach.
A Recap of Option Pricing
Before going any further into option skew, let’s take a look at how options are priced. In the most basic terms, the value of an option is determined by the underlying asset price, the strike price, the time left before the option’s expiration date, and the implied volatility of the underlying asset. Although the price, strike, and time left before expiration are known variables at every point, the concept of implied volatility can be a little trickier to understand. When you have an asset with a greater expected volatility, there’s a greater probability that it will reach the strike price of your option. So generally, the higher the implied volatility, the higher the option price and vice versa.
What Is Option Skew?
If we graph out the implied volatility for the S&P 500 Index for a given expiration date against the different strike prices, we can see that when we talk about “skew,” we are referring to the level of implied volatility for options with different strike prices. In Figure 1, the “percent of moneyness” (also referred to as strike price) is on the X-axis and the implied volatility is on the Y-axis.
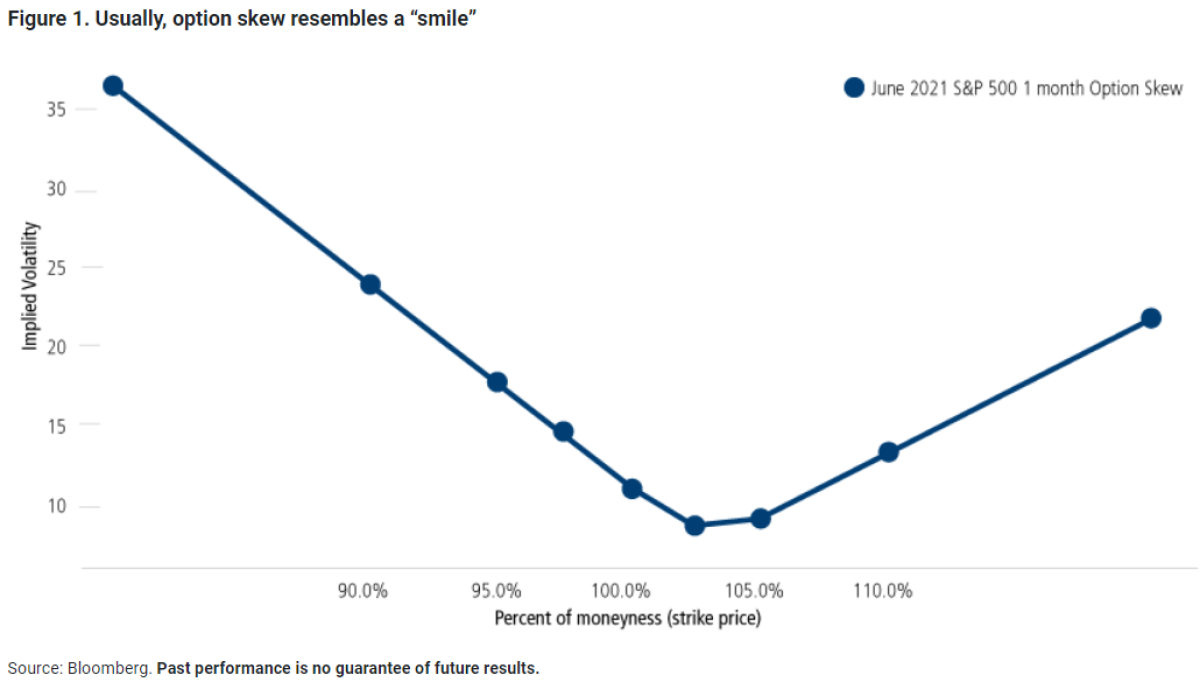
The implied volatility levels are higher on strike prices that are further away from 100% or the at-the-money option (the at-the-money strike is when the strike price is the same as the underlying asset price). For this discussion, we will consider options below 100% to be puts and options above 100% to be calls.
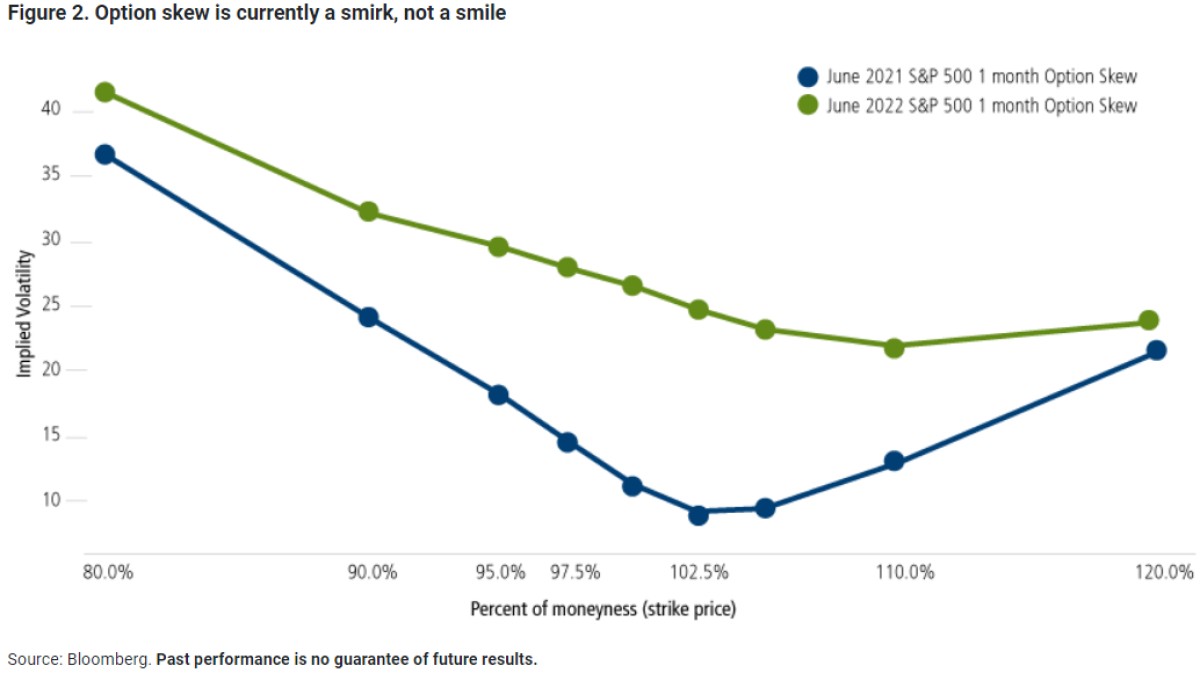
Under normal circumstances, option skew resembles a “smile” with the corners of the line curved upward. When option skew flattens out, the curve is sometimes described as more of a “smirk.” Figure 2 shows the current environment’s option skew flattening out into a smirk (green line) versus the more normal smile shape from June 2021 (blue line).
Why Is Option Skew Flat?
Puts are not being bid up relative to calls during this big sell-off (illustrated by the higher left corner of the smile and smirk). There are a few possible reasons why investors have not been scrambling to buy out-of-the money puts on this 20% drawdown:
- The slower march-down of this year’s sell-off has made it difficult to have hedging and long volatility pay off. As of July 1, the decline in the S&P 500 had lasted 114 business days, with the market only falling an average of 20 basis points per day. For example, if you own a 5% out-of-the-money put option that expires in 24 days, a slow grind down of 20 basis points per day for 24 days accumulates to a downward move of 4.8%. You’d still lose 100% of your money even though the market was down almost 5%.
- Heading into the year, we believe many investors were already hedged and have since monetized their positions. Now that the S&P 500 is already down 20% for the first half of 2022, some investors expect market symmetry to be skewed more to the upside than the downside. So, to those investors, buying an out-of-the-money put would be like buying insurance on something that’s already damaged or lost.
- Since 2020, there has been less assets in short volatility strategies. The Covid-19 market drawdown was swift and violent, with the CBOE Volatility Index (VIX) exploding past 80 in March 2020, more than four times the 10-year average of 17.5. Many investors and traders who used short volatility as their principal strategy going into the Covid drawdown experienced major losses in a short time. When you are short volatility, you become a natural buyer of volatility in down equity markets in order to close your short positions—typically for risk management reasons. With few short volatility investors remaining after the Covid selloff, we’ve seen less covering of short volatility positions when the market is falling.
- We believe there was a strong bid to puts in 2021 because of hedging related to certain exotic insurance products. With this year’s selloff, there has been a systematic decrease in demand for puts related to these products, which has resulted in flatter skew.
Why Does Option Skew Flattening Matter?
The unusual conditions in this year’s option market have resulted in lackluster performance in certain hedging strategies. Typically, in a large sell-off, we would see the implied volatility of put options increase, causing an increase in the value of the option. However, so far in 2022, the implied volatility of puts is actually down. To put it in perspective, the decline in implied volatility is the largest of any S&P 500 sell-off of more than 10% in the past 25 years.
As a result, the performance of put hedges has underperformed expectations. For example, if an investor had tried to hedge their position in the S&P 500 using one month, 5% out-of-the money puts, their hedged portfolio would still be down 20% year to date (as represented by the CBOE S&P 500 5% Put Protection Index).
Taking the Smirk in Stride
Although hedging and protecting equities using S&P 500 options has been challenging so far this year, we are still finding opportunities to hedge potential downside. For example, with the disparity between calls and puts being much tighter than normal (flatter skew), we’re able to buy more puts than usual while selling the same number of calls. If you’re financing your put protection by using call selling, you’re getting more bang for your buck!
Despite the unusual conditions we’ve seen in the market, we maintain conviction in our approach and believe hedged equity strategies can continue to provide investors with broad market exposure while actively hedging against equity market risk. When using options as a hedge, we believe in a flexible approach. The ability to react and adapt to shifts in the volatility landscape can have a large impact on the performance of the hedge.
Watch Joseph Cusick and Jason Hill's webinar on Building the Portfolio of the Future
About the Author:
Jason Hill, Senior Vice President, Co-Portfolio Manager is responsible for portfolio management and investment research, focusing on market neutral and hedged equity strategies.

He joined Calamos in 2004 and contributes more than 20 years of industry experience. Prior to joining Calamos, he worked at HFR Asset Management, LLC, with responsibilities in risk and portfolio management. Jason received a BA in Finance from North Central College and an MS in Finance from DePaul University.
Jimmy Young, CFA, Senior Vice President, Co-Portfolio Manager is responsible for portfolio management and investment research, focusing on market neutral and hedged equity strategies.
He joined the firm in 2003 and has 19 years of industry experience. Jimmy holds a BS in Finance from Northern Illinois University.
Disclaimer:
Opinions, estimates, forecasts, and statements of financial market trends that are based on current market conditions constitute our judgment and are subject to change without notice. The views and strategies described may not be appropriate for all investors. References to specific securities, asset classes and financial markets are for illustrative purposes only and are not intended to be, and should not be interpreted as, recommendations.
This material is distributed for informational purposes only. The information contained herein is based on internal research derived from various sources and does not purport to be statements of all material facts relating to the information mentioned and, while not guaranteed as to the accuracy or completeness, has been obtained from sources we believe to be reliable.
Options Risk. Options strategies entail risk. An investor’s ability to close out a position as a purchaser or seller of an over-the-counter or exchange-listed put or call option is dependent, in part, upon the liquidity of the option market. There are significant differences between securities and options markets that could result in an imperfect correlation among these markets, causing a given transaction not to achieve its objective.
An investor’s ability to utilize options successfully will depend on the ability of the investor to predict pertinent market movements, which cannot be assured.
Indexes are unmanaged, do not include fees or expenses and are not available for direct investment. The S&P 500 Index is considered generally representative of US large cap stocks. Cboe S&P 500 5% Put Protection Index (PPUT) is a benchmark index designed to track the performance of a hypothetical risk-management strategy that consists of a long position indexed to the S&P 500 Index (SPX & Index) and a long position in the monthly 5% Out-of-the-Money (OTM) SPX Put options. VIX Index is a calculation designed to produce a measure of constant, 30-day expected volatility of the U.S. stock market, derived from real-time, mid-quote prices of S&P 500® Index (SPX℠) call and put options. On a global basis, it is one of the most recognized measures of volatility -- widely reported by financial media and closely followed by a variety of market participants as a daily market indicator.
Before investing, carefully consider the fund's investment objectives, risks, charges and expenses. Please see the prospectus and summary prospectus containing this and other information which can be obtained by calling 1-800-582-6959. Read it carefully before investing.
©2022 Calamos Investments LLC. All Rights Reserved. Calamos®, Calamos Investments® and Investment strategies for your serious money® are registered trademarks of Calamos Investments LLC.
Calamos Investments LLC, referred to herein as Calamos Investments®, is a financial services company offering such services through its subsidiaries: Calamos Advisors LLC, Calamos Wealth Management LLC and Calamos Financial Services LLC.